but that need a swift response when they do, this method could cause a slow ..... ios, only loosing to the SA algorithm in the first scenario, which was easier and more prone to lucky guesses. ..... A tutorial on simulation optimization. In WSC.
Dynamic Scenario Simulation Optimization
Andr´e Monteiro de Oliveira Restivo
A Thesis presented for the degree of Master in Artificial Intelligence and Intelligent Systems
Supervisor: Prof. Lu´ıs Paulo Reis
Universidade do Porto Faculdade de Engenharia June 2006
Dedicated to
My Parents, for the support and Filipa, for caring
Dynamic Scenario Simulation Optimization Andr´e Monteiro de Oliveira Restivo
Submitted for the degree of Master in Artificial Intelligence and Intelligent Systems
June 2006
Abstract The optimization of parameter driven simulations has been the focus of many research papers. Algorithms like Hill Climbing, Tabu Search and Simulated Annealing have been thoroughly discussed and analyzed. However, these algorithms do not take into account the fact that simulations can have dynamic scenarios. In this dissertation, the possibility of using the classical optimization methods just mentioned, combined with clustering techniques, in order to optimize parameter driven simulations having dynamic scenarios, will be analyzed. This will be accomplished by optimizing simulations in several random static scenarios. The optimum results of each of these optimizations will be clustered in order to find a set of typical solutions for the simulation. These typical solutions can then be used in dynamic scenario simulations as references that will help the simulation adapt to scenario changes. A generic optimization and clustering system was developed in order to test the method just described. A simple traffic simulation system, to be used as a testbed, was also developed. The results of this approach show that, in some cases, it is possible to improve the outcome of simulations in dynamic environments and still use the classical methods developed for static scenarios.
Optimiza¸ c˜ ao de Simula¸ co ˜es em Cen´ arios Dinˆ amicos Andr´e Monteiro de Oliveira Restivo
Submetido para obten¸ca˜o do grau de Mestrado em Inteligˆencia Artificial e Sistemas Inteligentes
Junho de 2006
Resumo A optimiza¸ca˜o de simula¸co˜es parametriz´aveis tem sido o tema de variados artigos de investiga¸ca˜o. Algoritmos, tal como o Hill Climbing, Tabu Search e o Simulated Annealing, foram largamente discutidos e analisados nesses mesmos artigos. No entanto, estes algoritmos n˜ao tomam em aten¸ca˜o o facto das simula¸co˜es poderem ter cen´arios dinˆamicos. Nesta disserta¸ca˜o, a possibilidade de usar os m´etodos de optimiza¸ca˜o cl´assicos referidos, combinados com t´ecnicas de clustering, de forma a optimizar simula¸co˜es parametriz´aveis envolvendo cen´arios dinˆamicos, vai ser analisada. Para atingir este objectivo, as simula¸co˜es ir˜ao ser optimizadas em v´arios cen´arios est´aticos gerados aleatoriamente. Os resultados o´ptimos encontrados para cada um destes cen´arios ser˜ao depois agregados de forma a obter-se um conjunto de solu¸co˜es t´ıpicas para cada simula¸ca˜o. Estes resultados t´ıpicos, podem depois ser usados em simula¸co˜es com cen´arios dinˆamicos, como referˆencias que ir˜ao ajudar a simula¸ca˜o a adaptar-se ao cen´ario actual. Um sistema gen´erico de optimiza¸ca˜o foi desenvolvido de forma a testar o m´etodo descrito. Um sistema de simula¸ca˜o de tr´afego, usado como caso de teste, foi tamb´em desenvolvido. Os resultados desta t´ecnica mostram que, em alguns casos, ´e poss´ıvel obter bons resultados em simula¸co˜es parametriz´aveis com cen´arios dinˆamicos usando na mesma os m´etodos cl´assicos de optimiza¸ca˜o.
Acknowledgements I read somewhere else, that nothing brings more joy than writing the acknowledgment section of any dissertation. It is indeed true. I would like to thank my supervisor, Prof. Lu´ıs Paulo Reis, for helping me set my goals, reviewing what I wrote numerous times and helping me bring this thesis to an end. I also would like to thank Prof. Eug´enio Oliveira, for taking the time to discuss with me the main ideas of this thesis and also for showing new directions I could take in my research. I also would like to thank my friends S´ergio Carvalho and Nuno Lopes for their support during the entire process. Nuno, for the lengthy phone conversations, in the late night hours, that helped me in the critical initial phase, when everything was still a little blurry. S´ergio, for being a great think-wall, reviewing some of my initial writings and for having the patience to listen to my ramblings over and over again. Of course I must not forget to also thank all the people that I failed to mention in these few short paragraphs, specially those that kept asking when it be would finally be ready and kept me going all this time. And finally, I cannot end without thanking Life, The Universe and Everything.
v
Contents Abstract
iii
Abstract
iv
Acknowledgements
v
1 Introduction
1
1.1 Objectives . . . . . . . . . . . . . . . . . . . . . . . . . . . . . . . . .
2
1.2 Proposal . . . . . . . . . . . . . . . . . . . . . . . . . . . . . . . . . .
4
1.3 Thesis Structure . . . . . . . . . . . . . . . . . . . . . . . . . . . . . .
5
2 Simulation Optimization
6
2.1 Parameter Optimization . . . . . . . . . . . . . . . . . . . . . . . . .
6
2.2 Discrete Variables Optimization Algorithms . . . . . . . . . . . . . .
8
2.2.1
Hill Climbing . . . . . . . . . . . . . . . . . . . . . . . . . . .
9
2.2.2
Simulated Annealing . . . . . . . . . . . . . . . . . . . . . . . 10
2.2.3
Tabu Search . . . . . . . . . . . . . . . . . . . . . . . . . . . . 12
2.2.4
Evolutionary Computation . . . . . . . . . . . . . . . . . . . . 12
2.2.5
Nested Partitions . . . . . . . . . . . . . . . . . . . . . . . . . 15
2.3 Continuous Variables Scenarios . . . . . . . . . . . . . . . . . . . . . 17 2.3.1
Gradient Based Search Methods . . . . . . . . . . . . . . . . . 17
2.3.2
Response Surface Methods . . . . . . . . . . . . . . . . . . . . 18
2.3.3
Stochastic Approximation Methods . . . . . . . . . . . . . . . 19
2.4 Multiple Response Simulations . . . . . . . . . . . . . . . . . . . . . . 19 2.5 Non-Parametric Scenarios . . . . . . . . . . . . . . . . . . . . . . . . 20 vi
Contents
vii
2.6 Conclusions . . . . . . . . . . . . . . . . . . . . . . . . . . . . . . . . 20 3 Clustering
22
3.1 Clustering Methodology . . . . . . . . . . . . . . . . . . . . . . . . . 23 3.2 Patterns and Features . . . . . . . . . . . . . . . . . . . . . . . . . . 23 3.3 Clustering Techniques Classification . . . . . . . . . . . . . . . . . . . 24 3.4 Cluster Distance Heuristics . . . . . . . . . . . . . . . . . . . . . . . . 25 3.5 Initial Clustering Centers . . . . . . . . . . . . . . . . . . . . . . . . . 27 3.6 Clustering Methods . . . . . . . . . . . . . . . . . . . . . . . . . . . . 27 3.6.1
K-Means . . . . . . . . . . . . . . . . . . . . . . . . . . . . . . 27
3.6.2
C-Means Fuzzy . . . . . . . . . . . . . . . . . . . . . . . . . . 28
3.6.3
Deterministic Annealing . . . . . . . . . . . . . . . . . . . . . 29
3.6.4
Clique Graphs . . . . . . . . . . . . . . . . . . . . . . . . . . . 30
3.6.5
Hierarchical Clustering . . . . . . . . . . . . . . . . . . . . . . 31
3.6.6
Local Search . . . . . . . . . . . . . . . . . . . . . . . . . . . . 32
3.6.7
Dynamic Local Search . . . . . . . . . . . . . . . . . . . . . . 33
3.7 Conclusions . . . . . . . . . . . . . . . . . . . . . . . . . . . . . . . . 33 4 Project and Implementation
35
4.1 Architecture . . . . . . . . . . . . . . . . . . . . . . . . . . . . . . . . 36 4.2 Technology . . . . . . . . . . . . . . . . . . . . . . . . . . . . . . . . 38 4.3 Modules . . . . . . . . . . . . . . . . . . . . . . . . . . . . . . . . . . 38 4.3.1
Simulation Runners . . . . . . . . . . . . . . . . . . . . . . . . 38
4.3.2
Evaluator . . . . . . . . . . . . . . . . . . . . . . . . . . . . . 41
4.3.3
Optimizer . . . . . . . . . . . . . . . . . . . . . . . . . . . . . 43
4.3.4
4.3.3.1
Hill Climbing Optimizer Implementation . . . . . . . 46
4.3.3.2
Simulated Annealing Optimizer Implementation . . . 46
4.3.3.3
Genetic Algorithm Optimizer Implementation . . . . 47
Aggregator . . . . . . . . . . . . . . . . . . . . . . . . . . . . 49 4.3.4.1
Solution Aggregation . . . . . . . . . . . . . . . . . . 52
4.3.4.2
Scenario Aggregation . . . . . . . . . . . . . . . . . . 54
4.3.4.3
Aggregation Implementation . . . . . . . . . . . . . . 55
Contents
viii
4.4 Scenario Adaptation . . . . . . . . . . . . . . . . . . . . . . . . . . . 56 4.4.1
Nearest Scenario Approach . . . . . . . . . . . . . . . . . . . . 57
4.4.2
Nearest Aggregate Approach . . . . . . . . . . . . . . . . . . . 59
4.5 Conclusions . . . . . . . . . . . . . . . . . . . . . . . . . . . . . . . . 60 5 Traffic Lights Simulator
62
5.1 Traffic Simulation Scenario . . . . . . . . . . . . . . . . . . . . . . . . 62 5.1.1
Intelligent Driver Model . . . . . . . . . . . . . . . . . . . . . 64
5.1.2
Traffic Generation . . . . . . . . . . . . . . . . . . . . . . . . . 66
5.1.3
Traffic Lights . . . . . . . . . . . . . . . . . . . . . . . . . . . 67
5.1.4
Simulation . . . . . . . . . . . . . . . . . . . . . . . . . . . . . 68
5.1.5
Parameters . . . . . . . . . . . . . . . . . . . . . . . . . . . . 69
5.1.6
Graphical Interface . . . . . . . . . . . . . . . . . . . . . . . . 72
5.2 Other Possible Scenarios . . . . . . . . . . . . . . . . . . . . . . . . . 72 5.3 Conclusions . . . . . . . . . . . . . . . . . . . . . . . . . . . . . . . . 73 6 Results and Analysis
75
6.1 Optimization . . . . . . . . . . . . . . . . . . . . . . . . . . . . . . . 75 6.1.1
Optimization Methods . . . . . . . . . . . . . . . . . . . . . . 76
6.1.2
Optimization Results . . . . . . . . . . . . . . . . . . . . . . . 78
6.1.3
Comparison of Methods . . . . . . . . . . . . . . . . . . . . . 79
6.2 Aggregation . . . . . . . . . . . . . . . . . . . . . . . . . . . . . . . . 81 6.3 Adaptive Simulations . . . . . . . . . . . . . . . . . . . . . . . . . . . 82 6.4 Conclusions . . . . . . . . . . . . . . . . . . . . . . . . . . . . . . . . 87 7 Conclusions and Future Work
88
7.1 Summary . . . . . . . . . . . . . . . . . . . . . . . . . . . . . . . . . 88 7.2 Future Work . . . . . . . . . . . . . . . . . . . . . . . . . . . . . . . . 89 7.3 Conclusions . . . . . . . . . . . . . . . . . . . . . . . . . . . . . . . . 91 A Scenario Optimization Results
100
B Scenario Aggregation Results
104
Contents C Code Listings
ix 105
C.1 Hill Climber Optimizer . . . . . . . . . . . . . . . . . . . . . . . . . . 105 C.2 Simulated Annealing Optimizer . . . . . . . . . . . . . . . . . . . . . 107 C.3 Genetic Algorithm Optimizer . . . . . . . . . . . . . . . . . . . . . . 109 C.4 K-Means Algorithm . . . . . . . . . . . . . . . . . . . . . . . . . . . . 114
List of Figures 2.1 A Simulation with its intervening variables . . . . . . . . . . . . . . .
7
2.2 Mutation and Recombination Operators . . . . . . . . . . . . . . . . 13 2.3 Nested Partition Example . . . . . . . . . . . . . . . . . . . . . . . . 16 2.4 Objective Utility Functions . . . . . . . . . . . . . . . . . . . . . . . . 20 3.1 Hierarchical Clustering . . . . . . . . . . . . . . . . . . . . . . . . . . 32 4.1 Master-Slave Architecture . . . . . . . . . . . . . . . . . . . . . . . . 37 4.2 System Modules Interaction . . . . . . . . . . . . . . . . . . . . . . . 38 4.3 Simulation Communication . . . . . . . . . . . . . . . . . . . . . . . . 40 4.4 Evaluator Sample Communication . . . . . . . . . . . . . . . . . . . . 42 4.5 Optimizer Project Classes . . . . . . . . . . . . . . . . . . . . . . . . 45 4.6 Optimizer Classes . . . . . . . . . . . . . . . . . . . . . . . . . . . . . 45 4.7 Scattered Simulation Results . . . . . . . . . . . . . . . . . . . . . . . 52 4.8 Clustered Simulation Results . . . . . . . . . . . . . . . . . . . . . . . 53 4.9 Parameter and Scenario relations . . . . . . . . . . . . . . . . . . . . 54 4.10 Aggregating Scenarios . . . . . . . . . . . . . . . . . . . . . . . . . . 54 4.11 Scenario Adaptation . . . . . . . . . . . . . . . . . . . . . . . . . . . 58 5.1 Traffic Lights Schedule Example . . . . . . . . . . . . . . . . . . . . . 67 5.2 Traffic Light Coordinates . . . . . . . . . . . . . . . . . . . . . . . . . 70 5.3 Traffic Simulator Interface . . . . . . . . . . . . . . . . . . . . . . . . 72 6.1 Solution Neighbourhood Structure . . . . . . . . . . . . . . . . . . . . 77 6.2 Low Traffic Optimization Results . . . . . . . . . . . . . . . . . . . . 79 6.3 Migration Traffic Optimization Results . . . . . . . . . . . . . . . . . 80 x
List of Figures
xi
6.4 High Traffic Optimization Results . . . . . . . . . . . . . . . . . . . . 80 6.5 Complete Scenario Set Results . . . . . . . . . . . . . . . . . . . . . . 84 6.6 Clustered Scenario Set Results . . . . . . . . . . . . . . . . . . . . . . 84 6.7 Single Scenario Set Results . . . . . . . . . . . . . . . . . . . . . . . . 85 7.1 Single Variable Graphical Analysis Mock-up . . . . . . . . . . . . . . 91 7.2 Multi Variable Graphical Analysis Mock-up . . . . . . . . . . . . . . 92
List of Tables 6.1 Comparison of Different Optimization Methods . . . . . . . . . . . . 81 6.2 Adaptive Simulation Results . . . . . . . . . . . . . . . . . . . . . . . 83 A.1 Scenario Optimization Results . . . . . . . . . . . . . . . . . . . . . . 100 B.1 Scenario Aggregation Results . . . . . . . . . . . . . . . . . . . . . . 104
xii
List of Algorithms 1
Random Search basic form . . . . . . . . . . . . . . . . . . . . . . . .
9
2
Standard Hill Climbing Algorithm . . . . . . . . . . . . . . . . . . . .
9
3
Standard Evolutionary Algorithm . . . . . . . . . . . . . . . . . . . . 14
4
C-Means Fuzzy Clustering Algorithm . . . . . . . . . . . . . . . . . . 29
5
Corrupted Clique Graph Clustering Algorithm . . . . . . . . . . . . . 31
6
Hill Climber Optimizer Algorithm . . . . . . . . . . . . . . . . . . . . 47
7
Simulated Annealing Optimizer Algorithm . . . . . . . . . . . . . . . 48
8
Genetic Algorithm Optimizer Algorithm . . . . . . . . . . . . . . . . 50
9
K-Means Clustering Algorithm
10
Traffic Simulation . . . . . . . . . . . . . . . . . . . . . . . . . . . . . 68
. . . . . . . . . . . . . . . . . . . . . 57
xiii
Listings C.1 Hill Climbing Optimizer (start) . . . . . . . . . . . . . . . . . . . . . 105 C.2 Hill Climbing (iteration) . . . . . . . . . . . . . . . . . . . . . . . . . 105 C.3 Simulated Annealing (start) . . . . . . . . . . . . . . . . . . . . . . . 107 C.4 Simulated Annealing (iteration) . . . . . . . . . . . . . . . . . . . . . 107 C.5 Genetic Algorithm (start) . . . . . . . . . . . . . . . . . . . . . . . . 109 C.6 Genetic Algorithm (iteration) . . . . . . . . . . . . . . . . . . . . . . 110 C.7 Genetic Algorithm (generator) . . . . . . . . . . . . . . . . . . . . . . 111 C.8 K-Means Clustering Algorithm
. . . . . . . . . . . . . . . . . . . . . 114
xiv
Chapter 1 Introduction Many systems, in areas such as manufacturing, financial management and traffic control, are just too complex to be modeled analytically, but there is still a need to analyze their behaviour and optimize their performance. Discrete event simulations have long been used to test the performance of such systems in a variety of conditions. The use of simulations is normally related to the need of understanding how a certain system behaves under a definite set of environment variables and also to know how it can be changed in order to improve its performance. Simulations are sometimes controlled by what can be called agents. These agents can have several levels of intelligence, ranging from simple agents to intelligent autonomous agents that can learn from their errors or even from one another. Improving a simulation can mean either making it more similar to the reality it is modelling, changing the configuration of the simulation in order to get better results or improving the behaviour of these same agents. This dissertation will focus mainly in this last problem. Agents controlling a simulation can be optimized by changing their algorithms, making them more intelligent, however this is not always easy or even possible. However, Agents have normally a set of parameters that can be fine tuned in order to get better results from the simulation. 1
1.1. Objectives
2
Simulations are important tools for studying how a system will react to parameter changes, but often, testing every single parameter combination, to evaluate which is the most suited set of values, is not affordable. To help solve this problem a great number of simulation optimization methods have been developed. These methods can be used to find the optimum parameters for a given simulation. Simulation Optimization is a field where a great deal of work has been made but that is still very active. Several optimization algorithms have been developed and studied over the years such as: Stochastic Approximation, Simulated Annealing and Tabu Search. However, most of the times, these algorithms will only optimize a simulation for a certain static scenario. If the scenario being analyzed by the simulation changes, the optimum parameters will probably also change. Simulation scenarios are often also defined by a set of parameters. In cases where this does not happen, parameters describing the scenario can sometimes be extracted. In this way, a simulation normally has two sets of parameters that will influence its outcome: environment, or scenario, parameters that normally can’t be controlled and system, or agent, parameters that can be changed in order to get better results. In cases where environment parameters exist, the optimization of a simulation will be even more complicated as it is necessary to optimize the system parameters for each possible scenario.
1.1
Objectives
The main objective behind this dissertation is to study how well known Simulation Optimization algorithms can be used in order to optimize simulations running in dynamic scenarios or that can be used with several different static scenarios. The motivation behind this objective resulted from the observation of several different simulations with these same characteristics that needed to be optimized and the lack of tools for the task.
1.1. Objectives
3
Several other secondary objectives will be addressed:
• Generic System - Even if most optimization algorithms are generic enough to be used with almost any simulation, a great deal of work, adapting and implementing the algorithm, still has to be done when we want to optimize a particular simulation. With a generic optimization system that required little effort to adapt to any simulation, a lot of this effort could be shifted to more important issues. • Extendability - Each simulation has its own unique features that might require different algorithms. The choice of the correct algorithm is not always obvious and can force the developer to test several of them before finding a suitable one. Each time a different algorithm is tested, it has to be adapted in order for it to work with the simulation being developed, hence more precious time is wasted. An optimization system with several optimization algorithms included and the possibility of adding new ones will allow the user to easily experiment which algorithm is more suited to the problem in hand. • Optimization Process Analysis - Ironically most optimization algorithms also have a set of parameters that must be tweaked in order to get an optimal performance out of them. So tools that allow us to analyze the optimizer are often required. Developing these tools each time we study a new type of simulation is time consuming. The solution will be to create a set of generic tools that allow the optimization of any simulation with only a few changes in the simulation code. These should allow the user to monitor, tune and aid the optimization process. • Distributed Optimization - Other main concern about using simulation optimizers is that each simulation run usually takes from a few seconds to minutes, hours or even days. All the optimization algorithms depend on running the simulation with several different combinations of scenarios and system parameters. This may cause the use of optimization algorithms impracticable in some situations. The common solution for this problem is to run the sim-
1.2. Proposal
4
ulations in more than one computational unit thus distributing the load and shortening the time of the optimizing process.
1.2
Proposal
This dissertation proposes the creation of a generic optimization system that will address the points just mentioned:
• The system should be able to use different algorithms and the addition of new algorithms should be easily accomplished; • It should be easy to adapt any simulation in order to use the system; • The system should be able to run simulations in more than one computational unit, at the same time, saving computational costs; • The user should have access to the optimization process as it runs and adjust any parameter in order to improve the system performance; • The output of the system should take in consideration that there might not be an optimal global set of parameters for the simulation but several sets of parameters optimal for different scenarios.
One way of implementing the last of these points is to optimize the simulation against several different scenarios and then use the optimum parameters found for the scenario that most resembles the current one. As will be explained in the subsequent chapters this solution has several drawbacks. One of these drawbacks is the overhead caused by the constant changing of parameters. The solution proposed in this dissertation is to use clustering algorithms to minimize the number of different parameter sets, thus minimizing the number of times parameters need to be changed.
1.3. Thesis Structure
1.3
5
Thesis Structure
This dissertation will be structured into the following chapters:
• Chapters 2 and 3 will evaluate the current state of optimization and clustering algorithms. • Chapter 4 will present the structure of a generic simulation optimization system and its implementation will be addressed. • Chapter 5 will present the test case scenario. • Chapter 6 will present and analyze the results. • Chapter 7 will contain a brief summary of the dissertation, the final conclusions and also some references to possible evolutions and future work.
Chapter 2 Simulation Optimization A great amount of research has been done in the areas of Parameter Optimization and of Simulation Optimization. In this section the current state of the art of these two subjects will be presented with the following issues being discussed: what is a simulation optimization problem; challenges posed by this kind of problems; different kinds of parameter optimization scenarios; specific problems that each of these scenarios pose and several ways of tackling them.
2.1
Parameter Optimization
An optimization problem normally consists on trying to find the values of a vector → − x = (x1 , . . . , xnx ) ∈ M , of free parameters of a system, such that a criterion f : M → < (the objective function) is maximized (or in some cases minimized): f (~x) → max. Most of the times there also exists a vector ~y = (y1 , . . . , yny ) ∈ N , a set of stochastic parameters, that also influence the objective function. This second set of parameters defines different scenarios the simulation can run in. These parameters are not in our control but they still can be monitored and simulations can adapt to its changes. Often these free parameters are subject to a set of constraints m ~ = M1 × . . . × Mnm 6
2.1. Parameter Optimization
7
by functions gj : M1 × . . . × Mnm . A more complete mathematical definition of an optimization problem can be found at [B¨ack 96]. A Parameter Optimization Problem can be defined as having:
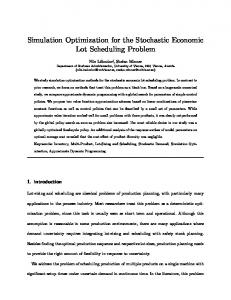
~ whose values will influence the result of the • A set of decision variables (x) objective function. • A set of constraints on the decision variables (gj ). • A set of environment (~y) variables that can not be controlled but influence the result of the simulation. • An objective function (f (~x, ~y))that needs to be maximized or minimized. The objective function is often a weighted sum of the set of results from the simulation (see Section 2.4 for Multiple Response Simulations).
In Figure 2.1 it can be seen how decision and environment variables interact in a simulation.
Figure 2.1: A Simulation with its intervening variables
Simulation Optimization procedures are used when our objective function can only be evaluated by using computer simulations. This happens because there is not an analytical expression for our objective function, ruling out the possibility of using differentiation methods or even exact calculation of local gradients. Normally these functions are also stochastic in nature, causing even more difficulties to the task
2.2. Discrete Variables Optimization Algorithms
8
of finding the optimum parameters, as even calculating local gradient estimates becomes complicated. Running a simulation is always computationally more expensive than evaluating analytical functions thus the performance of optimization algorithms is crucial. In the following sections, some of the algorithms that have been developed over the years, to solve simulation optimization problems, will be analyzed.
2.2
Discrete Variables Optimization Algorithms
The most simple scenarios in parameter optimization problems happen when decision variables are discrete in nature. In these scenarios, and when the subset of possible values for the decision variables is small, one could test every set of values in order to find the optimum solution for the problem. This would be easily accomplished if the simulation was deterministic. However, as noticed by [Olafsson 02], in the stochastic world, further analysis would have to be done in order to better compare each possible solution. [Goldsman 94, Goldsman 98] described several methods to perform this analysis in order to increase the confidence in selecting the optimum result. The cases that will be analyzed in detail are those where it is infeasible to test every possible solution. The algorithms used in these kind of scenarios are usually called Random Search algorithms (or Meta-Heuristics). [Olafsson 02] noticed that Random Search algorithms usually follow the structure depicted in Algorithm 1. Random Search algorithms are variations of this algorithm with different neighbourhood structures, different methods of selecting new candidate solutions and different acceptance and stopping criteria. In discrete decision variable optimization problems, the neighbouring solutions to a particular set of decision values can be calculated easily, making Random Search
2.2. Discrete Variables Optimization Algorithms
9
Algorithm 1 Random Search basic form 1. Select an initial solution and test its performance 2. Select a candidate solution from the neighborhood of that solution and test its performance 3. If the performance of the new solution is better than that of the current solution then set the current solution as being the new solution 4. If stopping criterion is met stop else go back to step 2
methods ideal for these kind of scenarios. In the following sections, different Random Search algorithms, that can be found in optimization literature, will be described.
2.2.1
Hill Climbing
Hill Climbing (HC), in its basic form, is the simpler of the optimization methods for discrete variable optimization problems. The method starts with an initial random solution and searches amongst its neighbours for better ones. If a better solution is found the algorithm resumes its search from that new solution. The algorithm stops when it cannot find a better solution close to the current one. A description of a standard HC algorithm can be found in Algorithm 2. Algorithm 2 Standard Hill Climbing Algorithm 1. Generate an initial solution, randomly or by means of an heuristic function 2. Loop until a stop criterion is met or there are no untested neighbour solutions: (a) Test a neighbour solution to the current that hasn’t yet been tested (b) If the new solution is better than the current solution make it the current solution 3. Return the current solution
HC has some well-known limitations as stated by [Russell 02]: • Local Maximum - A local maximum is a peak that is higher than its neigh-
2.2. Discrete Variables Optimization Algorithms
10
bours solutions but is not the highest value of the function. The HC algorithm will stop at these points. • Plateau - A plateau is an area where the objective function is essentially flat. HC will search erratically in these kind of areas. • Ridges - A ridge is an area with a point, where even without it being a local maximum, all available moves will make the solution worse. Ridges depend on the method chosen to calculate neighbour solutions.
A solution to the Local Maximum problem is to restart the HC process when it stops from a random location. This method, called Random Start Hill Climbing (RSHC), works well when there are only a few local maximums but in more realistic problems it will take an exponential amount of time to find the best solution to the problem ( [Russell 02]). A variation of the Hill Climbing method is the Steepest Ascent Hill Climbing (SAHC) algorithm ( [Rich 90]). The difference between these two methods is that the first tests all current solution neighbours in order to find the best solution amongst them, while the SAHC algorithm changes its current best solution as soon as a better one is found. SAHC normally converges quicker than HC but still does not guarantee the best solution is found. Some other methods, loosely based on HC, have been later proposed by other authors. In the following sections some of these methods will be analyzed.
2.2.2
Simulated Annealing
Originally described by [Kirkpatrick 83] Simulated Annealing (SA) tries to emulate the way in which a metal cools and freezes into a minimum energy crystalline structure (the annealing process) and compares this process to the search for a minimum in a more general system.
2.2. Discrete Variables Optimization Algorithms
11
At that time, it was well known in the field of metallurgy that slowly cooling a material (annealing) could relieve stresses and aid in the formation of a perfect crystal lattice ( [Fleischer 95]). [Kirkpatrick 83] realized the analogy between energy state values and objective function values, creating an algorithm that emulated that process. The SA algorithm tries to solve the Local Maximum problem described in 2.2.1. It does so by allowing the search to sometimes accept worst solutions with a probability (p), that would diminish with the temperature of the system (t). In this way, the probability of accepting a solution that resulted in a certain increase in the objective function (∆f ), at a certain temperature, would be given by the following formula described in the original paper by [Kirkpatrick 83]:
e −∆f t p(∆f, t) = 1
∆f ≤ 0
(2.1)
∆f > 0
Observing the formula, it is clear that downhill transitions are possible, with the probability of them occurring decreasing with the height of the hill and inversely related to the temperature of the system. In order to implement the SA algorithm, the initial temperature of the system, and how that temperature is going to be lowered, still has to be decided. The slower the temperature is decreased, the greater the chance an optimal solution is found. In fact [Aarts 89] showed that running the simulation an infinite number of times is needed to be sure the optimal solution to the problem has been found. Most times a reasonably good cooling schedule can be achieved by using an initial temperature (T0 ), a constant temperature decrement (α) and a fixed number of iterations at each temperature. These kind of cooling schedules are called fixed schedules. The problem with these schedules is that it is often impractical to calculate the ideal values for T0 and α. Another approach is to use a scheduling that can automatically adapt to the problem at hand. These are called self-adaptive
2.2. Discrete Variables Optimization Algorithms
12
schedules and were first presented by [Huang 86].
2.2.3
Tabu Search
Tabu Search (TS) is another optimization method created to solve the local maximum problems revealed by the Hill Climbing algorithm. The main idea behind the TS algorithm is to use the search history in order to impose restrictions, and additions, on the neighbourhood of the solution currently being analyzed. There are two main ways of taking advantage of the search history in order to improve the choice of the next solutions to be explored: recency memory and frequency memory ( [Glover 93]). Recency memory is a short term memory where recent solutions or recent moves between solutions are labeled as being tabu-active. The TS algorithm avoids going through those same solutions, or backtracking those moves, in order to better explore the space of feasible solutions. Frequency memory is a longer term strategy that discourages moves to solutions whose components have been frequently visited or encourages moves to solutions whose components have rarely been evaluated. Another form of longer term strategy is achieved by recording which components appear most in elite solutions and encouraging moves towards solutions containing those components. Shorter and longer term strategies can be used at the same time and often yield good results. [Glover 93] has written a very comprehensive explanation on the uses of Tabu Search.
2.2.4
Evolutionary Computation
Not uncommonly, computer scientists grab their ideas from biological phenomena. Evolutionary Computation (EC) is just one of many examples of the benefits of this
2.2. Discrete Variables Optimization Algorithms
13
Figure 2.2: Mutation and Recombination Operators interdisciplinary cooperation. As seen in the last sections, the SA and TS algorithms are variations of the HC algorithm where the notion of neighbourhood has been slightly distorted in order to escape from local maximums. EC has a somewhat different approach as its methods deal with populations of solutions, instead of a single current solution from where moves to better (or sometimes worse) solutions can be made. It is loosely based in the biological mechanism of evolution, where the fittest organisms have a greater probability of generating offspring making each new generation better than the previous one. Three major methods have been established in literature: Genetic Algorithms (GA), Evolution Strategies (ES) and Evolutionary Programming (EP). These three methods follow, nevertheless, the same basic strategy: A population of solutions, each one of them having a certain fitness (calculated by evaluating the objective function for each solution), to whom a series of probabilistic operators, like mutations, selections and recombinations, are applied (see Figure 2.2). The mutation operator is used to introduce innovation in the current population allowing the algorithms to explore areas of the search space that are not being explored at the moment. The selection operators are those that make the method
2.2. Discrete Variables Optimization Algorithms
14
reach better results with each new generation, selecting the solutions with an higher fitness value over the ones with a lower one. The recombination operator allows some information exchange between current solutions by introducing a new solution into the population from the merge of two previous selected solutions . The beauty of the algorithm lies in the fact that, although it is extremely simple, it has been used by mother nature, with remarkable success, for millions of years. Algorithm 3 is a simple outline of what a standard Evolutionary Computation algorithm looks like ( [Holland 75, Pierreval 00]). Algorithm 3 Standard Evolutionary Algorithm 1. Start with the generation counter equal to zero. 2. Initialize a population of individuals (either randomly or by means of an heuristic function). 3. Evaluate fitness of all initial individuals in population. 4. Increase the generation counter. 5. Select a subset of the population for children reproduction (selection). 6. Recombine selected parents (recombination). 7. Perturb the mated population stochastically (mutation). 8. Evaluate the mated population’s fitness (evaluation). 9. Test for termination criterion (number of generations, fitness, etc.) and stop or go to step 4.
As has already been stated, the three different approaches to evolutionary computing share the same basic structure. The main differences between them lie in their objectives, the way their population is coded and the way they use the different evolutionary operators. EP has been initially developed having in mind machine intelligence. Its main particular characteristic is the fact that solutions are represented in a form that is tailored to each problem domain. EP tries to mimic evolution at the level of reproductive populations of species, and recombinations do not occur at this level, so EP algorithms seldom use it.
2.2. Discrete Variables Optimization Algorithms
15
On the other hand GAs use a more domain independent representation (normally bit strings). The main problem with GA is how to code each solution into meaningful bit strings. Its advantages are that mutation and recombination operators are easily implemented as bit flips (mutations) and string cuts followed by concatenations (recombination). The main difference between ES and the other two methods just discussed are the fact that selection in ES is deterministic (the worst N solutions are discarded) and that ES uses recombination as opposed to EP. A more complete description about the differences between these three methods and their uses can be found at [Spears 93, Fogel 95].
2.2.5
Nested Partitions
The Nested Partitions method is a relatively recent (when compared to other) method for parameter optimization first proposed by [Shi 97, Shi 00]. The basic idea behind this particular method is the continuous partitioning of the solution space into smaller, and more promising, regions until a stopping criterion is met. The algorithm runs in 4 simple steps: partitioning, sampling, promising index calculation and backtracking. The starting step is the creation of an initial, most promising, region (normally the complete solution space Θ). This region is then partitioned into M subregions (σ1 , . . . , σM ) using some previously chosen partitioning method. The method then proceeds by randomly sampling each one of the M subregions and then calculating the promising index of these subregions as, for instance, the best performance value from the samples taken of each subregion. The subregion with the best performance index becomes our most promising subregion and is partitioned even further. In the following steps each of the new subregions and also the surrounding of our most promising region is taken into account, thus calculating the promising index for M+1 regions. If the subregion with the most promising index is one of the subregions of our most promising region, the method
2.2. Discrete Variables Optimization Algorithms
16
then continues partitioning even further, but if it is the surrounding region that is selected, it backtracks to the region which is the parent to the current most promising region. Figure 2.3 contains an example of how the algorithm works. In the first step the solution space was partitioned in four subregions. Sub region σ2 was selected as the most promising, after sampling and calculating the promising index of each one of them. The the algorithm proceeded by partitioning region σ2 and evaluating its subregions and also the surrounding region Θ \ σ2 = {σ1 , σ3 , σ4 }. This time subregion σ2.3 was selected as the most promising region. In the next step the promising indexes of our four subregions, plus the surrounding region Θ \ σ2.3 , was calculated. As the surrounding region was found to be the most promising, the algorithm backtracked to the parent of subregion σ2.3 which is region σ2 .
Figure 2.3: Nested Partition Example A notable feature of the NP method is that it combines global and local search in a natural way. It is also highly suitable for parallel computer structures ( [Shi 97]).
2.3. Continuous Variables Scenarios
2.3
17
Continuous Variables Scenarios
Optimization of simulation parameters brings some new challenges when those same parameters are continuous instead of being discrete. In these cases the feasible solutions space becomes infinite. Methods for solving optimization problems with continuous input parameters can be classified as either gradient-based or non-gradientbased ( [Swisher 00]). Gradient based methods are the most used ones and three subclasses of these kind of methods can be identified: Gradient Based Search Methods (GBSM), Response Surface Methods (RSM) and Stochastic Approximation Methods (SAM).
2.3.1
Gradient Based Search Methods
GBSMs work by estimating the objective function gradient (5f ) to determine the shape of the function and then employing deterministic mathematical techniques in order to find the maximum of that same function( [Carson 97]). Several different methods of estimating the gradient have been developed like: Finite Differences, Likelihood Ratios, Infinitesimal Perturbation Analysis and Frequency Domain Method. The Finite Differences Method (FD), labeled by [Azadivar 92] as the crudest of all gradient estimation methods, works by calculating partial derivatives for each of the − free parameters (→ x = (x , . . . , x ) ∈ M ): 1
n
f (x1 , . . . , xi + ∆i , . . . , xn ) − f (x1 , . . . , xi , . . . , xn ) δf = δxi ∆i
(2.2)
For a simulation with n free parameters at least n+1 runs of the simulation are needed, and if the simulation response happens to be stochastic in nature then several more runs are needed to obtain a more reliable value for each derivative making this method very inefficient.
2.3. Continuous Variables Scenarios
18
The Likelihood Ratio Estimation Method (LR) described in [Glynn 90] is a much more efficient method of estimating gradients in stochastic scenarios. However, the LR is not appropriate for every simulation and is not suitable for a generic optimization system. The Infinitesimal Perturbation Analysis (IPA) method of calculating gradient estimates, yields a much more interesting approach for a generic optimization system. The IPA assumes that an infinitesimal perturbation, in an input variable, does not affect the sequence of events but only makes their occurrence times slide smoothly ( [Carson 97]). If this statement holds, then the objective function gradient could be estimated from a single simulation run. However gradients calculated with this method are usually biased and inconsistent. Frequency Domain Analysis (FDA) is based in the following idea: if an output variable is sensitive to one of the input variables and if that same input variable is oscillated sinusoidally, at different frequencies, over a long simulation run, the output variable should show corresponding oscillations in the response. Those same oscillations can then be analysed using Fourier transforms in order to understand how each input variable influences the output variable of the simulation.
2.3.2
Response Surface Methods
Response Surface Methods (RSM) have the great advantage of requiring fewer simulations runs than the other methods described. They work by trying to fit regression models to the objective function of the simulation model. They start by trying to fit a first order regression model into the simulation results and searching that model using a Steepest Ascent approach. When it gets nearer to the solution, a higher order regression model is then used. Although RSMs require few simulations runs, experiments have shown that for more complex functions the results provided are not very good ( [Azadivar 92]). The usage of regression models in simulation optimization have been described in [Biles 74].
2.4. Multiple Response Simulations
2.3.3
19
Stochastic Approximation Methods
Stochastic Approximation Methods (SAM) are recursive procedures that approach the maximum of a function also using regression functions. The relevant characteristic of this method over RSM is that SAM also work with noisy observations [Azadivar 92]. The greatest problem is that a large number of iterations is required before reaching the optimum value. For multi-dimensional decision variables, n+1 observations must be done in each iteration.
2.4
Multiple Response Simulations
Simulation models that output more than one result in each simulation run have their own difficulties. With these kind of simulations there is no longer a single objective function that as to be optimized, but several ones. One simple approach to solve this problem is to consider one of the objective as the function to be optimized subject to certain levels of achievement by the other secondary objective functions [Azadivar 92]. Other obvious solution is to define a weight for each one of the objective functions thus defining a new objective function:
f (~x) =
n P
wi fi (~x)
(2.3)
i=1 This solution, although effective at first glance, is in fact typically a poor solution. Normally each one of the objective functions has a different utility function. By just using the weighted sum of the objective functions, we are considering that these utility functions are linear and have the same zero value but, in fact, the normal case is the one depicted on the right part of Figure 2.4.
2.5. Non-Parametric Scenarios
20
Figure 2.4: Objective Utility Functions
2.5
Non-Parametric Scenarios
There is also a completely different class of optimization problems. Non-parametric simulations are those where the mathematical models we have seen in Section 2.1 cannot be applied. Examples of these problems are scheduling policies, layout problems and part routing policies [Azadivar 92]. As the decision variables in these problems are not quantitative, classical optimization algorithms like Hill Climbing or Simulated Annealing cannot be used. To approach this class of problems new model generators and optimization methods had to be developed from scratch. As these problems do not lie in the scope of this thesis no deep analysis will be done about them.
2.6
Conclusions
When having a simulation optimization problem at hand, the first thing one has to do is to analyze the nature of that same problem. This means that decision variables, environmental variables and results must be characterized. The characterization of these variables will automatically narrow the scope of choices one has to make. In the event of it being a simple discrete variable optimization problem the choice of available algorithms will comprehend the classic Hill Climbing, Simulated Annealing, Tabu Search and several flavours of Evolutionary Computing algorithms, besides the
2.6. Conclusions
21
more recent Nested Partitions algorithms and also many more. The first three of these algorithms share the same structure having just a few variations. In fact, all of them imply the definition of solution neighbourhoods. One thing they all have in common is the need of evaluating the objective function for comparison purposes. This, as has been seen, brings new challenges when we have several objective functions. Although having been under heavy research for many years, the studied Simulation Optimization algorithms all fail in one single point. They all assume that the simulation environment is static when in fact it normally is not. The simulation environment is constantly changing and so, the parameters that control it also have to change. In Chapter 4 some of the optimization algorithms that were just described, as well as clustering methods like the ones that will be analyzed in Chapter 3, will be used in order to develop an optimization system that assumes simulation can be dynamic.
Chapter 3 Clustering Clustering can be defined as grouping sets of elements that are similar in some way. A simple way of achieving this objective is by obtaining maximum inter-cluster similarity and intra-cluster dissimilarity. Clustering methods have to deal with two different problems: membership (whether an element belongs to a certain cluster or not) and how many clusters to create. Most methods only deal with the first of these problems but some strategies have been developed to determine the number of clusters and cluster membership at the same time ( [Fraley 98]). To develop an optimization system as delineated in Chapter 1, solutions from an optimization problem must be grouped together, having in mind that different solutions apply to different initial conditions of the simulation. The objective is to find out which different kind of solutions exist and to which type of problems each one of them can be applied. In this section, different clustering algorithms will be explained. The situations in which each algorithm can be used, their advantages and drawbacks will also be analyzed.
22
3.1. Clustering Methodology
3.1
23
Clustering Methodology
Clustering is normally done in 5 separate steps ( [Jain 99]):
1. Pattern Representation - This refers to preparing the data for the clustering algorithm. Analyzing which data elements are relevant to the clustering process, their scales and types, and also transforming the data in order to emphasize more relevant features (e.g. transforming numbers into even and odd classes). 2. Definition of Pattern Proximity - Clustering is normally based in some kind of proximity function. This function can be simply the euclidean distance between each element or a somewhat more complex function. 3. Clustering - There are many methods for performing this step and those can be grouped, for example, as hard or fuzzy partitioning methods and hierarchical or partitioning methods. 4. Data Abstraction - How the data will be presented after the clustering step. 5. Assessment of Output - Validating the clustering process output.
A vast number of clustering algorithms exist due to the fact that each specific clustering problem has its own requirements and benefits. However, an all-solving clustering algorithm is something that does not exist [Jain 99].
3.2
Patterns and Features
~ are a common clustering term that refer to vectors of d measurements. Patterns (p) Patterns are the data items that a clustering algorithm will try to group. Each scalar component of a pattern is called a feature (pi ).
3.3. Clustering Techniques Classification
p~ = (p1 , . . . , pd )
24
(3.1)
Features can be divided into the following categories ( [Gowda 91]):
• Quantitative Features: continuous values, discrete values or interval values; • Qualitative Features: nominal (unordered) or ordered. To cluster the data retrieved from the optimization model described in Chapter 1, focus will be given mainly to clustering methods appropriated for continuous or discrete values.
3.3
Clustering Techniques Classification
As stated before clustering techniques can be classified from several different point of views. Classifying these algorithms can help in the choice of a suitable clustering algorithm. Following, we present a classification of clustering algorithms based on the one proposed by [Jain 99]:
• Agglomerative / Divisive - Agglomerative methods start with each pattern in its own cluster and work by merging clusters until a stopping criterion is met. Divisive methods start with a single cluster containing all patterns and work by dividing the initial cluster into smaller clusters, also until a stopping criterion is met. Agglomerative methods memory requirements are usually proportional to the square of the number of groups in the initial partition, normally the size of the data set [Fraley 98]. • Monothetic / Polythetic - Most clustering methods use all features at once when computing distances between patterns. These kind of methods are referred as polythetic methods. Monothetic methods considers features sequentially as they divide or agglomerate clusters.
3.4. Cluster Distance Heuristics
25
• Hard / Fuzzy - Clustering algorithms can have hard or fuzzy result sets. In hard result sets each pattern belongs to only one cluster while in fuzzy result sets each pattern is assigned a degree of membership to more than one cluster. • Incremental / Non-incremental - Incremental clustering algorithms allow the introduction of new patterns into the result set without forcing a complete rebuild of the pattern set. This is of extreme importance when the pattern set is large and dynamic. • Hierarchical / Partitioning - Hierarchical clustering algorithms can output a dendogram of nested clusters as a result, while partitioning algorithms output single-level partitions.
3.4
Cluster Distance Heuristics
Most of the clustering methods we will discuss use some heuristic form of determining the distance between clusters. In fact, the existing methods normally concentrate their efforts in determining the dissimilarity between clusters rather than their similarity. The most appropriate heuristic to be applied is something that depends strongly on the dataset, so a best than all method is something that does not exist. Besides that, a criteria to find which method is the best for a certain dataset is not known. The most used heuristic variations are the following ( [Fung 01]):
• Average linkage - In this method dissimilarity is calculated as the average distance between each element in a cluster and all elements of the other cluster. • Centroid linkage - The centroid of a cluster is defined as the center of a cloud of points. Dissimilarity is calculated as the the distance between cluster centroids.
3.4. Cluster Distance Heuristics
26
• Complete linkage - The distance between two clusters is determined by the distance between the most dissimilar elements of both clusters. This method is also referenced as the furthest-neighbour method. • Single linkage - This method is a variation of the previous one where the dissimilarity between two clusters is based on the two most similar elements instead of the two most dissimilar ones. • Ward’s method - A somewhat different method from the previous ones. Cluster membership is assigned by calculating the total sum of squared deviations from the mean of the cluster.
Another problem regarding distances is that the various features normally do not use the same scale. Normalization has to be performed in order to get meaningful distance values. [Luke 02] defined a method that ensures all features will have a mean value of 0.0 and a standard deviation of 1.0 over the entire range of patterns to be analyzed. His method can be easily explained using these four simple steps to be applied to each feature:
1. Sum the values of the feature over all patterns and divide the sum by the number of different patterns. 2. Subtract this average value from the feature in all patterns. 3. Sum the square of these new values over all patterns, divide the sum by the total number of patterns, and take its square-root. This is the standard deviation of the new values. 4. Divide the feature by the standard deviation in each pattern.
Only after applying this simple procedure will all patterns be ready for comparison and distance evaluation.
3.5. Initial Clustering Centers
3.5
27
Initial Clustering Centers
Some of the methods we are describing in the next section require a set of initial empty clusters and their respective centers. The choice of these initial centers is crucial to the quality of the obtained clusters, as noticed by [Fung 01]. The same author proposed some heuristic methods for choosing these initial parameters:
• Bins - Divide the space into bins and choose random initial clusters in each of those bins. • Centroid - Choose initial centers near to the dataset centroid. • Spread - Chose random centers across the entire dataset. • PCA - Project the dataset into the most important component as to form a one-dimensional dataset. Then perform a clustering algorithm and use the obtained clusters centers as the initial centers.
3.6
Clustering Methods
In the next sections several clustering methods described in the literature will be presented.
3.6.1
K-Means
The K-Means clustering algorithm was one of the first clustering algorithms ever described. Although very easy to implement, it has some drawbacks that will be discussed later in this Section. The algorithm starts with the creation of k clusters with initial centroids estimated using, for example, one of the algorithms explained in Section 3.5. Patterns are then assigned to the cluster with the nearest centroid (usually using simple euclidean
3.6. Clustering Methods
28
distance measurements). New cluster centroids are then calculated and the process repeats until convergence is met (i.e. no pattern changes cluster). The major drawbacks of this method are: the fact that the number of clusters must be predetermined; having a poor performance as distances to the cluster centroids must always be recalculated in each step; and its results being very dependent of the initial choice of cluster centroids. [Fayyad 98] showed that the dependency of the initial clusters choice could be easily surmounted by iteratively applying the K-Means algorithms to various subsamples of the initial set of patterns and observing which initial clusters fail to have any elements in it. Other problem with this method is that it favours circular clusters (as most clustering methods do), however clusters can have different forms like, for example, strips or ellipsoids.
3.6.2
C-Means Fuzzy
Fuzziness is a term often used in artificial intelligence literature that breaks the traditional approach of an object x having, or not having, a certain characteristic y. Instead of that, fuzzy methods state that the object x has the characteristic y to a certain degree z. This approach is able to represent reality in a much accurate form. When it comes to clustering, fuzziness means that patterns no longer belong undoubtedly to a single cluster but have a certain degree of membership to a number of different clusters. This creates the notion of fuzzy boundaries. The C-Means Fuzzy algorithm, first described by [Pal 95], works like depicted in Algorithm 4. The C-Means algorithm usually has a parameter q (a real number greater than 1) that refers to the amount of fuzziness applied to the cluster boundaries. The degree of membership to each cluster (uij ) is computed using the following formula:
3.6. Clustering Methods
29
Algorithm 4 C-Means Fuzzy Clustering Algorithm 1. Estimate K initial empty clusters with estimated centroids (using a method like those exposed in Section 3.5). 2. Calculate the degree of membership of every pattern to every cluster. 3. Recalculate cluster centroids. 4. Update the degree of membership (same as step 2). 5. Go to step 3 unless a stopping criterion is met (usually when the biggest change in membership is below a certain tolerance value).
1 d(pj ,Ci )
uij = P K
1 q−1
1 k=1 d(pj ,Ck )
1 q−1
(3.2)
Where the pj refers to pattern j, Ci refers to cluster i and d is a distance estimator as defined in Section 3.4. To update the cluster centroids we just have to take into account the degree of membership of each of the M patterns to each cluster:
PM
j=1 C˙ i = PM
(uij )q pj
q j=1 (uij )
(3.3)
The objective of the algorithm is to minimize the following cost function:
M X K X E(U, C) = (uij )q d(pj , Ci )
(3.4)
j=1 i=1
3.6.3
Deterministic Annealing
The deterministic approach to clustering, first introduced by [Rose 90], follows much of the principles of the SA algorithm described in Section 2.2.2. In this case the energy of the system, that we want to minimize, is given by the following expression (extremely similar to the cost function seen in equation 3.4):
3.6. Clustering Methods
30
E=
M X K X
(uij )d(pj , Ci )
(3.5)
j=1 i=1
In the original paper, the problem is formulated as a fuzzy clustering problem and the association probability distribution is obtained by maximizing the entropy at a given average variance .
3.6.4
Clique Graphs
The recent popularity of clustering in the domain of bio-informatics, as a tool for studying DNA micro-array data, has yield some interesting new results [Fasulo 99]. One of the most interesting results being a new clustering algorithm based on clique graphs, or, more precisely, on corrupted clique graphs. Clique graphs are graphs with every vertex connected to every other vertex. The algorithm, first described by [Ben-Dor 99], tries to maximize intra-cluster similarity and inter-cluster dissimilarity. In this way the similarity graph, within a cluster, should be represented by a clique graph. However the similarity measurements are usually approximations and errors are prone to occur. So similarity is normally represented by a clique graph with some edges missing and some extra edges. This kind of graphs are what are called corrupted clique graphs. In the corrupted clique graph model it is assumed that the similarity graph is a clique graph with edges removed and added with a probability α. The goal of the algorithm is to find the ideal clique graph given the corrupted one [Fasulo 99]. The theory behind the algorithm states that if α is not to large and M is not to small, meaning that we have a sufficiently large number of patterns, and similarity errors are not to big, then, we can choose a subset of the initial patterns p0 with high probability of it containing a core that correctly classifies all patterns in the
3.6. Clustering Methods
31
Algorithm 5 Corrupted Clique Graph Clustering Algorithm 1. Pick a random subset p0 of p. 2. Consider all ways of partitioning p0 into non-empty clusters (core candidates). 3. Classify all remaining patterns into these candidates. 4. Keep the core candidate with the clique graph more similar to the original clique graph.
initial dataset. The theoretical algorithm base on this assumption is described in Algorithm 5.
3.6.5
Hierarchical Clustering
Hierarchical Clustering is a common class of clustering algorithms, suitable for scenarios where there is not a obvious separation by well-defined clusters. Instead, these algorithms, output clusters that are represented as a tree where the root node is a cluster containing all patterns and sub-sequential nodes are divisions of that node. Hierarchical clustering methods come in two flavours: divisive and agglomerative. The first start with a big cluster containing all patterns and work down the tree by breaking it into smaller ones, while the latest start with small uni-pattern clusters that are joined, creating increasingly larger clusters. Agglomerative hierarchical clustering algorithms are much more common and are the ones that will be described next. The idea behind the algorithm is to start by creating a cluster for each pattern in the dataset, then, find out which pair of clusters is less costly to merge, and merge it. The merging process then repeats until there is only one cluster left (see Figure 3.1). To estimate the cost to merge two clusters any of the methods described in Section 3.4 can be used. If the complete cluster tree is not needed, the merging process can be stopped when
3.6. Clustering Methods
32
Figure 3.1: Hierarchical Clustering a certain number of clusters as been achieved or when the merging cost crosses a determined tolerance value (see Figure 3.1 - stopping at dashed line creates the clusters with a thicker border in the image).
3.6.6
Local Search
The same optimization techniques studied in Section 2.2 can be easily adapted to provide clustering algorithms. The main idea behind this technique is to look at a cluster configuration as a solution for the clustering problem. This solution can then be optimized using, for instance, the SA algorithm. In this case, swapping patterns from a cluster to another could be used to create neighbouring solutions. An even better utilization of optimization techniques can be achieved if, instead of creating an initial random solution, we apply a simple clustering algorithm (i.e. k-means) prior to trying any optimization. [Kanungo 02] has a good overview of various swap strategies that can be applied to local search methods in order to improve the k-means method.
3.7. Conclusions
3.6.7
33
Dynamic Local Search
Recently a new clustering method was developed, called Dynamic Local Search ( [Karkkainen 02]), that claims to be able to solve, simultaneously, the two main questions clustering algorithms try to answer: how many clusters exist and to which cluster each pattern belongs to. The original idea behind the method is that Local Search can be used, in a brute force manner, to generalize the problem to one where we do not know the number of existing clusters. This is done by applying the method to every reasonable number of clusters and choosing the one that minimizes the cost function. This method has the obvious drawback of being terribly inefficient. [Karkkainen 02] rationalized that it was possible to use the Local Search methodology to solve both problems at the same time simply by adding the removal and creation of clusters to the operations that generate neighbouring solutions.
3.7
Conclusions
In this Chapter several clustering algorithms have been addressed. The clustering problem and its variants have also been explained and listed. Clustering is a much harder problem than what can be supposed at first glance. The vast number of different clustering algorithms that can be found in literature is a reflex of the great number of different problems, with each one requiring different approaches. Besides having to choose from a great variety of algorithms, several small details have to be decided when applying clustering techniques like how to calculate distances between elements and clusters. There is also a major problem found with every clustering algorithm: without any sense of scale it is impossible to assign elements to clusters without any user input.
3.7. Conclusions
34
In Chapter 4 some of the clustering algorithms that were just presented, as well as optimization methods like the ones that were analyzed in Chapter 2, will be used in order to develop a optimization system like the one presented in Chapter 1.
Chapter 4 Project and Implementation A generic optimization system has been implemented to validate the ideas behind this dissertation. Four main points are behind the construction of this prototype:
• In the simulation optimization field, researchers often develop their own optimization systems. This happens mainly because it is relatively easy to develop a fairly decent optimizer from scratch. However having a generic optimization system available would allow the researcher to optimize his simulation with several, and perhaps more advanced, optimization methods and use some already developed analysis tools. • No system is ever generic enough for everyone. So, having the possibility of extending a system is crucial when developing a generic system. In particular this optimization system should allow new optimization methods to be added easily. • Simulation based optimizations are always, or almost always, CPU intensive. This happens because optimization algorithms need to run simulations, which sometimes are already CPU intensive, numerous times, in order to achieve good results. An usable optimization system must take this into account. Distribution is the most obvious way of working around this problem, so a 35
4.1. Architecture
36
good optimization system should allow the distribution of workload across different machines. • Simulations are used many times to optimize a set of parameters that will be later used in the real world. Most optimization systems approaches do not take into account the fact that there are environment changes occurring every time in real life applications. • A much needed feature in todays optimization systems, that will help understand and cope with changing environments, would be a scenario/result analyzer. This tool would help users understand what kind of solutions there are to the problem and in which scenario each can be applied successfully.
The next sections will explain how a system based in this previous ideas could be, and was, developed.
4.1
Architecture
As already explained in Chapter 2, a simulation normally receives a set of parameters and outputs a set of results. Besides that, most simulations have a set of environment parameters that can be user adjusted or randomly selected. A generic optimization system must to cover as many different configurations as possible. However, creating a system that is to complicated to use should be avoided. So, a few concessions had to be made in order to keep the system simple. However, the system should allow different simulation configurations to be used by means of system extensibility. The system will be composed of several modules that will be introduced in the following paragraphs and explained in full detail in the subsequent sections. To begin, a module that will interact with the different type of simulations will be needed. This module should, first of all, be distributable so we can have several
4.1. Architecture
37
Figure 4.1: Master-Slave Architecture instances of it running in different machines (see Figure 4.1). It should also be able to receive a binary file for a certain simulation, instructions on how to run it with different parameters and how to gather results from it. A second module, that will work closely with the one just described, will be responsible for evaluating simulation runs. Another task of this module will be to mask the fact that simulations are normally stochastic in nature. Optimization is obviously the major goal of the system so an optimization module is essential. This module will use the evaluator module in order to get the results from various simulation runs and use these results to find the optimum parameters for a given scenario. A final module will aggregate and analyze results from the optimizer, in order to create a dynamic optimization schedule for the simulation, and allow the user to better understand how parameters and scenarios influence each others. The aggregator module will talk to the optimizer as well as with the evaluator. Figure 4.2 captures the various modules and their interaction.
4.2. Technology
38
Figure 4.2: System Modules Interaction
4.2
Technology
The most important choices made when deciding the technology to be used in the project, were selecting the programming language and the communication protocols to be used. The choice was the Java programming language because of its multi-platform characteristics, as it would make it easier to find a large set of computers available for hosting simulation runners, and the XML-RPC communication protocol for its excellent Java implementation, easiness of use and multi-platform characteristics.
4.3
Modules
In the next sections we will take a more detailed look into the inner workings of each of the modules that compose the optimization system.
4.3.1
Simulation Runners
Simulation Runners are responsible for the interaction between the optimization system and the simulations being optimized. Three particular aspects have to be dealt with:
4.3. Modules
39
• Simulation version awareness and differentiation; • Communication with the optimization system; • Interaction with a diversity of simulations. Simulation runners have to be able to differentiate between simulation projects and even between versions from the same project. One solution could be to send the project code every time a simulation run was demanded from a simulation runner. This solution has obviously a great drawback, as sometimes the simulation code can be quite large and time would be wasted in communications. The solution found to this problem was a simple one. Every time the server starts working on a new project it calculates a fingerprint for that specific project. The fingerprint is calculated simply by means of a MD5 hash function applied to the name of the simulation file and its size in bytes. This solutions assumes that two different projects with the same filename and the same file size are very uncommon. To allow the simulation runners to receive orders from the optimization system a simple communication protocol had to be developed. The protocol consists of three simple messages:
• hasProject(String hash) - This method will allow the optimizer to query the simulation runners if they already have the code for a certain project, thus preventing unnecessary communications. The single parameter of this function is the hash code of the project. • createProject(String hash, String filename, byte[] contents) - If the simulation runner does not have the code for the project the optimizer will then issue a request for the project creation. The parameters for this request will be the hash code of the project, the filename where the project code has to be stored and the contents of the project themselves. • receiveWorkloadRequest(String hash, String commandline, Vector params, Vector values) - After the simulation runner receives the code of the project the
4.3. Modules
40
Figure 4.3: Simulation Communication optimizers can start issuing requests for the execution of workloads. Besides sending the hash of the project to be executed, the optimizer will also send the command line that the simulation runner should use and two vectors containing the parameters for this concrete execution and their respective values.
Simulation runners would also have to communicate the results of the simulations back to the optimizer system. This communication will be detailed in the following section. Another situation that had to be dealt with the simulation runners was how to communicate the different parameter values to diverse simulations. Each simulation will, of course, expect to receive their parameters in a different form. As it is impossible to imagine all the forms of interfacing with different simulations we resorted to the possibility of extension. An abstract class (see Figure 4.3) was created with a single method: communicateParameters. This method would receive the parameters, and their respective values, that are to be communicated to the simulation. The several implementations of this class could then write to the correct files, and in the correct form, the values to be passed to the simulation. The possibility of this method changing the command line, in order to communicate the values by that mean, was also contemplated by adding a return value. For testing purposes, a simulation communicator capable of writing to property files (a common file type used in the Java language) was implemented.
4.3. Modules
41
A simple change had to be made to the communication system between the optimizer and the simulation runners so that the correct Simulation Communicator class could be selected: a new parameter, the communicator class name, was added to the createProject message:
• createProject(String hash, String filename, String communicator, byte[] contents)
The following section will analyze how the evaluator module was conceived.
4.3.2
Evaluator
The evaluator, is the module responsible for communicating with the simulation runners. The evaluator must be capable of, as the name already indicates, evaluate simulations, given a set of parameters and a specific scenario. To handle this responsibility it has to be able to perform the following tasks:
• Distribute workloads amongst the different simulation runners; • Receive results from simulation runs; • Cope with the fact that simulation are often stochastic in nature. To be able to distribute workloads properly, the evaluator must be aware of which simulation runners are currently connected to the system and, from them, which are currently available. When a simulation runner is started it issues a connect message to the optimizer system. This message is intercepted by the evaluator and the simulation runner is marked as being available. Distributing workloads is then just a matter of knowing which workloads are still in need of being evaluated, which simulator runners are available and sending the correct sequence of hasProject, createProject and receiveWorkloadRequest to the simulation runners.
4.3. Modules
42
Figure 4.4: Evaluator Sample Communication As soon as a simulator runner finishes a simulation run it issues a workloadFinished message to the evaluator. The evaluator then marks this simulation runner as available again. The existence of pending workloads is then considered and, if they exist, one is sent to the simulation runner that has just finished its work. As said before, simulations are often stochastic, this means that a single simulation, even having the same parameters and the same scenario, might not give the same results every time. In this way, it is the evaluator’s task to ensure that each workload is executed more than one time and to calculate the means and average deviations of each result value for each workload. The evaluator is also responsible for knowing how many times each workload should be, and has been, executed. A sample communication between the evaluator and a simulation runner can be seen in Figure 4.4. In the next Section, the implementation of the optimizer module will be analyzed, as well as the way it uses the evaluator capacities.
4.3. Modules
4.3.3
43
Optimizer
The optimizer module has the task of using the evaluator to optimize a given project. A project will have the following set of attributes:
• The source code and command line to execute the simulation; • The number of times each simulation scenario must be evaluated; • A set containing the parameters for the simulation (including their minimum and maximum values); • A set of environment parameters (each simulation will run with different environment parameters); • A set of results variables (the results returned from each simulation). The optimizer will then create several sets of workloads and pass them to the evaluator. A workload will have the following components:
• The project it belongs to; • The values for each parameter from the project; • The identification of the scenario currently being evaluated. The scenario identification has been introduced for aggregation purposes. As we are not trying to get get an optimized solution that will work in every scenario the aggregator module will have to inform the optimizer of which scenario to use in its optimization process. One way of doing it would be to pass the values of each environmental parameter to the optimizer, with the optimizer then passing them to the simulation runners. However we discarded this solution for three main reasons:
4.3. Modules
44
• Environment parameters could have complicated constraints in some simulations; • The distribution of the environment parameters might not be linear; • The environmental parameters might not be easily settable by the simulation but instead be calculated based on other variables.1
So we give the simulation the responsibility of generating the environmental parameters. However we still need some control in order to repeat simulations with the same environmental parameters. The solution found was to allow the aggregator to set the random seed that the simulation will use to create the initial environment for the simulation (the scenario identification). After evaluating a workload the evaluator should have appended the following components to the workload:
• The result values from the simulation; • The environment parameter values from the simulation. A simplified diagram of the optimizer classes can be seen in Figure 4.5. In this Figure we can observe how a Project is composed by three sets: Results, Parameters and EParameters (environmental parameters). Projects also have a set of Workloads with each one of them having a set of values for each Parameter, Result and EParameter of its Project. In order to make the system extendable and generic an abstract class, called Optimizer, was developed. The class has two methods: optimize() that is called when 1
For example, in a simulation where agents act in a virtual city, the environmental parameters might be the average size of the buildings and length or width of the roads. However this parameters depend on the actual composition of the city. It would not be easy for a simulation to create a city from scratch that would have exactly the environmental parameters asked by the aggregator.
4.3. Modules
45
Figure 4.5: Optimizer Project Classes a new project is starting and evaluationFinished() that is called whenever the evaluator finishes processing a batch of workloads. New optimization methods can be easily added simply by extending this class (see Figure 4.6). Three extensions to these abstract class have been implemented for testing purposes:
• HCOptimizer - An optimizer based on the Steep Ascent Hill Climb algorithm (see Section 2.2.1).
Figure 4.6: Optimizer Classes
4.3. Modules
46
• SAOptimizer - An optimizer based on the simulated annealing algorithm (see Section 2.2.2). • GAOptimizer - An optimizer based on Genetic Algorithms (see Section 2.2.4).
4.3.3.1
Hill Climbing Optimizer Implementation
Developing the Hill Climbing optimizer was rather straightforward, thanks to the capabilities of the evaluator module. The basic idea behind the method, is to start with an initial population of solutions. Then, workloads for each one of those solutions are sent to the evaluator module. After receiving the results for those solutions, the best one of them is picked. The optimizer then generates workloads for each of the neighbours of that best solution and sends them to the evaluator again. If a better solution is found, it continues working from that solution. If not, it starts a new batch of random solutions. In fact the algorithm implemented is, in reality, the Random Restart Hill Climbing (see Section 2). The algorithm used for the Hill Climbing Optimizer can be seen in Algorithm 6. For clarification purposes, a simplified version of the implemented HCOptimizer main methods can be seen in Listings C.1 and C.2.
4.3.3.2
Simulated Annealing Optimizer Implementation
The implementation of the SA optimizer module was much similar to the implementation of the HC optimizer module. Two new variables were defined, one with the values of the current temperature and the other with the decrement to be made, to that same temperature, in each iteration. The only other alteration done was to start accepting worse solutions with a probability given by the following formula:
4.3. Modules
47
Algorithm 6 Hill Climber Optimizer Algorithm 1. Generate random workloads 2. Set current and best workload as none 3. Evaluate workloads 4. For each finished workload do: (a) If workload result is better than current best workload then set best workload as this finished workload (b) If workload result is better than current workload then set current current workload as this finished workload 5. If current workload changed generate neighbours to current workload 6. Else generate random workloads and set current workload as none 7. If maximum number of simulation runs reached stop 8. Goto step 3
P (t, ∆f ) = e
−∆f t
(4.1)
were ∆f represented how much worse the current solution was relatively to the best solution and t was the current system temperature. The algorithm used for the Simulated Annealing Optimizer can be seen in Algorithm 7. For clarification purposes, a simplified version of the implemented SAOptimizer main methods can be seen in Listings C.3 and C.4.
4.3.3.3
Genetic Algorithm Optimizer Implementation
Developing a generic GA optimizer modules poses several problems. GA optimization algorithms generally use bit strings in order to represent a certain individual solution. The way each solution is coded affects the optimization performance to a large extent.
4.3. Modules
48
Algorithm 7 Simulated Annealing Optimizer Algorithm 1. Generate random workloads 2. Set current and best workload as none 3. Evaluate workloads 4. For each finished workload do: (a) If workload result is better than current best workload then set best workload as this finished workload (b) If workload result is better than current workload then set current current workload as this finished workload (c) Else, with a probability given by equation 4.1, set current current workload as this finished workload 5. If current workload changed generate neighbours to current workload 6. Else generate random workloads and set current workload as none 7. If maximum number of simulation runs reached stop 8. Goto step 3
For instance, in the classic Travelling Salesman Problem (TSP) there are several ways a path can be encoded. [Larra˜ naga 99] identified five different representations for this particular problem: Binary Representation, Path Representation, Adjacency Representation, Ordinal Representation and Matrix Representation. The Path Representation model is the most natural form of representing a TSP path. For example, a path going through four cities in this order 1-3-4-2 would be represented just as 1-3-4-2. The Adjacency Representation model would represent the same path as 3-1-4-2. In this last model, the fact that the third city in the representation is city number four, means that that city will be visited just after city number three. The Adjacency Representation model gives more importance to the order in which cities are represented and less importance to the specific position of each city in the path. Besides that, it uses different mutation and crossover operators and has different success rates. This example shows that when using GAs each problem is a unique case and a
4.3. Modules
49
generic GA optimizer will never be able to reach solutions that are as optimal as those given by a GA created specifically for a concrete problem. However, in this particular case, a generic GA optimizer had to be implemented. The solution found to this problem, although non-optimal, was to code each gene as the value of each parameter that had to be optimized. The next paragraphs will explain how the selection, crossover and mutation operators were implemented. The selection operator starts by creating a set of possible parents. Each individual had a probability equal to
value−worst best−worst
to be selected as a parent candidate (where
result is the value of the individual being analyzed, worst is the lowest simulation result amongst the current generation of individuals and best is the highest value of those same results). Each individual of the next generation was then created based on two randomly selected individuals from this set using the crossover operator. The crossover operator was defined as taking parameters from each of the two individual solutions that were being mated, with a probability of 50% for each parent, and mix them to form a new solution. A mutation operator was also implemented. This operator was simply defined by incrementing or decrementing each parameter by one with a very small probability factor. The algorithm used for the Simulated Annealing Optimizer can be seen in Algorithm 8. For clarification purposes, a simplified version of the implemented GAOptimizer main methods can be seen in Listings C.5, C.6 and C.7.
4.3.4
Aggregator
The last module to be explained will be the aggregator. The aggregator has two specific tasks:
• Run the optimizer for several different scenarios;
4.3. Modules
50
Algorithm 8 Genetic Algorithm Optimizer Algorithm 1. Randomly generate a set of workloads representing the first generation of individuals 2. Set current and best workload as none 3. Evaluate workloads 4. Calculate difference between best and worst workload 5. For each finished workload do: (a) If workload result is better than current best workload then set best workload as this finished workload , add the 6. For each finished workload, with a probability equal to value−worst best−worst workload to the pool of parents of the next generation of individuals 7. Generate each individual of the next generation as: (a) Randomly select two individuals from the pool of parents (b) Create a new individual by mixing parameters from both of the parents (for each parameter, each parent as a 50% probability of having its value chosen) (c) For each parameter, with a probability of 10%, add or subtract one unit (50% probability for each case) 8. If maximum number of simulation runs reached stop 9. Goto step 3
4.3. Modules
51
• Analyze the results from the optimizer. Running different scenarios through the optimizer is a matter of executing the same project several times with different scenario identifications. The real challenge in this module is the result analysis. Optimizing n different scenarios for a simulation S, will produce a set of results → − → − R , in the form R = (r1,..., rn ). Each one of those results r is the union of three − − − other values r = (→ s ,→ p , v), where → s is a set of environmental parameters, in the − − form → s = (s1 , . . . , sm ), → p is a set containing the parameters that optimize that − scenario, in the form → p = (p , . . . , p ), and each v is the best value achieved in 1
k
that optimization. The values n, m, and k represent, respectively, the number of different scenarios optimized, the number of different environmental parameters and the number of different parameters optimized in each scenario. → − → − − If we take all → p from the set R we get a set P containing all good solutions for the problem (although each solution is optimum only for a specific scenario). Having → − → − − the same approach we can derive a set S from all the → s values from R . → − Conjecture 1: In certain simulations, given a set P , containing the optimum solu→ − tions for a set of representative scenarios S , it is possible to construct subsets → − → − P 1 , . . . , P q whose elements are similar, inside each one of those subsets, but dissimilar to elements of the other subsets.
In other words, what we are stating is, that for some simulations, classes of solutions should emerge from the set of all possible solutions. − → Conjecture 2: For a given class of solutions Pa and the scenarios that this class − → → − → − of solutions solves Sa , it is possible to construct subsets S a1 , . . . , S an whose elements are similar, inside each one of those subsets, but dissimilar to elements of the other subsets.
4.3. Modules
52
Figure 4.7: Scattered Simulation Results In other words, in some simulations, a specific class of solutions will also only solve some specific classes of scenarios. Understanding the composition of each one of these subsets can prove to be a valuable help in the field of simulation optimization.
4.3.4.1
Solution Aggregation
→ − When analyzing the set P , of all the parameter configurations that were found to be the optimum ones, for at least one simulation scenario, we can be presented with two different cases that will be explained in the following paragraphs. In Figure 4.7 we have an example of a simulation with two parameters (p1 and p2 ). When the distribution of these two parameters is analyzed, the results appear to be scattered throughout the entire space of solutions. This means that, in this case, it would not be possible to disclose any kind of parameter classes. In these type of simulations, every, or almost every, parameter configuration is the solution to some scenario. However, we expect that some simulations present a rather different scenario. In the previous section we conjectured that in some simulations we could form clusters, or groups, of parameter configurations that were similar. Figure 4.8 shows an example of such a simulation. In this case, three different classes of parameter configurations
4.3. Modules
53
Figure 4.8: Clustered Simulation Results can be clearly identified. An example of how this situation can occur can be seen in Figure 4.9. For sake of simplicity we used, as an example, a simulation with only one configurable parameter (p1 ) and one environmental parameter (s1 ). The left graph of this figure shows the optimum value of p1 , as the variable s1 changes. It can clearly be seen that the optimum value for p1 revolves around a value for lower values of s1 , but at some point that values abruptly ceases to be a good solution to the problem and the optimum value for p1 becomes a completely different value. We can then identify two different classes of solutions: C1 and C2 . The right graph, of that same figure, shows how the output variable (v) behaves for each one of the classes of solutions. We can observe how the first class of solutions works very well for a definite set of possible scenario configurations and the second class of solutions works for a different set of scenarios. Now, a way of determining classes of solutions for a simulation must be determined. One way of managing this will be by using the same clustering methods we saw in Chapter 3. As seen, in that same Chapter, all clustering methods need to calculate the distance between elements. A simple way of calculating the distance between classes and solutions from a simulation will be by using one of the distance heuristics seen in
4.3. Modules
54
Figure 4.9: Parameter and Scenario relations
Figure 4.10: Aggregating Scenarios Section 3.4 and, for example, the euclidean distance metric.
4.3.4.2
Scenario Aggregation
Aggregating all solutions from a certain simulation will produce nc sets of solutions: − → − → −→ (C1 , C2 , . . . , Cnc ). A second step in the aggregation process would be taking each one of the sets and analyze if their scenarios also obey any kind of pattern. It is expected, from simulation scenarios, to be scattered without any scenario classes emerging. However, if we look at a solution class at a time there is a clear possibility that such classes appear. This happens because similar solutions are expected to solve similar scenarios. In Figure 4.10 we can see an example of a simulation with two input parameters (p1 and p2 ) and two environmental parameters (s1 and s2 ). As can be seen, the scenarios in this example are rather scattered but when we select only the scenarios solved by the solution class C1 we can see a scenario cluster emerging (D1 ).
4.3. Modules
55
It is also possible, that one class of solutions solves more than one class of scenarios, so the same clustering algorithms that can be applied in the Solution Aggregation problem (as has just been seen in Section 4.3.4.1) should, and can, also be applied in the Scenario Aggregation case.
4.3.4.3
Aggregation Implementation
To implement the aggregation of scenarios, the K-Means clustering algorithm (explained in Section 3.6.1) was used. In order to implement this particular algorithm some choices had to be made:
• How to calculate the distance between clusters and scenarios? • How many clusters to start with? • How to choose the initial cluster centroids? • How to characterize each one of the constructed clusters? A first approach to measuring the distance between a cluster and a certain scenario was to test how much would the scenario lose, relatively to its best parameter configuration, if the parameters used were the ones of the modified cluster (i.e. after the scenario has been added to the cluster). This, however, revealed very time consuming. A second approach was to use a simple euclidean distance measurement, even knowing that, if the system was too sensitive to small parameter configuration changes, then bad results would be obtained. The latest method was chosen knowing that if results were not satisfactory it was always possible to fall back to the slowest, but more accurate, first method. The K-Means algorithm suffers from the same problem as many of the other clustering algorithms seen in Chapter 3 as it does not have a way of determining how many clusters exist. This happens because there is no sense of scale, so some information must be given by the user. An alternative would be to start with as many clusters
4.4. Scenario Adaptation
56
as scenarios and hope that most of the clusters are empty in the end of the process. This alternative was chosen for the implementation of the aggregation module of the developed optimization system. The centroids of the initial clusters still have to be generated in some way. From the methods presented in Section 3.5 the one that seemed most promising was the Spread method. This method was the one used in this particular case. After performing the aggregation step, and in order to perform the adaptation step of the process (as explained in Section 4.4), a set of parameters and its corresponding scenario variables must be chosen for each cluster. A solution would be to use the centroid of each cluster, but nothing can guarantee that a solution near the center of a set of good solutions would also be a good solution. In this way, it was decided to use the closest scenario from the centroid of the cluster as the representative scenario of that same cluster. This will not guarantee that the chosen scenario will have a parameter configuration that is good for all elements in the cluster, but at least its configuration is good for itself and will probably be reasonably good for the other elements in the cluster. The algorithm used for the Simulated Annealing Optimizer can be seen in Algorithm 9. For clarification purposes a simplified version of the implemented KMeansClusterCreator main methods can be seen in Listing C.8.
4.4
Scenario Adaptation
Simulations are often created in order to mimic real world situations. For that reason, most of the time, they are dynamic. Therefore any system or agent trying to get the most out of a simulation must adapt itself to the current scenario. In Section 4.3.3, we have described a method of generating optimized solutions per scenario and in Section 4.3.4 a method to aggregate solutions into classes of solutions and scenarios into classes of scenarios.
4.4. Scenario Adaptation
57
Algorithm 9 K-Means Clustering Algorithm 1. Create a number of random empty clusters larger than the number of workloads to be clustered 2. For each workload: (a) Find the nearest cluster using the euclidean distance to the cluster centroid (b) Add the workload to the found cluster (c) Calculate the new cluster centroid 3. For each non empty cluster: (a) Find the closest workload, from those in the cluster, nearest to the cluster centroid (b) Set the cluster centroid equal to the found workload
This Section, will explain how those results can be used to create an agent, agents or a system that can optimize the result of a simulation running in a dynamic scenario. Figure 4.11 shows the optimizer system interacting with the simulation in order to get the optimum parameters for a set of scenarios. These scenarios and their optimum parameters are then analyzed by the aggregator in order to create classes of solutions and scenarios. These results can then be written into a configuration file that will allow the simulation to adapt to dynamic scenarios. We can approach the problem of creating an adaptive simulation in two different ways that we will call the Nearest Scenario and Nearest Aggregate approaches. In the following sections we will explain these two approaches and give a brief insight on their implementation.
4.4.1
Nearest Scenario Approach
One way of implementing scenario adaptation will be by simply listing all scenarios tested with their optimum parameter as calculated by the optimizer in the form:
4.4. Scenario Adaptation
58
Figure 4.11: Scenario Adaptation
S(i) = si1 , . . . , sin , pi1 , . . . , pim
The simulation could then just find the scenario from the listing that was nearest to the present simulation conditions. A simple metric, like the euclidean distance, could be used to determinate the correct scenario. This approach, although simple, has some disadvantages:
• The scenario listing might be to extensive. This could make finding the best scenario computationally impossible. • In some simulations constantly changing parameters can be complicated or undesired. This method would force simulations to change their parameters only due to small scenarios fluctuations.
The second problem could be solved by only changing the simulation parameters in regular intervals. This would unfortunately cause other problems:
• In simulations where conditions do not change often, at least not dramatically, but that need a swift response when they do, this method could cause a slow
4.4. Scenario Adaptation
59
reaction to environmental changes. • Even if not as regularly this method would force configuration changes even when not strictly necessary.
A different approach would be to only change the configuration when the current scenario had an optimum configuration that differed significantly from the current one (or when the current scenario changed dramatically). The problem with this approach is how to evaluate if a configuration/scenario differs greatly from another one. With no sense of scale it becomes tricky to make any type of decision on when to change to another parameter configuration. One solution would be to first analyze, for example, average distances between elements. A better one would be to classify the solutions and group them according to their similarity. This later solution is what we will discuss in the following Section.
4.4.2
Nearest Aggregate Approach
A different method of implementing adaptiveness could be developed by using the optimum parameter and scenario classes that the aggregator module produces. This could be done, if for every scenario class we had a representative parameter configuration. This configuration could be for example the centroid of the configuration class or the tested configuration most near to the centroid. To use this method we would need the aggregator to output its results in the following form:
S(i) = sci1 , . . . , scin , pi1 , . . . , pim
Where scij is the coordinate j of the centroid of scenario class i and pik is the value of the parameter k that was found to be optimum for that same scenario class. Some different methods can be used to find which parameter configuration to use for each scenario class:
4.5. Conclusions
60
• Test all parameters configurations found for that class against all scenarios. This method might reveal impracticable due to performance reasons; • Find the nearest tested parameter configuration to the class centroid; • Select a sample of the parameter configurations of that class and test them against the class scenarios; • Select random parameter configurations nearer the class centroid and test them against the class scenarios; • Apply an optimization algorithm but this time use the average result from the complete scenario class instead of testing one scenario at a time.
The advantages of this method over the Nearest Scenario approach are that we can react to sudden changes quickly and, at the same time, we are not changing the simulation configuration constantly as a reaction to small environmental changes. Then main concern one has to have when using the Nearest Aggregate approach, is to be sure that the parameter configuration chosen for each scenario is good enough for all the elements in that scenario. This can be easily done by testing that configuration against all representatives of the scenario class. As we do not know the scale of the simulation results we need some kind of input from the user to be able to determine how much of a loss is admissible.
4.5
Conclusions
In this Chapter, the architecture of a generic optimization system has been presented. This system was designed having in mind the following problems:
• The great amount of work that represents testing and implementing optimization procedures; • The CPU workload posed by an optimization system;
4.5. Conclusions
61
• The fact that optimization algorithms were created having in mind static scenarios and do not work with dynamic scenarios;
To tackle these problems, the designed system will be: generic, extendable, distributable and adaptable. Some classic optimization algorithms have also been implemented: Hill Climbing, Simulated Annealing and a Genetic Algorithm. To enable the use of these kind of optimization methods in highly dynamic scenarios the use of clustering in optimization problems has been introduced. Clustering optimization results, allows the creation of sets of results that can be applied to different scenarios. In Chapter 5, an example simulation will be introduced. The implemented system will be tested against this same example. The results of this testing procedure will be presented and analyzed in Chapter 6.
Chapter 5 Traffic Lights Simulator In this chapter, the simulation used to test the optimization and aggregation system will be explained and analyzed.
5.1
Traffic Simulation Scenario
In order to find a simulation that allowed the testing of all the desired aspects of the implemented system, several characteristics were sought:
• Different Scenarios - The simulation had to have different scenarios that required completely different parameter configurations. This would allow testing the optimization module, as well as the aggregation module. • Different Results - The simulation should output at least one result. This result should allow the ranking of parameter configurations for the same scenario. Several result outputs would allow the optimization according to different parameters and applying constraints to some of the secondary results. • Parameter Configurations - The simulation should have a set of configurable parameters. The optimum configuration of these parameters should depend on the current scenario. 62
5.1. Traffic Simulation Scenario
63
• Dynamic Scenarios - It should be possible to create a dynamic scenario. In this way the simulation would experiment different parameter configuration needs during each run. This would allow testing the scenario adaptation capabilities of the system. • Simulation Speed - A simulation run should not take too long in order to allow the maximum number of tests possible. • Stochasticity - A stochastic simulation would allow testing if the simulation adapted well to this type of situations.
Several possible simulations were considered, and in the end the choice was to implement a very simple traffic simulation system. This simulation has all the characteristics listed previously and was fairly easy to implement. The model chosen was very simple:
• Several roads, each with only one lane in either direction; • Roads could be either vertical or horizontal; • Each car would enter the city in a certain lane and exit the city in that same lane. Lane changing, or turning, were not considered to keep the simulation simple; • Traffic lights at each road intersection. A traffic light could be in one of three states: open for vertical traffic, open for horizontal traffic or changing states (yellow light); • Cars would follow the car in their front according to a driver model (explained in the next section).
Besides having the characteristics just listed, in this simulation it was expected that classes of solutions (containing different parameter configurations) and scenarios emerge (see Section 4.3.4).
5.1. Traffic Simulation Scenario
5.1.1
64
Intelligent Driver Model
The driver model chosen was one recently developed by [Treiber 00] in order to study traffic in freeways. This driver model, named Intelligent Driver Model (IDM), defines a follow the leader behaviour for each driver based in the following concepts:
• Every car has a desired velocity. It should be possible to have different types of cars with different desired velocities. • Every car has a set of parameters that represent its acceleration and breaking capabilities. • Following the next car in the lane is done by updating the current acceleration of the car. • The acceleration of the car depends on two components: desire to accelerate and desire to brake. • The desire to accelerate depends on how close the velocity of the car is from its desired velocity. • The desire to break depends on the safety distance, distance to the next obstacle (car or traffic light) and the rate of approximation. • Safety distance is calculated depending on the car characteristics and current speed.
The formulas that regulate the current velocity are the following:
v∆v s∗ = sm + (vT + √ ) 2 ab
(5.1)
s∗ v dv = a[1 − ( )δ − ( )2 ] dt vd s
(5.2)
5.1. Traffic Simulation Scenario
65
Where s∗ is the desired distance (m) to traffic ahead, having in count the driver and car characteristics and the current velocity, and
dv dt
is the desired acceleration
to achieve that same distance. Some other variables have to be calculated based on the current velocity, distance to following obstacle and speed of the next obstacle:
• v - Current velocity of the car (m/s) • ∆v - Rate of approximation of the next obstacle (m/s) The following variables define the behaviour of each car:
• vd - Desired velocity (m/s) • T - Desired safety time to traffic ahead (s) • a - Comfortable maximum acceleration (m/s2 ) • b - Comfortable breaking acceleration (m/s2 ) • sm - Minimum distance to front car (m) • δ - Acceleration exponent This model allows the inclusion of several types of drivers as well as slight variations in the same class of drivers. Trucks are characterized by low values of vd , a, and b, careful drivers drive at a high safety time headway T and aggressive drivers are characterized by a low T in connection with high values of vd , a, and b. In the implemented system, this same three types of drivers/vehicles were implemented: careful drivers, aggressive drivers and trucks. Every time a new vehicle was generated, one of these types was chosen based on a probability function. In order to make the simulation more realistic, small variations were introduced in each of these classes.
5.1. Traffic Simulation Scenario
5.1.2
66
Traffic Generation
Traffic is generated according to a parameter defining the number of cars per minute that enter the city by each lane. In order to allow the implementation of different scenarios, that parameter can be set individually at each lane, for each direction or it can be set equal for the entire scenario. As each car is generated, it is placed in the beginning of its lane. If the lane is full that car stays in a waiting queue and enters as soon as there is free space in the lane. In order to calculate accurately the time spent by each car as it traverses the city, the time spent in this queue must be also counted. To avoid having to keep record of every car in the waiting queue, we keep only the number of cars waiting, or car pressure (cp), and the mean time each car in the queue has spent there, or waiting time (wt). To calculate the time a car exiting the queue has already spent waiting (in order to calculate the initial value for the timer (t) of that car) the following formula is used:
t=
wt cp
(5.3)
And to calculate the new mean time of the waiting queue we use the following formula:
wt =
wt (cp − 1) cp
(5.4)
When the cars exit the simulation area they are removed from the simulation. This approach considers that outside the simulation area there are no traffic constraints. Besides that, with this, we are simplifying the model as slower cars outside the simulation area would prevent faster cars from moving quicker. In the next section the traffic lights model will be explained.
5.1. Traffic Simulation Scenario
67
Figure 5.1: Traffic Lights Schedule Example
5.1.3
Traffic Lights
The chosen traffic light model selected is one of the simplest ones possible. In this model each traffic light is assigned three values: the amount of time the traffic light is open for vertical traffic, the amount of time the traffic light is opened for horizontal traffic and a delay that will allow traffic lights to have synchronized schedulings. With this model we expect the optimizer to:
• Assign larger opened times to roads with more traffic; • Assign the same opening times to traffic lights in the same road; • Assign delays that allow cars to go pass traffic lights without stopping. In Figure 5.1 we can observe how delays can help traffic to flow more smoothly. In this figure, a car (c), with a constant velocity, goes trough two traffic lights (tl1 and tl2 ) without stopping. In this case the delay was well chosen for maximum throughput in that direction. More complex traffic light models could be used. For example, an agent-based traffic lights system, where each traffic light would be an agent and communicate with the neighbouring traffic lights, could have been used. Learning and cooperation could
5.1. Traffic Simulation Scenario
68
Algorithm 10 Traffic Simulation 1. Move cars; 2. Generate new traffic; 3. Update cars velocities; 4. Change traffic lights according to schedule; 5. Remove cars outside scenario; 6. Goto step 1;
also have been added to the simulation. These more complex models could also have been the target for an optimizer, as even intelligent agents have configuration parameters, but this simpler model will allow a better understanding of how the optimizer is progressing.
5.1.4
Simulation
The previous sections addressed the road model, traffic generation and the traffic light scheduling systems. In this section, the simulation system will be analyzed. Like most simulation systems, the traffic control environment developed tries to recreate reality by taking a small step at a time. Smaller steps will give results that are more approximate to the reality while larger steps will make the simulation run faster. The step being used in this particular simulation is 25 milliseconds, meaning that the current velocity of the car is recalculated each 25 milliseconds in simulated time. This is a particularly small step for a traffic simulation but still it manages to run relatively fast. Tests show that the simulation step can be raised up to 250 milliseconds without great loss in simulation quality but with a great performance improvement. By raising the step to 250 milliseconds the simulation results did not differ largely from the ones using 25 milliseconds but the simulation would take 10 times less to run.
5.1. Traffic Simulation Scenario
69
In each one of these simulation steps certain events are fired. The events that occur in these steps can be seen in Algorithm 10 and will be analyzed next. Moving cars is just a matter of adding to the current position of the car, the distance that it should have traveled at the current velocity in the time given by the simulation step. As stated previously, each road has its own rate of new cars per minute. To generate new cars, the rate of cars has to be adjusted to the simulation step and then with a simple random function the entry of a new car in the road can be decided. Car velocities are updated as explained in Section 5.1.1. To change the traffic lights, one just has to analyze the current simulation step, vertical and horizontal timings for each traffic light and the traffic light delay. With this last step the simulation is ready to run. In the following sections the parameters, both input and output, as well as the user interfaces will be addressed and explained.
5.1.5
Parameters
Obviously, the simulation will have to communicate with the optimizer system in some way. As seen in Section 4.3.1 and Figure 4.3 the optimizer system allows several communication standards, and even allows easy adding of other communication forms. The chosen method of communication, for this simulation, was the use of Java property files. Three different files are used in this communication process, one for receiving the configuration parameters, one to inform about the scenario parameters and another to report the simulation results. In this particular simulation, the configuration parameters received are just the traffic light scheduling values. Each traffic light is assigned two coordinates. The first one refers to the vertical road where the traffic light is situated, while the second one refers to the horizontal one (see Figure 5.2). Three variables are also assigned
5.1. Traffic Simulation Scenario
70
Figure 5.2: Traffic Light Coordinates to each traffic light: the time the traffic light is opened for horizontal traffic, the time the traffic light is opened for vertical traffic and the delay for the traffic light first state change (all this three variables are in seconds). An example configuration file for a simulation with two traffic lights would look like this: trafficlight.0.0.h = 10 trafficlight.0.0.v = 5 trafficlight.0.0.d = 0 trafficlight.0.1.h = 10 trafficlight.0.1.v = 5 trafficlight.0.1.d = 5 In order to reduce the number of parameters of the simulation some simplifications have been made to this model. A fixed cycle time was introduced so that all traffic lights take the same time in each cycle. The cycle time is a configuration parameter and can be optimized. Having a fixed cycle time, the system only has to optimize the percentage of time each traffic light stays open for horizontal traffic and the percentage1 of delay. An example of this simplified configuration file follows: cycle = 30 1
In fact only values from 1 (10%) to 9 (90%) are used to reduce the search space. The values 0 (0%) and 10 (100%) are not used as they would imply that the traffic light never changed state.
5.1. Traffic Simulation Scenario
71
trafficlight.0.0.h = 5 trafficlight.0.1.h = 5 trafficlight.0.1.d = 7 In this example, the first and second traffic lights would be opened for horizontal traffic half of the cycle time (15 s). The second traffic light would have a delay of 70% of the cycle (21 seconds). The second file will contain the traffic entering each lane, in each direction (cars/minute). These values will define the different scenarios. An example scenario output file follows: north = 10 east = 20 south = 30 west = 10 The third file mentioned will contain the output results from the simulation. This file will contain all the variables the optimization system will need in order to evaluate each simulation run. In this particular case, the variables considered were: the average time each car stays inside the city (including the time waiting in the road queue), the maximum time a car as spent in the city and the number of cars that entered/exited the simulation scenario. A result output file for an example simulation would look like this: average = 45.64 maximum = 72.23 entered = 3412 exited = 3289 These three files, along with the command line interface that will be described in the next section, are the communication means between the optimizer system and the simulation. For other simulations, with different needs, other forms of communicating can be implemented by extending the existing classes.
5.2. Other Possible Scenarios
72
Figure 5.3: Traffic Simulator Interface
5.1.6
Graphical Interface
Besides the actual simulation, a simple graphical interface was also developed (see Figure 5.3). The main purpose of developing this interface was to verify if the simulation was behaving correctly.
5.2
Other Possible Scenarios
The optimization system described in Chapter 4 can be applied to several other simulations. The only requisites needed for a simulation to be compatible with the mentioned optimization system are:
• Being able to receive configuration parameters through Java property files (other possible communication protocols can be easily added into the system). • Being able to communicate the simulation results and its scenario parameters
5.3. Conclusions
73
(again by means of Java property files). • Being able to generate static and repeatable scenarios. If the first two of these requirements are not met by some simulation it should still be easy to either adapt the optimizer or the simulation itself. If the last of the requirements is not met, because scenarios are not repeatable, then the simulations have to be changed so that the optimization step can be performed. If the problem lies in the fact that scenarios are not static then a way to create static or near static scenarios must be found like for example slicing the simulation into several time slots or making shorter simulation runs. RoboCup ( [Rob 06]) Soccer and Rescue simulation leagues are very good examples of possible candidates for further testing the implemented optimization system. In these scenarios, teams of heterogeneous agents try to accomplish a complex collective task in a dynamic, multi-agent environment. In both simulations, the team strategy may be configurable at a very high-level, enabling the optimization of the team behaviour to depend mostly on the optimization of a small set of high-level parameters. Also, in both simulations, supervision agents are available that already perform a high level analysis of the simulations, providing statistics and results that may be used to evaluate the team performance ( [Reis 03]). Besides that, teams are highly configurable making them very good subjects for optimization using the proposed methodologies. The Coach Unilang ( [Reis 02]) coaching language, developed specifically for high level coordination of agents in this type of competitions, may be used by the supervision agent to communicate the optimum strategy and tactics, to the worker agents, during the simulation process.
5.3
Conclusions
In this Chapter, a simulation to be used as a test subject for the optimization system being developed, has been described. This simulation has most of the characteristics
5.3. Conclusions
74
needed to make it a good candidate for testing, namely: configurable parameters, different / dynamic scenarios, short simulation runs and stochasticity. In Chapter 6 the results of applying the system described in Chapter 4 to the simulation just described will be presented and analyzed.
Chapter 6 Results and Analysis This chapter, will describe the methods used to test each one of the major system components. Tests will be performed to assert the system regarding its optimization capabilities, aggregation performance and adaptiveness. Each section of this chapter will start by defining the different scenarios tested. The obtained results will then be addressed.
6.1
Optimization
To test the optimization capabilities of the implemented system, a scenario containing two horizontal and two vertical roads was chosen. This scenario consists of eight different input parameters that must be optimized. The output value being optimized, will be the maximum time a car will spend inside the city. This parameter was chosen, over the maximum queue size generated, as this other parameter would be zero in many of the tested scenarios, making it impossible to differentiate between parameter configurations. Another solution would be to use the maximum queue size as the primary comparison term and in cases where it was equal use the maximum time in city.
75
6.1. Optimization
76
Three different traffic configurations will be tested:
• Low traffic scenario: north, east, south, west = 5 cars/min; • Migration traffic scenario: north, east, south = 10 cars/min and west = 50 cars/min; • High traffic scenario: north, east, south, west = 50 cars/min; Each simulation was allowed to run for 3000 seconds (5 minutes). This value was chosen because it was high enough to allow the establishment of traffic patterns, but still low enough not to take to much time to simulate. The maximum number of simulation runs was stipulated as 5000, meaning that each method was allowed to run this number of simulations regardless of the number of different algorithm iterations performed. This will allow a fair comparison between the different optimization methods, although nothing can guarantee that a certain simulation method would not overcome another one after these number of iterations due to its own characteristics. So the results obtained might not reflect the true performance of each method. Each different algorithm will run a different number of simulation runs in each of its iterations.
6.1.1
Optimization Methods
In order to have a method that could be used to estimate the success of the other optimization methods, a Random Optimization algorithm has been implemented (not to be confused with the Random Search Algorithms, or Meta-Heuristics Algorithms, seen in Section 2.2). The name says it all, as this method just keeps trying new random parameter configuration in order to find good solutions. A Hill Climbing Algorithm, as described in Section 4.3.3.1, was also implemented. The specific flavour of the implemented version features Random Restarts, to prevent it from getting stuck into a local optimum.
6.1. Optimization
77
Figure 6.1: Solution Neighbourhood Structure The neighbourhood of each solution was defined as: all solutions that had parameter values that differed at most of one from the current solution. As traffic lights synchronization is very sensible to small changes in the time of the light states, mainly because normally all traffic lights must have the same pattern for synchronization even to exist, this neighbourhood structure allowed walking from good parameterizations to other good parameterizations easily. If the chosen structure only allowed moves to solutions where only one parameter add a different value (a common way of defining this kind of structures), local maximums would be very common. For better understanding this particular problem, Figure 6.1 shows the neighbourhood structure of a simple problem with only two parameters. Imagine that this two parameters were the opened for vertical traffic times of two traffic lights in the same road. If the current solution, represented in the center of the figure, was a good solution, then both times would have to be equal. Moving only in the direction represented by the lighter shaded arrows would mean losing that property making this a local maximum. On the other hand, if the current solution was a bad solution but of by one (e.g. one traffic light had the value 3 while the other had the value 4), moving only in the directions represented by the darker shaded arrows would never allow a move to the near good solution. In this way, the choice was to allow all kinds of moves even knowing that it would force the algorithm to make more simulation runs in each iteration. In this particular case, as their are 8 different parameters to optimize, instead of testing 2 ∗ 8 = 16 alternative configurations, the algorithm
would have to test 28 = 256. Applying this idea only to the critical parameters (traffic light timings) it was possible to reduce the number of configurations needed to be tested to 24 + 2 ∗ 4 = 16 + 8 = 24.
6.1. Optimization
78
A Simulated Annealing algorithm was also used in the optimization tests. The implementation of this method is detailed in Section 4.3.3.2. The SA algorithm was parametrized using 100 as the system initial temperature and 0.5 as the temperature decrement in each iteration. This values were chosen so that the algorithm would run a significant part of the time with a HC like behaviour. The neighbourhood structure used in this algorithm was, for the same reasons, the same that was used in the HC algorithm. Finally, a Genetic Algorithm optimization method was used. This algorithm was implemented as explained in Section 4.3.3.3. A number of 50 individuals per generation was used.
6.1.2
Optimization Results
Figure 6.2, Figure 6.3 and Figure 6.4 show the evolution of the best solution found, by the the four optimization algorithms, as new simulation runs were performed. As new best solutions are more common in the first few iterations, and get rarer as we approach the global optimum, to improve readability these charts use a logarithmic scale in the simulation runs axis. Figure 6.2 shows the evolution of the three algorithms in the low traffic scenario. In this chart we can see that all four algorithm achieved more or less the same result with the best algorithm being the SA. Not many conclusions can be drawn from these results as the scenario was very simple and nothing can assure us that in the next few iterations a better result found by one of the four algorithms would not change the outcome of this test. Nevertheless some curiosities can be spotted. The SA algorithm found a gold mine in the end of the test, having improved successfully a large number of times. This happened when the temperature of the system was already very low and its behaviour was already very similar to the HC algorithm. The RO algorithm had a
6.1. Optimization
79
Figure 6.2: Low Traffic Optimization Results very lucky start finding a very good solution with its first random attempt. Figure 6.3 shows the evolution of the three algorithms in the migration traffic scenario. In this scenario the GA achieved the best results with a steady evolution over the simulation runs. Figure 6.4 shows the evolution of the three algorithms in the high traffic scenario. Once again, the GA achieved the best results, this time by an even bigger margin.
6.1.3
Comparison of Methods
Table 6.1 shows how the different algorithms compare to one another. Each column features a different traffic scenario, while each row belongs to a different optimization algorithm. The values represent the maximum waiting time, in seconds, of a vehicle in the system. Marked in bold are the best results for each scenario. The GA algorithm proved to be the best choice in the two more complicated scenarios, only loosing to the SA algorithm in the first scenario, which was easier and more prone to lucky guesses. Taking this into account the GA algorithm was selected for
6.1. Optimization
Figure 6.3: Migration Traffic Optimization Results
Figure 6.4: High Traffic Optimization Results
80
6.2. Aggregation Method Random Optimization Hill Climbing Genetic Algorithm Simulated Annealing
81 Low Traffic 40.4 s 35.2 s 36.2 s 34.2 s
High Traffic 249.6 s 251.7 s 235.6 s 244.1 s
Migration Traffic 203.8 s 161.6 s 154.7 s 166.8 s
Table 6.1: Comparison of Different Optimization Methods the aggregation testing phase.
6.2
Aggregation
Several different scenarios were randomly generated with the most promising optimization algorithm (in this case the GA algorithm) applied to each one of them. This generated approximately one hundred different scenarios and their respective optimum parameter configuration (these results can be consulted in Appendix A). A quick inspection on these results yields a curious, but easy to explain, phenomena. In almost every scenario the green-red traffic light timings are equal in every crossing. This happens because synchronizing traffic lights with different opening times, would reveal rather difficult, if not impossible. What is interesting about this, is that the optimizer was not told to keep these timings equal and was equally not told to try any type of synchronization. The fact that the parameters allowed some kind of synchronization and that synchronizing traffic lights is a good way of improving traffic flow, made this kind of patterns emerge as good solutions. This shows that the optimization module is clearly doing what it is supposed to. These results were then aggregated into several representative clusters using the K-Means algorithm as explained in Section 4.3.4.3. This step, produced a set with only nine different scenarios (these results can be consulted in Appendix B). In the next Section, the use of these two sets of results to create dynamically adaptable
6.3. Adaptive Simulations
82
simulations will be analyzed.
6.3
Adaptive Simulations
The final step, was to test if the nine scenarios generated by the aggregation step could be used successfully in a dynamic simulation enabling it to adapt to different traffic patterns. For this purpose a dynamic traffic generator was developed. The dynamic traffic generator was created as a plug-in of the simple traffic simulator described in Chapter 5. This plug-in would simply read different traffic values for each direction and for each hour of the day and generate traffic accordingly, simulating an entire day of traffic. In selecting the values of traffic special care was taken in order to:
• Have sufficiently high values of traffic at some times of the day so that some optimization of the traffic lights was needed; • Not having to much traffic, so that at least one optimized parameter configuration existed that would make traffic flow smoothly; • Have traffic flow more intensely in one direction in the first hours of the day and in the other direction as the end of the day drew nearer. This would simulate typical migration traffic during rush hours.
An altered version of the traffic light simulator was developed, that instead of receiving a static traffic light schedule, would receive a set of scenario and parameter configuration pairs. This version of the simulator would constantly select the scenario, from that set, that most resembled the current scenario and use the traffic light configuration that was considered as the best for that particular case. This setting was run with three different configuration files:
6.3. Adaptive Simulations
Complete Clustered Single
Avg/Max Waiting Time 30 / 94 s 23 / 82 s 28 / 87 s
83 Max Queue Size 130 cars 17 cars 610 cars
Configuration Changes 1116 162 0
Table 6.2: Adaptive Simulation Results • The complete set of scenarios (one hundred) and their optimum parameter configurations (as explained in the Nearest Scenario Approach in Section 4.4.1). • A significantly smaller set of scenarios created with base in the larger set using the aggregation process (as explained in the Nearest Aggregate Approach in Section 4.4.2). • A set containing a single scenario and its optimum parameter configuration. Figures 6.5, 6.6 and 6.7 show the evolution of the various simulation parameters for each one of the configuration files tested. In each one of these figures three different charts are represented. The top chart shows the traffic volume evolution having two different lines, one for the number of cars arriving at the crossroad (blue) and the other for the number of cars effectively entering the crossroad (red). The middle chart represents the maximum(green) and average(yellow) times, in seconds, cars take to cross the scenario. The maximum time was calculated for every chunk of five minutes while the average time is always calculated from the beginning of the simulation. Finally, the bottom chart represents the number of cars waiting to enter the crossroad in every slot of five minutes. Notice that this last chart uses a very different scale in each one of these Figures due to the different performances of each method. Table 6.2 captures the most important results from each test run. Figure 6.7 shows the evolution of several measurements when a single result from
6.3. Adaptive Simulations
Figure 6.5: Complete Scenario Set Results
Figure 6.6: Clustered Scenario Set Results
84
6.3. Adaptive Simulations
85
Figure 6.7: Single Scenario Set Results the optimization was used. This experiment was solely done in order to have comparison values for the other two tested methods. Table 6.2 shows just how bad using static optimization parameters with dynamic scenarios can be. The method used to choose this single parameter configuration probably did not produce the best possible configuration for this dynamic scenario. However finding a better configuration would reveal rather difficult for several different reasons:
• Using the same optimization methods that were used in the optimization process (discussed in Section 6.1.1), with a dynamic scenario, would be impracticable. In the optimization process each one of these methods executed the simulation 5000 times. Each one of these simulation runs would simulate 5 minutes of traffic. The chosen dynamic scenario simulated a complete day of traffic, taking about 3000 times more to complete, making the process excruciatingly slow. • Even if the the optimizer was used against this particular dynamic scenario it
6.3. Adaptive Simulations
86
would not mean that the selected parameters were the best for every dynamic scenario. Dynamic scenarios are usually unpredictable. • If the optimization process was used against randomized dynamic scenarios it would just increase the stochasticity of the function to be optimized making the optimization process need even more simulation runs to achieve a good result.
Figure 6.5, shows the evolution of several measurements when all the results from the optimization process were used. By using this complete set of results the simulation would always have information about which parameters were best for some very similar scenario. As can be seen in Table 6.2, this method achieved much better results. The third method used to adapt the optimization results to dynamic scenarios, involved clustering the obtained scenarios and their optimum parameter configurations. This step created a smaller, but hopefully still representative, set of scenarios. Figure 6.6 shows the evolution of several measurements using this method. As this method uses a smaller subset of results one would expect fewer changes in the used configuration. In fact Table 6.2 shows exactly that. Using the complete set of results the simulation changed parameters 1116 different times against 162 times using the clustered subset. As less information was available, theoretically the simulation could not adapt as well as in the previous method. However , Table 6.7 shows that using the clustered results did not affect the simulation performance and even made it more efficient. There is a simple reason that explain this, at first glance, awkward behaviour. This happened because constantly changing parameters can lead to a loss in performance. In this particular case each time the parameters changed the timing of the traffic lights would be affected momentarily causing smaller, or longer, traffic light patterns than the optimum ones. In other scenarios the cost of changing parameters could be even higher (e.g. if the simulation had to stop every time the parameters changed).
6.4. Conclusions
6.4
87
Conclusions
In this Chapter the results of applying the optimization system described in Chapter 4 to the simulation introduced in Chapter 5 have been presented. The results have been separated according to the different steps of the process, namely: optimization, clustering and adaptation. Three scenarios have been used, with each one of them presenting different characteristics and difficulties. The optimization algorithms tested have all performed as expected. The Generic Algorithm optimization seems to be best algorithm for this particular scenario and with the parameterizations used. The Simulated Annealing algorithm might have done better with a more careful choice of initial temperatures and temperature scheduling. The aggregation process used obtained very good results as shown by the adaptation tests, where using the clustered results has been more effective than using the complete optimization results.
Chapter 7 Conclusions and Future Work This chapter summarises the work described in this dissertation, proposes areas in which further work is required and draws the final conclusions.
7.1
Summary
Chapter 1 Introduces the field of Simulation Optimization and explains the need of adapting the current simulation optimization algorithms to dynamic scenarios. A brief explanation of how clustering algorithms can be used for this is also given. Chapter 2 Presents the state of the art in the field of Simulation Optimization. Greater emphasis is given to discrete variable simulations. Other type of simulations are also discussed for sake of completeness and for better understanding the differences between these kind of problems. Chapter 3 Presents the state of the art in the field of Clustering. An explanation of the difficulties and terminology used in the area is given. Several algorithms are presented and analyzed. Chapter 4 Introduces the main idea behind this dissertation. The use of clustering techniques to create groups of simulation optimization results, in order to 88
7.2. Future Work
89
reduce the number of different scenarios, is explained. The optimizing system developed to support this thesis is also explained. Chapter 5 Presents the simulation used to validate this thesis results. Other possible scenarios are also discussed. Chapter 6 Describes and analyzes the results of applying clustering techniques to simulation optimization results in the context of dynamic scenarios.
7.2
Future Work
In this section some pointers for possible future work will be presented. These pointers will be organized by topic. Optimization
• The optimization process used in the developed application only used three different optimization methods (four counting the random optimization one). These optimization methods were implemented in their most basic form and none, or almost none, parametrization has been made. Implementing different optimization methods, like the promising Nested Partitions method [Shi 97, Shi 00], in a generic form, could be an interesting research path. • This dissertation focused only in discrete variable optimization problems. Another interesting research area would be to adapt the main idea to continuous variable scenarios. If this path was followed new optimization algorithms had to be implemented. • Some limitations to the simulations that could be optimized by the system had to be implemented for simplicity sake. For example, many simulations have complex constraints over their input variables. These constraints might be given by a mathematical formula or can be a direct result of the simulation process. Adding the possibility of defining these constraints directly into the
7.2. Future Work
90
optimization system or giving the possibility to the simulation to abort in case of a constraint violation would be necessary for a completely generic optimizer. • In this dissertation the approach to multi-objective scenarios has been rather simplistic. The approach has been to use only one of the objective functions. It has also been shown, in Section 2.4, that coping with multi-objective scenarios is not as easy as simply assigning a weight to each different objective function. To adapt the implemented system, in order for it to deal properly with these kind of scenarios, one would have to allow the definition of utility functions for each one of the simulation objectives.
Clustering
• The only clustering method implemented as support for this dissertation has been the K-Means algorithm. Further testing could be done with different clustering algorithms or with variations of the used algorithm. • In this thesis it has been assumed that clusters always have a n-dimensional spherical form. This is not always true. Optimization results can form very different types of clusters like ellipsoids and stripes or even have a completely different formations that can only be defined mathematically. In the later case, clustering algorithms would no longer be useful and other methods had to be studied.
Scenario Adaptation
• The method presented for scenario adaptation is just one of many different possible approaches. Several other methods could be researched. Investigating how simulations that cannot be run in a static scenario (e.g. Robo Soccer Simulated League) and are difficult to assess using small time sections of the simulation, could also prove interesting.
Graphical Analysis
7.3. Conclusions
91
Figure 7.1: Single Variable Graphical Analysis Mock-up • Another interesting development would be to add graphical analysis tools. As simulation have normally multiple variables it would be hard to represent the whole process in a single chart. An alternative would be to show one (see Figure 7.1) or two variables (see Figure 7.2) at a time. With this kind of charts a user could manually add constraints to the simulation and, in that way, direct the optimizer to better solutions more rapidly. Besides aiding the optimization process it would also help the user understanding how variables affect the simulation output. The clustering process could also benefit from this kind of approach.
Other Scenarios
• Finally, testing other scenarios to increase the confidence in the presented algorithms and their advantages should be done.
7.3
Conclusions
Simulations involving complex and dynamic scenarios have poor results when single static configurations are used. One way of coping with this problem is to have a
7.3. Conclusions
92
Figure 7.2: Multi Variable Graphical Analysis Mock-up large set of configurations that will be used in each specific scenario. The problem is that some simulations do not cope well with configuration changes. This can be true either because changing the configuration is expensive or because a period of instability is created when the configuration is changed. In this dissertation, it has been shown that using clustering algorithms to create smaller, but still meaningful, sets of configurations is a method that can be used to minimize the number of possible configuration thus minimizing the number of configuration changes. In the particular simulation tested it has also been shown that using this same method, better results can be achieved. The K-Means clustering algorithm has been shown as an effective clustering algorithm for this particular problem. More complex simulations might require different clustering algorithms. Other tactics to minimize the number of times the configuration is changed have been discussed like, for example, only changing the configuration when the current scenario differed significantly from the last scenario where the configuration has been changed. It has been explained that this alternative can create some other problems, like estimating how much change is needed for a scenario to be significantly different from another. Other problems would exist if two close scenarios needed radically different approaches. Another approach would be to analyze if a
7.3. Conclusions
93
configuration change is needed from time to time. This alternative approach would not work well if the simulation was very dynamic and a quick response was needed when the scenario changes. It has also been shown that it is possible to create a generic optimization platform having simple extension mechanisms. As it is often the case, having generic mechanisms has its advantages, but some flexibility is lost. Some optimization algorithms have been implemented to prove that the platform was extensible. Optimization algorithms are normally very CPU intensive. As in this case it was necessary to optimize the simulation in several different scenarios, the CPU time used was an ever bigger concern. It has been shown that it is possible to develop this kind of platform using distributed processing to minimize the time needed for the optimization process to finish. Final Remarks Most drivers have already noticed how annoying traffic lights can be outside peak hours. Waiting for a long time in a traffic light, when no car is passing in the crossroad, just because the traffic light has a static configuration, is a normal situation for anyone driving later at night. Drivers are also very perceptive about traffic light behaviour and, normally, prefer traffic lights to be predictable, keeping approximately the same pattern. Thus, constant changes in traffic light patterns would confuse most drivers. Besides that, traffic lights cannot change their behaviour abruptly, because during the change, a period with no cars being allowed to pass the crossing would be needed to prevent accidents. Observation of traffic patterns also shows how instable traffic can be. Queues of cars following slower cars are formed quite often, making several cars arrive at the same crossing at the same time. Constantly changing traffic light behaviour because of these fluctuations would disrupt traffic flow instead of helping it become smoother.
7.3. Conclusions
94
This thesis showed how clustering can be used to help optimization algorithms to solve these problems, making traffic lights react to changes in traffic conditions without constant, and unnecessary, changes. Although the simulation used was merely academic, and without any intention to mimic real world traffic patterns, it showed how effective these two methods can work together. The technique used can also be easily applied to other problems having the same characteristics.
Bibliography [Aarts 89]
Emile H. Aarts and Jan Korst. Simulated annealing and boltzmann machines: a stochastic approach to combinatorial optimization and neural computing. N.Y. John Wiley and Sons, New York, NY, USA, 1989.
[Azadivar 92]
Farhad Azadivar. A tutorial on simulation optimization. In WSC ’92: Proceedings of the 24th conference on Winter simulation, pages 198–204, New York, NY, USA, 1992. ACM Press.
[B¨ack 96]
Thomas B¨ack and Hans-Paul Schwefel. Evolutionary computation: An overview. In T. Fukuda, T. Furuhashi and D. B. Fogel, editeurs, Proceedings of 1996 IEEE International Conference on Evolutionary Computation (ICEC ’96), Nagoya, pages 20–29, Piscataway NJ, 1996. IEEE Press.
[Ben-Dor 99]
Amir Ben-Dor, Ron Shamir and Zohar Yakhini. Clustering gene expression patterns. Journal of Computational Biology, vol. 6, no. 3/4, pages 281–297, 1999.
[Biles 74]
William Ernest Biles. A gradient–regression search procedure for simulation experimentation. In WSC ’74: Proceedings of the 7th conference on Winter simulation, pages 491–497, New York, NY, USA, 1974. ACM Press.
[Carson 97]
Yolanda Carson and Anu Maria. Simulation optimization: methods and applications. In WSC ’97: Proceedings of the 29th conference 95
Bibliography
96 on Winter simulation, pages 118–126, New York, NY, USA, 1997. ACM Press.
[Fasulo 99]
Daniel Fasulo. An analysis of recent work on clustering algorithms. Rapport technique 01-03-02, Department of Computer Science and Enginnering, University of Washington, 1999.
[Fayyad 98]
Usama M. Fayyad, Cory Reina and Paul S. Bradley. Initialization of iterative refinement clustering algorithms. In Knowledge Discovery and Data Mining, pages 194–198, 1998.
[Fleischer 95]
Mark Fleischer. Simulated annealing: past, present, and future. In WSC ’95: Proceedings of the 27th conference on Winter simulation, pages 155–161, New York, NY, USA, 1995. ACM Press.
[Fogel 95]
David B. Fogel. Evolutionary computation: toward a new philosophy of machine intelligence. IEEE Press, Piscataway, NJ, USA, 1995.
[Fraley 98]
C. Fraley and A. E. Raftery. How many clusters? Which clustering method? Answers via model-based cluster analysis. The Computer Journal, vol. 41, no. 8, pages 578–588, 1998.
[Fung 01]
Glenn Fung. A comprehensive overview of basic clustering algorithms http://www.cs.wisc.edu/ gfung/, 2001.
[Glover 93]
Fred Glover and Manuel Laguna. Tabu search. John Wiley & Sons, Inc., New York, NY, USA, 1993.
[Glynn 90]
Peter W. Glynn. Likelihood ratio gradient estimation for stochastic systems. Communications of the ACM, vol. 33, no. 10, pages 75–84, 1990.
[Goldsman 94]
David Goldsman and Barry L. Nelson. Ranking, selection and multiple comparisons in computer simulations. In WSC ’94: Proceedings of the 26th conference on Winter simulation, pages 192–199,
Bibliography
97 San Diego, CA, USA, 1994. Society for Computer Simulation International.
[Goldsman 98]
David Goldsman and Barry L. Nelson. Statistical screening, selection, and multiple comparison procedures in computer simulation. In WSC ’98: Proceedings of the 30th conference on Winter simulation, pages 159–166, Los Alamitos, CA, USA, 1998. IEEE Computer Society Press.
[Gowda 91]
K. Chidananda Gowda and E. Diday. Symbolic clustering using a new dissimilarity measure. Pattern Recognition, vol. 24, no. 6, pages 567–578, 1991.
[Holland 75]
John H. Holland. Adaptation in natural and artificial systems. University of Michigan Press, Ann Arbor, 1975.
[Huang 86]
M.D. Huang, F. Romeo and A. Sangiovanni-Vincentelli. An efficient general cooling schedule for Simulated Annealing. IEEE International Conference on Computer Aided Design, pages 381–384, 1986.
[Jain 99]
A. K. Jain, M. N. Murty and P. J. Flynn. Data clustering: a review. ACM Computing Surveys, vol. 31, no. 3, pages 264–323, 1999.
[Kanungo 02]
T. Kanungo, D. Mount, N. Netanyahu, C. Piatko, R. Silverman and A. Wu. A local search approximation algorithm for k-means clustering. In Proceedings of the 18th Annual ACM Symposium on Computational Geometry, pages 10–18, 2002.
[Karkkainen 02] Ismo Karkkainen and Pasi Franti. Dynamic local search for clustering with unknown number of clusters. Internation Conference on Pattern Recognition, vol. 02, page 20240, 2002. [Kirkpatrick 83] S. Kirkpatrick, C. D. Gelatt and M. P. Vecchi. Optimization by simulated annealing. Science, Number 4598, 13 May 1983, vol. 220, 4598, pages 671–680, 1983.
Bibliography
98
[Larra˜ naga 99]
P. Larra˜ naga, C. Kuijpers, R. Murga, I. Inza and S. Dizdarevic. Genetic algorithms for the travelling salesman problem: A review of representations and operators. Articial Intelligence Review, vol. 13, pages 129–170, 1999.
[Luke 02]
Brian T. Luke. K-Means clustering http://fconyx.ncifcrf.gov/ lukeb/kmeans.html, 2002.
[Olafsson 02]
Sigurdur Olafsson and Jumi Kim. Simulation optimization: simulation optimization. In WSC ’02: Proceedings of the 34th conference on Winter simulation, pages 79–84. Winter Simulation Conference, 2002.
[Pal 95]
Nikhil R. Pal and James C. Bezdek. On cluster validity for the fuzzy c-Means model. IEEE Transactions on Fuzzy Systems, vol. 3, no. 3, pages 370–379, August 1995.
[Pierreval 00]
Henri Pierreval and Jean-Luc Paris. Distributed evolutionary algorithms for simulation optimization. IEEE Transactions on Systems, Man and Cybernetics, vol. 30, no. 1, January 2000.
[Reis 02]
Lu´ıs Paulo Reis and Nuno Lau. Coach Unilang - A standard language for coaching a (Robo)Soccer team. In RoboCup 2001: Robot Soccer World Cup V, pages 183–192, London, UK, 2002. SpringerVerlag.
[Reis 03]
Lu´ıs Paulo Reis.
Coordena¸ca ˜o em Sistemas Multi-Agente:
Aplica¸co ˜es na Gest˜ ao Universit´ aria e Futebol Rob´ otico. PhD thesis, Faculdade de Engenharia da Universidade do Porto, June 2003. [Rich 90]
Elaine Rich and Kevin Knight. Artificial intelligence. McGraw-Hill Higher Education, 1990.
[Rob 06]
RoboCup 2006.
International Homepage
(http://www.robocup.org/),
Bibliography [Rose 90]
99 Kenneth Rose, Eitan Gurewitz and Geoffrey C. Fox. Statistical mechanics and phase transitions in clustering. Physical Review Letters, vol. 65, no. 8, pages 945–948, Aug 1990.
[Russell 02]
Stuart Russell and Peter Norvig. Artificial intelligence: A modern approach. Prentice Hall, 2002.
[Shi 97]
Leyuan Shi and Sigurdur Olafsson. An integrated framework for deterministic and stochastic optimization. In WSC ’97: Proceedings of the 29th conference on Winter simulation, pages 358–365, New York, NY, USA, 1997. ACM Press.
[Shi 00]
Leyuan Shi and Sigurdur Olafsson. Nested partitions method for global optimization. Operations Research, vol. 48, no. 3, pages 390– 407, 2000.
[Spears 93]
W. M. Spears, K. A. De Jong, T. B¨ack, D. B. Fogel and H. de Garis. An Overview of evolutionary computation. In Pavel B. Brazdil, editeur, Proceedings of the European Conference on Machine Learning (ECML-93), volume 667, pages 442–459, Vienna, Austria, 1993. Springer Verlag.
[Swisher 00]
J. Swisher, P. Hyden, S. Jacobson and L. Scruben. A survey of simulation optimization techniques and procedures. In K. Kang J.A. Joines R.R. Barton and P.A. Fishwick, editeurs, Proceedings of the 2000 Winter Simulation Conference, 2000.
[Treiber 00]
Martin Treiber, Ansgar Hennecke and Dirk Helbing. Congested traffic states in empirical observations and microscopic simulations. Physical Review E, vol. 62, page 1805, 2000.
Appendix A Scenario Optimization Results The following table contains the complete set of results obtained by optimizing the Traffic Control simulation in a series of random scenarios. Each line represents a different scenario with the first 8 columns containing the best found parameters for that scenario. The remaining columns contain the scenario variables (east, south, north and west bound traffic) and the scenario output results (average and maximum time in city and maximum car pressure). Table A.1: Scenario Optimization Results
g.0.0
g.0.1
g.1.0
g.1.1
d.0.1
d.1.0
d.1.1
cyc
w
s
e
n
avg
max
prs
5
5
5
5
8
7
5
13
22.0
22.0
13.0
21.0
44.344
71.555
476
4
3
3
3
6
3
0
13
13.0
26.0
13.0
13.0
37.914
69.942
0
5
5
5
5
8
6
3
12
17.0
11.0
9.0
12.0
26.625
49
2
3
4
3
4
3
4
2
12
27.0
39.0
7.0
5.0
71.976
147.511
2228
8
7
8
8
5
1
5
10
30.0
9.0
32.0
6.0
47.504
83.525
1686
7
7
6
7
6
4
2
14
20.0
17.0
30.0
6.0
48.875
92.217
1078
5
5
5
5
3
3
6
11
7.0
31.0
31.0
15.0
58.81
128.177
2132
6
6
6
5
6
2
8
14
29.0
8.0
7.0
24.0
54.909
105.007
1314
5
5
5
5
9
6
2
13
21.0
15.0
32.0
32.0
60.858
133.389
2650
4
5
4
5
8
5
2
14
38.0
39.0
22.0
34.0
88.018
174.786
4668
100
Chapter A. Scenario Optimization Results
101
g.0.0
g.0.1
g.1.0
g.1.1
d.0.1
d.1.0
d.1.1
cyc
w
s
e
n
avg
max
prs
3
3
3
3
3
1
0
16
21.0
33.0
20.0
39.0
76.275
132.808
2674
4
4
4
4
9
6
5
12
8.0
36.0
29.0
24.0
64.731
141.077
2618
5
5
5
5
7
3
7
11
9.0
16.0
22.0
19.0
36.115
64.604
284
3
4
3
4
1
4
2
20
19.0
31.0
19.0
17.0
57.696
106.518
1578
5
6
6
6
1
2
2
11
12.0
33.0
37.0
26.0
78
154.603
3090
6
6
5
5
7
2
2
12
28.0
7.0
26.0
25.0
60.482
103.94
2558
4
6
5
5
5
3
6
14
9.0
5.0
12.0
13.0
25.971
48.6
0
4
4
4
3
6
6
2
10
18.0
15.0
15.0
27.0
44.541
80.574
410
6
6
6
6
6
0
3
15
27.0
28.0
35.0
19.0
69.495
131.446
3406
4
4
4
4
3
3
9
11
9.0
8.0
25.0
32.0
56.732
113.458
1532
6
5
6
6
5
4
8
12
31.0
27.0
32.0
27.0
76.076
124.996
4212
4
4
4
4
3
1
9
10
26.0
31.0
18.0
33.0
67.131
124.25
2088
5
5
5
5
5
6
1
12
22.0
26.0
26.0
9.0
54.038
102.146
1690
4
4
4
4
3
0
3
10
13.0
24.0
6.0
19.0
34.541
57.015
0
5
5
5
5
8
5
5
13
5.0
12.0
15.0
12.0
26.599
48.8
0
4
4
4
4
1
4
3
17
30.0
15.0
8.0
35.0
63.704
140.294
2522
4
4
4
4
9
1
4
10
9.0
33.0
33.0
39.0
81.138
157.98
3124
4
4
4
4
4
4
9
10
15.0
22.0
25.0
29.0
51.704
104.035
1440
3
3
3
3
0
4
5
13
24.0
36.0
8.0
11.0
61.964
130.038
1936
6
6
6
6
4
1
4
14
32.0
25.0
16.0
21.0
60.982
111.975
1742
3
3
4
4
2
6
5
14
6.0
19.0
27.0
36.0
60.246
139.977
2478
6
5
6
5
0
7
6
13
10.0
5.0
15.0
11.0
25.179
47.8
0
3
3
4
3
3
6
8
12
13.0
20.0
22.0
33.0
54.495
115.228
1538
7
7
7
6
5
2
8
10
36.0
27.0
38.0
6.0
77.583
142.926
5144
7
7
7
7
7
1
6
13
12.0
22.0
36.0
11.0
58.123
120.213
2042
4
4
4
4
3
8
6
12
26.0
6.0
23.0
34.0
68.615
122.867
3106
6
5
5
6
3
0
5
11
37.0
33.0
22.0
26.0
78.918
157.633
3522
7
6
7
7
6
8
4
12
21.0
9.0
25.0
11.0
35.042
57.6
234
6
6
6
6
7
6
0
10
39.0
28.0
16.0
34.0
78.972
162.555
3464
Chapter A. Scenario Optimization Results
102
g.0.0
g.0.1
g.1.0
g.1.1
d.0.1
d.1.0
d.1.1
cyc
w
s
e
n
avg
max
prs
7
7
7
7
3
4
6
10
13.0
11.0
29.0
8.0
38.044
73.714
698
5
5
5
5
7
2
5
13
36.0
33.0
22.0
35.0
82.146
158.079
3682
6
6
6
6
9
6
6
11
14.0
11.0
39.0
30.0
65.476
152.965
3206
6
6
6
6
0
1
6
11
21.0
20.0
28.0
11.0
46.137
94.018
1120
5
5
5
5
4
7
1
15
21.0
15.0
30.0
29.0
60.126
123.232
2484
5
5
5
5
0
5
4
12
37.0
8.0
37.0
36.0
88.163
162.333
6628
4
4
4
4
6
4
5
11
8.0
21.0
6.0
21.0
32.284
48.4
0
3
3
3
3
9
6
3
13
23.0
35.0
5.0
31.0
68.041
121.191
1570
4
4
4
4
0
7
0
11
27.0
7.0
18.0
34.0
67.994
127.96
2404
5
4
5
5
1
9
1
13
25.0
12.0
20.0
28.0
57.61
106.218
1604
2
2
2
2
0
1
4
13
13.0
10.0
8.0
36.0
53.158
104.907
358
7
7
6
7
5
2
6
12
39.0
5.0
13.0
27.0
67.91
146.067
2868
3
4
4
4
7
1
5
11
5.0
25.0
17.0
26.0
49.368
80.29
316
3
3
3
3
0
8
8
21
13.0
36.0
18.0
29.0
59.279
114.346
950
4
3
3
3
0
1
1
14
12.0
29.0
11.0
26.0
44.592
74.406
0
5
5
5
5
2
4
5
13
7.0
19.0
21.0
19.0
39.921
61.337
108
7
7
7
7
0
0
0
13
16.0
9.0
29.0
13.0
39.685
75.169
572
5
5
5
5
6
6
2
12
21.0
19.0
14.0
6.0
33.884
56.242
74
4
5
5
5
3
6
0
12
7.0
31.0
30.0
18.0
59.733
128.898
2204
6
6
6
6
3
2
8
11
31.0
25.0
5.0
20.0
63.569
110.479
1714
5
5
5
6
4
0
3
16
26.0
9.0
27.0
24.0
60.955
106.243
2410
7
7
7
7
6
3
8
12
37.0
5.0
20.0
22.0
59.485
128.22
2244
3
3
3
3
7
7
7
13
16.0
33.0
7.0
24.0
49.887
96.566
540
7
8
8
8
3
2
9
16
8.0
5.0
33.0
10.0
47.477
87.774
1186
7
7
6
6
4
1
5
20
27.0
10.0
12.0
13.0
38.038
68.158
464
3
3
3
3
1
5
9
12
18.0
17.0
6.0
37.0
53.457
117.982
890
3
3
3
3
1
1
1
14
24.0
39.0
14.0
26.0
65.264
138.693
2060
7
7
7
6
1
0
5
10
31.0
5.0
30.0
19.0
61.047
101.526
2642
3
3
3
3
3
5
7
14
16.0
33.0
19.0
37.0
70.373
122.938
1438
Chapter A. Scenario Optimization Results
103
g.0.0
g.0.1
g.1.0
g.1.1
d.0.1
d.1.0
d.1.1
cyc
w
s
e
n
avg
max
prs
7
7
7
7
7
1
6
12
32.0
13.0
17.0
12.0
42.61
94.769
1294
6
5
6
6
4
3
7
12
13.0
27.0
31.0
24.0
63.555
118.804
1978
5
5
6
5
9
3
7
13
36.0
24.0
36.0
34.0
86.611
157.243
6084
6
6
6
6
3
7
4
12
5.0
19.0
37.0
26.0
69.77
139.821
2686
6
6
7
7
7
6
0
10
36.0
26.0
17.0
23.0
68.239
138.891
2526
6
6
6
6
3
4
5
17
37.0
14.0
15.0
31.0
67.12
148.8
2884
4
5
5
4
2
8
7
16
19.0
26.0
27.0
29.0
66.078
118.347
2180
6
5
6
6
4
5
9
10
7.0
5.0
19.0
9.0
25.841
45.7
0
5
5
5
5
0
9
8
10
37.0
16.0
18.0
34.0
66.813
154.477
3280
6
6
6
6
3
7
1
10
22.0
14.0
19.0
7.0
31.584
52.394
40
5
6
5
5
2
4
4
11
14.0
21.0
34.0
31.0
65.654
137.172
2690
5
5
6
6
5
6
9
13
38.0
36.0
35.0
22.0
86.248
164.099
6326
2
2
2
2
2
6
7
17
14.0
33.0
12.0
39.0
63.535
111.979
792
3
3
3
3
2
1
3
14
7.0
6.0
18.0
33.0
55.293
97.564
714
5
5
5
6
7
6
9
11
18.0
16.0
36.0
32.0
61.149
146.976
2900
5
5
5
5
8
4
1
14
28.0
29.0
17.0
13.0
54.663
115.437
1844
5
5
5
5
2
0
6
13
18.0
16.0
30.0
30.0
56.485
125.076
1932
5
5
5
5
3
3
8
11
25.0
24.0
24.0
25.0
60.25
92.746
1928
5
5
5
5
7
4
9
10
23.0
24.0
35.0
34.0
74.817
144.744
3762
7
7
7
7
2
2
1
11
20.0
14.0
28.0
11.0
40.513
72.113
484
5
5
5
5
4
3
6
13
23.0
23.0
19.0
11.0
43.473
77.106
654
6
5
5
5
3
3
3
11
38.0
36.0
9.0
9.0
75.871
166.074
3556
3
3
3
3
4
1
4
12
18.0
30.0
11.0
36.0
65.826
113.344
902
6
6
6
6
5
1
6
16
39.0
5.0
6.0
31.0
76.621
155.404
2924
6
5
6
6
4
9
3
16
14.0
14.0
20.0
15.0
33.174
56.085
42
3
3
2
2
2
5
9
14
14.0
22.0
5.0
36.0
49.786
104.536
462
Appendix B Scenario Aggregation Results The following table contains the set of results obtained by aggregating the optimization results listed in Appendix A. Each line represents a different scenario with the first 8 columns containing the best found parameters for that scenario. The remaining columns contain the scenario variables (east, south, north and west bound traffic) and the scenario output results (average and maximum time in city and maximum car pressure). Table B.1: Scenario Aggregation Results
g.0.0
g.0.1
g.1.0
g.1.1
d.0.1
d.1.0
d.1.1
cyc
w
s
e
n
avg
max
prs
3
3
3
3
2
1
3
14
7.0
6.0
18.0
33.0
55.293
97.564
714
3
3
4
3
3
6
8
12
13.0
20.0
22.0
33.0
54.495
115.228
1538
7
8
8
8
3
2
9
16
8.0
5.0
33.0
10.0
47.477
87.774
1186
7
6
7
7
6
8
4
12
21.0
9.0
25.0
11.0
35.042
57.6
234
4
4
4
4
1
4
3
17
30.0
15.0
8.0
35.0
63.704
140.294
2522
5
5
5
5
8
6
3
12
17.0
11.0
9.0
12.0
26.625
49
2
5
5
5
5
0
5
4
12
37.0
8.0
37.0
36.0
88.163
162.333
6628
6
5
6
6
4
3
7
12
13.0
27.0
31.0
24.0
63.555
118.804
1978
104
Appendix C Code Listings
C.1
Hill Climber Optimizer
A simplified version of the implemented Hill Climber Optimizer can be seen in the following code listings. Listing C.1 shows the method that starts the optimization process by creating random initial workloads and sending them to the evaluator. Listing C.1: Hill Climbing Optimizer (start) public void o p t i m i z e ( ) { WLGenerator g e n e r a t o r = new WLRandomGenerator ( ) ; C o l l e c t i o n wklds = g e n e r a t o r . g e n e r a t e ( 1 0 , this , g e t P r o j e c t ( ) ) ; e v a l u a t o r . setWorkload ( wklds ) ; evaluator . addEvaluationListener ( this ) ; evaluator . start () ; }
Every time the evaluator finishes processing workloads the method shown in Listing C.2 is invoked. In this method processed workloads are analyzed and new workloads are sent to the evaluator. 105
C.1. Hill Climber Optimizer Listing C.2: Hill Climbing (iteration) public void e v a l u a t i o n F i n i s h e d ( ) { Iterator i t = evaluator . finishedWorkloadIterator () ; boolean improved = f a l s e ; // I t e r a t e o v e r t h e f i n i s h e d w o r k l o a d s while ( i t . hasNext ( ) ) { Workload wl = ( Workload ) i t . next ( ) ; double r e s u l t = wl . g e t R e s u l t V a l u e ( ) ; // Compare f i n i s h e d w o r k l o a d w i t h c u r r e n t // w o r k l o a d . i f ( r e s u l t < getBestValue ( ) ) { setBestWorkload ( wl ) ; s e t B e s t V a l u e ( wl . g e t R e s u l t V a l u e ( ) ) ; } // Compare f i n i s h e d w o r k l o a d w i t h c u r r e n t // w o r k l o a d i f ( r e s u l t < getCurrentValue ( ) | | Math . random ( ) < prob ) ) { setCurrentWorkload ( wl ) ; s e t C u r r e n t V a l u e ( wl . g e t R e s u l t V a l u e ( g ) ) ; improved = true ; } // Update t h e c u r r e n t t e m p e r a t u r e v a l u e ; i f ( temp−a l f a >=0) temp −= a l f a ; e l s e temp = 0 ; } // I f improved c o n t i n u e from t h e c u r r e n t w o r k l o a d // n e i g h b o u r s . E l s e c r e a t e new random w o r k l o a d s . WLGenerator g e n e r a t o r ; i f ( improved ) g e n e r a t o r = new WLNeighbourhoodGenerator ( ) ;
106
C.2. Simulated Annealing Optimizer
107
e l s e g e n e r a t o r = new WLRandomGenerator ( ) ; C o l l e c t i o n wklds = g e n e r a t o r . g e n e r a t e ( 1 0 , this , g e t P r o j e c t ( ) ) ; i f ( ! improved ) setCurrentWorkload ( null ) ; e v a l u a t o r . setWorkload ( wklds ) ;
// Send new w o r k l o a d s t o t h e e v a l u a t o r . evaluator . start () ; }
C.2
Simulated Annealing Optimizer
A simplified version of the implemented Simulated Annealing Optimizer can be seen in the following code listings. Listing C.3 shows the method that starts the optimization process by creating random initial workloads and sending them to the evaluator. Listing C.3: Simulated Annealing (start) public void o p t i m i z e ( ) { WLGenerator g e n e r a t o r = new WLRandomGenerator ( ) ; C o l l e c t i o n wklds = g e n e r a t o r . g e n e r a t e ( 1 0 , this , g e t P r o j e c t ( ) ) ; e v a l u a t o r . setWorkload ( wklds ) ; evaluator . addEvaluationListener ( this ) ; evaluator . start () ; }
Every time the evaluator finishes processing workloads the method shown in Listing C.3 is invoked. In this method processed workloads are analyzed and new workloads are sent to the evaluator. Listing C.4: Simulated Annealing (iteration)
C.2. Simulated Annealing Optimizer public void e v a l u a t i o n F i n i s h e d ( ) { Iterator i t = evaluator . finishedWorkloadIterator () ; boolean changed = f a l s e ; // I t e r a t e o v e r t h e f i n i s h e d w o r k l o a d s while ( i t . hasNext ( ) ) { Workload wl = ( Workload ) i t . next ( ) ; double r e s u l t = wl . g e t R e s u l t V a l u e ( ) ; // Compare f i n i s h e d w o r k l o a d w i t h c u r r e n t // w o r k l o a d . i f ( r e s u l t < getBestValue ( ) ) { setBestWorkload ( wl ) ; s e t B e s t V a l u e ( wl . g e t R e s u l t V a l u e ( ) ) ; } // Compare f i n i s h e d w o r k l o a d w i t h c u r r e n t w o r k l o a d // I f b e t t e r or i f a random v a l u e i s l o w e r t h a t // t h e c u r r e n t a c c e p t a n c e p r o b a b i l i t y a c c e p t // t h i s s o l u t i o n as t h e c u r r e n t w o r k l o a d . double d e l t a f = r e s u l t − g e t B e s t V a l u e ( ) ; double prob = Math . exp(− d e l t a f /temp ) ; i f ( r e s u l t < getCurrentValue ( ) | | Math . random ( ) < prob ) ) { setCurrentWorkload ( wl ) ; s e t C u r r e n t V a l u e ( wl . g e t R e s u l t V a l u e ( g ) ) ; changed = true ; } // Update t h e c u r r e n t t e m p e r a t u r e v a l u e ; i f ( temp−a l f a >=0) temp −= a l f a ; e l s e temp = 0 ; } // I f c u r r e n t w o r k l o a d changed have improved c o n t i n u e
108
C.3. Genetic Algorithm Optimizer
109
// from t h e c u r r e n t w o r k l o a d n e i g h b o u r s . E l s e c r e a t e // new random w o r k l o a d s . WLGenerator g e n e r a t o r ; i f ( improved ) g e n e r a t o r = new WLNeighbourhoodGenerator ( ) ; e l s e g e n e r a t o r = new WLRandomGenerator ( ) ; C o l l e c t i o n wklds = g e n e r a t o r . g e n e r a t e ( 1 0 , this , g e t P r o j e c t ( ) ) ; i f ( ! improved ) setCurrentWorkload ( null ) ; e v a l u a t o r . setWorkload ( wklds ) ;
// Send new w o r k l o a d s t o t h e e v a l u a t o r . evaluator . start () ; }
C.3
Genetic Algorithm Optimizer
A simplified version of the implemented Genetic Algorithm Optimizer can be seen in the following code listings. Listing C.3 shows the method that starts the optimization process by creating random initial workloads and sending them to the evaluator. Listing C.5: Genetic Algorithm (start) public void o p t i m i z e ( ) { WLGenerator g e n e r a t o r = new WLRandomGenerator ( ) ; e v a l u a t o r . shutdown ( ) ; evaluator . addEvaluationListener ( this ) ; Collection population = generator . generate ( generationSize , this , g e t P r o j e c t ( ) ) ; e v a l u a t o r . setWorkload ( p o p u l a t i o n ) ; evaluator . start () ; }
C.3. Genetic Algorithm Optimizer
110
Listing C.6: Genetic Algorithm (iteration) public void e v a l u a t i o n F i n i s h e d ( ) { Iterator i t = evaluator . finishedWorkloadIterator () ;
Vector s u r v i v o r s = new Vector ( ) ; double b e s t = Double . MIN VALUE, worst = Double .MAX VALUE;
boolean improved = f a l s e ; while ( i t . hasNext ( ) ) { Workload wl = ( Workload ) i t . next ( ) ; double r e s u l t = wl . g e t R e s u l t V a l u e ( g e t P r o j e c t ( ) . getPrimaryResult ( ) ) ;
i f ( r e s u l t > best ) best = r e s u l t ; i f ( r e s u l t < worst ) worst = r e s u l t ;
i f ( getBestWorkload ( )==null | | r e s u l t < g e t B e s t V a l u e ( ) ) { setBestValue ( r e s u l t ) ; setBestWorkload ( wl ) ; improved
= true ;
} } i t = evaluator . finishedWorkloadIterator () ;
while ( i t . hasNext ( ) ) { Workload wl = ( Workload ) i t . next ( ) ; double r e s u l t = wl . g e t R e s u l t V a l u e ( g e t P r o j e c t ( ) . getPrimaryResult ( ) ) ;
i f ( Math . random ( ) ∗( best −worst ) > ( r e s u l t − worst ) ) s u r v i v o r s . add ( wl ) ;
C.3. Genetic Algorithm Optimizer
111
} i f ( m a x I t e r a t i o n s !=−1 && e v a l u a t o r . getTotalRuns ( )> maxIterations ){ optimizationFinished () ; return ; } evaluator . reset () ; WLOffspringGenerator g e n e r a t o r = new WLOffspringGenerator ( ) ;
C o l l e c t i o n wklds = g e n e r a t o r . g e n e r a t e ( g e n e r a t i o n S i z e , this , getProject () , survivors ) ;
e v a l u a t o r . setWorkload ( wklds ) ; evaluator . start () ; }
Listing C.7: Genetic Algorithm (generator) public c l a s s WLOffspringGenerator extends WLGenerator { Random random = new Random ( ) ;
public C o l l e c t i o n g e n e r a t e ( int num, Optimizer o p t i m i z e r , Project project ) { return null ; } public C o l l e c t i o n g e n e r a t e ( int num, Optimizer o p t i m i z e r , P r o j e c t p r o j e c t , Vector s u r v i v o r s ) { Vector newpop = new Vector ( ) ;
C.3. Genetic Algorithm Optimizer
112
for ( int o = 0 ; o < num ; o++) { Workload w1 = getRandomWorkload ( s u r v i v o r s ) ; Workload w2 = getRandomWorkload ( s u r v i v o r s ) ;
Workload w3 = c r o s s o v e r ( w1 , w2 ) ;
newpop . add ( w3) ; } I t e r a t o r i t = newpop . i t e r a t o r ( ) ; while ( i t . hasNext ( ) ) { Workload wl = ( Workload ) i t . next ( ) ; I t e r a t o r p v i t = wl . p a r a m e t e r V a l u e I t e r a t o r ( ) ; boolean ok = true ; while ( p v i t . hasNext ( ) ) { ParameterValue pv = ( ParameterValue ) p v i t . next ( ) ; i f ( pv . getValue ( )pv . getParameter ( ) . getMaxvalue ( ) ) { ok = f a l s e ; break ; } } i f ( ! ok ) i t . remove ( ) ; } return newpop ; }
C.3. Genetic Algorithm Optimizer
113
private Workload crossoverAndMutation ( Workload w1 , Workload w2 ) { I t e r a t o r i t = w1 . g e t O p t i m i z e r ( ) . g e t P r o j e c t ( ) . parameterIterator () ; Workload wl = new Workload ( ) ; wl . s e t O p t i m i z e r (w1 . g e t O p t i m i z e r ( ) ) ; wl . setNumberRemainingRuns ( w1 . g e t O p t i m i z e r ( ) . getNumberRunsPerWorkload ( ) ) ;
while ( i t . hasNext ( ) ) { Parameter p = ( Parameter ) i t . next ( ) ; int v a l u e ; i f ( Math . random ( ) < 0 . 5 ) value =
w1 . getParameterValue ( p ) ;
else v a l u e = w2 . getParameterValue ( p ) ;
i f ( Math . random ( ) < 0 . 1 ) i f ( Math . random ( ) < 0 . 5 ) v a l u e++; e l s e value −−; wl . addParameterValue (new ParameterValue ( p , v a l u e ) ) ; } return wl ; } private Workload getRandomWorkload( Vector workloads ) { return ( Workload ) workloads . elementAt ( random . n e x t I n t ( workloads . s i z e ( ) ) ) ; } }
C.4. K-Means Algorithm
114
Every time the evaluator finishes processing workloads the method shown in Listing C.3 is invoked. In this method processed workloads are analyzed and new workloads are sent to the evaluator.
C.4
K-Means Algorithm Listing C.8: K-Means Clustering Algorithm
public Vector c r e a t e C l u s t e r s ( Vector workloads ) throws Exception { i f ( ! evaluator . i s I n i t i a l i z e d () ) evaluator . i n i t i a l i z e ( workloads ) ; Vector wklds = ( Vector ) workloads . c l o n e ( ) ;
Vector c l u s t e r s = new Vector ( ) ;
for ( int c = 0 ; c < clusterNum ; c++){ C l u s t e r c l = new C l u s t e r ( ) ; Workload c e n t r o i d = new Workload ( ) ;
Workload base = ( Workload ) wklds . elementAt ( 0 ) ; I t e r a t o r i t = base . p a r a m e t e r V a l u e I t e r a t o r ( ) ; while ( i t . hasNext ( ) ) { ParameterValue pv = ( ParameterValue ) i t . next ( ) ; Parameter p = pv . getParameter ( ) ; ParameterValue npv = new ParameterValue ( p , random . n e x t I n t ( p . getMaxvalue ( )−p . getMinvalue ( ) )+p . getMinvalue ( ) ) ; c e n t r o i d . addParameterValue ( npv ) ; } cl . setCentroid ( centroid ) ; c l u s t e r s . add ( c l ) ;
C.4. K-Means Algorithm } while ( wklds . s i z e ( ) >0){ Workload w = getRandomWorkload( wklds ) ; Iterator it = clusters . iterator () ; double minDistance = Double .MAX VALUE; C l u s t e r c l o s e s t C l u s t e r = null ; while ( i t . hasNext ( ) ) { C l u s t e r c = ( C l u s t e r ) i t . next ( ) ; double d i s t a n c e = e v a l u a t o r . e v a l u a t e D i s t a n c e (w, c ) ; i f ( d i s t a n c e < minDistance ) { minDistance = d i s t a n c e ; closestCluster = c ; } } c l o s e s t C l u s t e r . addWorkload (w) ; } return c l u s t e r s ; }
115