Atmos. Meas. Tech., 3, 1569–1576, 2010 www.atmos-meas-tech.net/3/1569/2010/ doi:10.5194/amt-3-1569-2010 © Author(s) 2010. CC Attribution 3.0 License.
Atmospheric Measurement Techniques
Dynamic Solution Injection: a new method for preparing pptv–ppbv standard atmospheres of volatile organic compounds K. J. Jardine1 , W. M. Henderson1 , T. E. Huxman2 , and L. Abrell3 1 University
of Arizona-Biosphere 2, 32540 S. Biosphere Road, Oracle, AZ 85623, USA of Arizona, Department of Ecology and Evolutionary Biology, P.O. Box 210088, Tucson, Arizona, 85721, USA 3 University of Arizona, Departments of Chemistry & Biochemistry and Soil, Water & Environmental Science, P.O. Box 210038, Tucson, Arizona, 85721-0038, USA 2 University
Received: 22 June 2010 – Published in Atmos. Meas. Tech. Discuss.: 21 July 2010 Revised: 3 November 2010 – Accepted: 5 November 2010 – Published: 16 November 2010
Abstract. Proton Transfer Reaction-Mass Spectrometry (PTR-MS) and thermal desorption Gas ChromatographyMass Spectrometry (GC-MS) allow for absolute quantification of a wide range of atmospheric volatile organic compounds (VOCs) with concentrations in the ppbv to pptv range. Although often neglected, routine calibration is necessary for accurate quantification of VOCs by PTR-MS and GC-MS. Several gas calibration methods currently exist, including compressed gas cylinders, permeation tubes, diffusion tubes, and liquid injection. While each method has its advantages and limitations, no single technique has emerged that is capable of dynamically generating known concentrations of complex mixtures of VOCs over a large concentration range (ppbv to pptv) and is technically simple, field portable, and affordable. We present the development of a new VOC calibration technique based on liquid injection with these features termed Dynamic Solution Injection (DSI). This method consists of injecting VOCs (0.1–0.5 mM) dissolved in cyclohexane (PTR-MS) or methanol (GC-MS) into a 1.0 slpm flow of purified dilution gas in an unheated 25 ml glass vial. Upon changes in the injection flow rate (0.5– 4.0 µl min−1 ), new VOC concentrations are reached within seconds to minutes, depending on the compound, with a liquid injection flow rate accuracy and precision of better than 7% and 4% respectively. We demonstrate the utility of the DSI technique by calibrating a PTR-MS to seven different cyclohexane solutions containing a total of 34 different biogenic compounds including volatile isoprenoids, oxygenated VOCs, fatty acid oxidation products, aromatics, and dimethyl sulfide. We conclude that because of its small size, low cost, Correspondence to: K. J. Jardine (
[email protected])
and simplicity, the Dynamic Solution Injection method will be of great use to both laboratory and field VOC studies. 1
Introduction
Measurements of gas-phase volatile organic compound (VOC) concentrations are critical for studying fundamental physical, chemical, and biological processes occurring in the atmosphere. However, this poses a technical challenge because the species of interest are usually present in very trace quantities and an extremely sensitive instrument is required to directly measure them. While a few high sensitivity VOC sensors are currently available, the number of recognized important atmospheric species continues to increase (Goldstein and Galbally, 2009). With current calibration techniques, our ability to accurately identify and quantify these species is limited, especially during remote field campaigns where a small portable calibration system is needed. Standard gas mixtures can be made by two fundamental methods; static and dynamic (Barratt, 1981). Preparation of static ppbv concentrations of gas-phase VOCs has been achieved volumetrically by evaporating small volumes (5– 10 µL) of dilute VOC solutions in a gas sample bag filled with a known volume of clean air (Bouvier-Brown et al., 2007) and gravimetrically by evaporating known masses of VOCs and diluting to desired concentration with a known mass of N2 in gas cylinders (Apel et al., 1998). The static method has been successfully used to generate VOC standards of nonpolar compounds with vapor pressures higher than undecane, with high accuracy and stability in gas cylinders (Rappengluck et al., 2006). Unfortunately, a major disadvantage of using static methods for the preparation of polar or low vapor pressure VOC standards is the absorptive losses
Published by Copernicus Publications on behalf of the European Geosciences Union.
1570
K. J. Jardine et al.: A new method for preparing pptv–ppbv standard atmospheres of volatile organic compounds
on surfaces like bags and gas cylinder walls. This loss is difficult to account for. In the dynamic mode of VOC standard generation, compounds are continuously introduced into purified dilution gas and the mixture is then homogenized. Pure dynamic methods minimize wall effects, allow rapid variations in concentration, and enable the generation of standards when needed. VOC standards prepared dynamically have been achieved by passing a dilution gas flow over permeation (Spinhirne and Koziel, 2003; Mitchell, 2000; Cardoso et al., 1996; Jakoubkova et al., 1986; Teckentrup and Klockow, 1978; Godin and Boudene, 1978) or diffusion (Thompson and Perry, 2009; Helmig et al., 2003; Komenda et al., 2001) tubes in temperature-controlled ovens. However, these methods often suffer from long and tedious gravimetric calibration periods where permeation rates are determined by a change in mass over time (weeks for diffusion tubes, months for permeation tubes), the limited commercial availability of compounds (permeation tubes), and their associated high prices (typically $200–$1000 for a single permeation tube). Other disadvantages are the need to accurately and precisely control the permeation chamber temperature, degradation of reactive VOCs with time (hydrolysis, hydration, oxidation, polymerization, etc.), changes in the permeation characteristics of the diffusion membranes over time (permeation tubes), and difficulties preparing complex mixtures of VOCs (each permeation tube is often certified at a different temperature). To avoid some of these disadvantages, liquid injection techniques have been developed for the generation of VOC standard atmospheres. In this technique, liquid VOC standards are directly injected at a known rate into a dilution air or N2 stream. The key assumption of this approach is that the evaporation of the liquid standard into the air stream is complete, which is then homogenized in a mixing chamber. Previous configurations have suffered from complicated designs with liquid VOCs sprayed into heated air warmed by air/gas combustion (Jaouen et al., 1995). Improvements to this technique were made when a stepper-motor driven syringe was used to inject pure liquids into a dilution gas flow (Rosenberg et al., 2001). While simpler than previous designs, this system lacks the ability of continuous operation (due to the need of a syringe-fill cycle) and requires a heated liquid injection manifold (to promote evaporation of liquid standard) and a separate mixing chamber. More recently, a PTR-MS was calibrated by manually injecting 1.0 µL of dilute VOC solutions in dodecane into a glass vial continuously flushed with clean air (Hanson et al., 2009). Calibration factors for the PTR-MS were determined using the air flow rate through the chamber and the integrated signal peaks corresponding to the evaporation of each VOC. However, due to the rapid injection of a single volume of VOC solution, this method is unable to produce constant VOC concentrations that can be dynamically changed.
Atmos. Meas. Tech., 3, 1569–1576, 2010
In this paper, we present the development of a new simplified calibration system termed dynamic solution injection (DSI) based on a stepper motor controlled syringeless pump capable of delivering continuous liquid flow rates with values spanning six orders of magnitude (nL/min to mL/min). This system combines the injection and mixing chamber into a single glass vial, eliminates the need for heating the injection manifold by utilizing VOC solutions in solvents with high vapor pressure (methanol or cyclohexane), and expands the calibration of PTR-MS and GC-MS to a much larger range of VOCs. 2 2.1
Materials and methods Dynamic Solution Injection (DSI) system
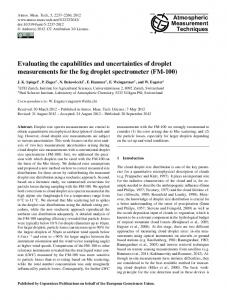
The experimental setup of the Dynamic Solution Injection system (DSI) is shown in Figure 1 and consists of a liquid pump, a calibration solution vial, a mixing vial, and Teflon (PFA) tubing and fittings. A syringe-free stepper motor driven pump (M6 liquid handling pump, Valco Instruments Co., Inc) was used to control the injection flow rate of a calibration liquid solution into a mixing vial. The M6 pump was controlled with the included PC software (M6LHS). While not employed here, this software also provides the capability of controlling a liquid sampling valve for the automated selection of one of multiple calibration solutions as well as allowing for the development of a liquid flow rate method in which flow rates can be automatically changed over time. Approximately 20 ml of a liquid standard calibration solution was placed in a 25 ml glass vial fitted with a Teflon sealed cap and one end of a 1/16 in O.D. × 1 ft tube was submerged in the liquid calibration solution after piercing through the septum while the other end was connected to the inlet of the M6 pump. An additional tube (1/16 in O.D. × 1 in) was inserted through the septum to allow room air to enter the calibration solution vial when liquid solution was pumped out. From the pump outlet, another 1/16 in O.D. × 1 ft tube was pierced through the septum of a mixing glass vial (empty) while 1.0 slpm of ultra high purity (UHP) N2 flowed into the mixing vial via a separate 1/16 in O.D. tube that was also pierced through the septum. The flow rate of the UHP N2 was controlled with a mass flow controller (Cole-Palmer, USA) calibrated with a primary flow meter (Defender 220, Bios International). The outflow of the mixing chamber passed through a third tube (1/8 in O.D. × 6 in) that was also inserted into the septum of the mixing vial and connected to a 1/8 in O.D. tee. One of the ports on the tee was vented to an exhaust via a 1/8 in × 6 in tube while the other was connected either to a Proton Transfer ReactionMass Spectrometer (PTR-MS) or a thermal desorption Gas Chromatograph-Mass spectrometer (GC-MS). Both instruments require ∼50 sccm, resulting in the majority of the flow from the mixing vial vented to an exhaust.
www.atmos-meas-tech.net/3/1569/2010/
K. J. Jardine et al.: A new method for preparing pptv–ppbv standard atmospheres of volatile organic compounds
1571
Fig. 1. Diagram of theFigure Dynamic Solution Injection system. calibration vialsolution is connected to the inlet of ainlet liquid 1: Diagram of the Dynamic(DSI) Solution InjectionA(DSI) system. solution A calibration vial is connected to the of astepper stepper motor pump into that a injects a knownvial flowwhere of liquid gasdilution mixing vial slpm ofor dilution (UHP motor pump that injectsliquid a known flow of liquid gas mixing 1.0 into slpma of gaswhere (UHP1.0 nitrogen air) isgas added. nitrogen or air) is added.
were controlled with mass flow controllers (Cole-Parmer and For the purposes of calibration, dilute VOC solutions 1– Omega Engineering) and calibrated using a primary flow me6 were made as shown in Table 1 with either cyclohexane ter (Defender 220, Bios International). (PTR-MS) or methanol (GC-MS) as the solvent. For the PTR-MS calibrations, the six solutions were chosen so that in 2.3 Proton Transfer Reaction – Mass Spectrometry a given solution, no two compounds had the same molecular (PTR-MS) weight. Using a 10 µL GC syringe and a 100 mL volumetric flask, each solution was prepared by diluting 5,µL each of VOC calibration gas samples produced from the two calian authentic, neat liquid standard (Sigma-Aldrich) in 100 ml bration systems (DSI and permeation tubes) were measured of the appropriate solvent to produce concentrations in the using proton transfer reaction-mass spectrometry (PTR-MS). range of 0.22 to 0.89 mM. Once a liquid calibration solution PTR-MS has been used extensively to measure the concenwas added to a new sample vial, the M6 pump was purged at trations of atmospheric volatile organic compounds (VOCs) 100 µL min−1 for 15 min (< 100 µL internal volume). Durwith proton affinity greater than water. The technical details ing this time, the liquid output was collected in a separate of the PTR-MS have been previously described (Lindinger vial (flush). During liquid injection in the mixing vial, the and Hansel, 1997; de Gouw and Warneke, 2007). A commerM6 pump was set to deliver a flow rate of 4.0 µL min−1 or cial high sensitivity PTR-MS instrument (IONICON, Ausless to ensure a complete evaporation of solvent and VOC tria, with a QMZ 422 quadrupole, Balzers, Switzerland) was solutes into the UHP N2 . For solutions in methanol, injec−1 to ensure comused for this study. The PTR-MS was operated under stantion flow rates were kept below 2.0 µL min Figure 2: Example time series of PTR-MS signals (counts per second, cps) during dynamic injections of solution 1 into a 1.0 -1 dard with a drift tube voltage of 600 V and drift plete evaporation. Gas-phase VOC concentrations produced slpm UHP N2 flow. Solution flow rates were injected at 0.0, 0.5, conditions 1.0, 2.0, and 4.0 µL min sequentially. tube pressure of 2.1 mb. During each PTR-MS measureby the DSI system ranged between 0.5–40 ppbv. + ment cycle, the mass to charge ratios m/z 21 (H18 3 O ) and + 2.2 Permeation tube standards m/z 32 (O2 ) were sequentially monitored with a dwell time of 20 ms. From these, the primary ion signal (H3 O+ ) was A comparison was made between VOC calibration slopes calculated to be between 1.5–2.0 × 10⁷ cps. For calibration (GC-MS and PTR-MS) obtained with the DSI technique solutions 1–4, the complete list of mass to charge ratios corand permeation tubes for ethanol, acetone, and α-pinene. responding to the protonated VOCs shown in Table 1 were Gravimetrically certified permeation tubes (KIN-TEK Labsequentially measured, each with a dwell time of 0.5 s. The oratories, Inc.) placed in a temperature controlled pertotal PTR-MS cycle time (each mass to charge ratio meameation chamber (VICI Valco Instruments Co. Inc.) with sured once) was 30.3 s. In order to determine the time re100 sccm of UHP nitrogen flowing through were used to genquired for gas-phase concentrations to stabilize once the liqerate known concentrations of acetone (456 ppbv), ethanol uid injection flow is changed, a reduced set of mass to charge (579 ppbv), and α-pinene (313 ppbv). Upon dilution with ratios were monitored for solutions 5 and 6. In addition to UHP zero air (15.0, 10.4, 5.3, 3.0, and 1.5 slpm), the resultm/z 21 and m/z 32 (H3 0+ and O+ 2 ), mass to charge ratios ing concentrations ranged between 3–35 ppbv. All flow rates were monitored as follows; Solution 5: m/z 81, 137, and www.atmos-meas-tech.net/3/1569/2010/
Atmos. Meas. Tech., 3, 1569–1576, 2010
1572
K. J. Jardine et al.: A new method for preparing pptv–ppbv standard atmospheres of volatile organic compounds
Table 1. Six cyclohexane solutions used to calibrate a PTR-MS using the DSI technique. Solutions 5–6 (α-pinene, ethanol, and acetone) were also prepared in both cyclohexane and methanol for PTR-MS and GC-MS calibrations. Solution
Compounds
1 1 1 1 1 2 2 2 2 2 2 2 2 2 3 3 3 3 3 3 3 3 3 3 3 4 4 4 4 4 5 6 6
dimetnhyl sulfide methyl acetate Benzene 3-methyl-2-buten-1-ol Heptanal ethyl vinyl ketone 3-hexeb-1-ol benzaldehyde benzyl alcohol acetophenone phenethyl alcohol p-cymene 3-hexenyl acetate methyl salicylate 2-butanone 3-methyl-2-butenal 2-penten-1-ol trans-2-hexenal 3-hexanone 1-octene 2-heptanone Guaiacol Nonanal ethyl benzoate Decanal Hexanal 3-pentanone 3-buten-2-one homosalate caryophyllene alpha pinene Ethanol Acetone
MW
PTR-MS (m/z)
mM
62.12 74.08 78.11 86.13 114.19 84.12 100.16 106.12 108.14 120.15 122.16 134.22 142.20 152.15 72.11 84.12 86.13 98.15 100.16 112.21 114.19 124.14 142.24 150.17 156.27 100.16 86.13 70.09 262.35 204.36 136.23 46.07 58.08
63 75 79 87 115 85 101 107 109 121 123 135 143 153 73 85 87 99 101 113 115 125 143 151 157 101 87 71 139 205 137 47 59
0.68 0.63 0.56 0.49 0.36 0.50 0.42 0.49 0.48 0.43 0.42 0.32 0.32 0.39 0.56 0.52 0.50 0.43 0.41 0.32 0.36 0.45 0.29 0.35 0.27 0.41 0.47 0.61 0.17 0.22 0.32 0.86 0.68
Solution 6: m/z 47, 59. This resulted in a decreased PTRMS cycle time of 1-5 seconds. The PTR-MS was calibrated to each solution by measuring the calibration gas generated from the DSI system with liquid injection flow rates of 0.5, 1.0, 2.0, and 4.0 µl min−1 . Each flow rate was measured for at least 30 min and UHP N2 flowing through a separate line was also measured for background signals. Due to fragmentation when operated in standard conditions with a high drift tube voltage (600 V, 111 E/N), the PTR-MS is known to have a low sensitivity to ethanol (Apel et al., 2008). However, with a high sensitivity PTR-MS (primary ion intensity > 2 × 10⁷ cps), it is possible to still measure a significant signal for ethanol at m/z 47 (the unfragmented parent ion) (Rottenberger et al., 2008; Jardine et al., 2010). With previous lower sensitivity versions of PTR-MS, the only chance was to reduce fragmentation by lowering the drift tube voltage. Although a higher yield of m/z 47 would result in better sensitivity at lower E/N, lower E/N causes a Atmos. Meas. Tech., 3, 1569–1576, 2010
higher degree of water clustering, which complicates analysis of other VOCs due to a complex interplay between cluster formation (RH+ (H2 O)n ) and proton transfer reactions (de Gouw and Warneke, 2007; Hewitt et al., 2003). In general, E/N of 120–130 Td is recommended as a good compromise between minimizing the interference of water clusters and maximizing the sensitivity for ambient VOC measurements (Kim et al., 2009). At E/N 117 Td (our typical standard operational conditions of 2.1 mbar and 600 V), we found the first water cluster (m/z 37) to be less than 4% of H3 O+ , at 100% humidity (at 23 ◦ C). 2.4
Thermal Desorption Gas Chromatography – Mass Spectrometry
Identification and quantification of VOCs produced from the two calibration systems (DSI and permeation tubes) was made with a Series 2 Air ServerTM connected to a UNITY 2 thermal desorption system (MARKES International) interfaced with a 5975C series gas chromatograph/electron impact ionization mass spectrometer with a triple-axis detector (GC-MS, Agilent Technologies). The GC-MS was calibrated with solutions 5 (alpha pinene) and 6 (ethanol and acetone) by measuring the gas generated from the DSI system with liquid injection flows of 0.5 µl min−1 , 1.0 µl min−1 , and 2.0 µl min−1 . To access the precision of the entire analytical system (DSI, TD-GC-MS), this calibration was repeated five times. The GC-MS was also calibrated by measuring the gas generated from the dilution of alpha pinene, ethanol, and acetone permeation tubes with UHP zero air (see Sect. 2.2). Calibrated air samples were collected at 50 sccm for 10 min (0.5 L) on an internal sorbent tube (water management cold trap, MARKES International) held at 30 ◦ C and purged with UHP helium at 30 sccm for 5 min. During injection, the trap was heated to 300 ◦ C for three minutes while backflushing with carrier gas at a flow of 6.5 sccm. In order to improve peak shape, 5 sccm of this flow was vented through the split while the remaining 1.5 sccm was directed to the column (Agilent DB624 60 m × 0.32 mm × 1.8 µm) temperature programmed with an initial hold of 3 min at 40 ◦ C followed by an increase to 230 ◦ C at 5 ◦ C min−1 . The mass spectrometer (Agilent 5975C) was configured for scan mode (m/z 40– 300) with a 5.5 min solvent delay (methanol). Identification of VOCs was made by comparison of mass spectra with the National Institute of Standards and Technologies (NIST) database. Quantification of VOCs was performed from peak areas of m/z 45 (ethanol), m/z 43 (acetone), and m/z 93 (αpinene). An assessment of the UHP N2 results demonstrated that peak areas for VOC blanks were negligible.
3
Results and discussion
A series of experiments was carried out to evaluate the function of the DSI system as well as initial tests of the accuracy www.atmos-meas-tech.net/3/1569/2010/
Figure 1: Diagram of the Dynamic Solution Injection (DSI) system. A calibration solution vial is connected to the inlet of a K. J. Jardine et al.: A new method for preparing pptv–ppbv standard atmospheres of volatile organic compounds 1573 liquid stepper motor pump that injects a known flow of liquid into a gas mixing vial where 1.0 slpm of dilution gas (UHP nitrogen or air) is added.
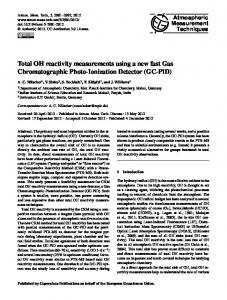
and precision of the analytical procedure. To access the accuracy and precision of the pump, we measured the liquid mass acquired by a glass collection vial after dispensing 50 µL of methanol with the M6 pump at flow rates of 0.5, 1.0, and 2.0 µL min−1 (three repeat mass flow calibrations each). Assuming a methanol density of 0.79 g ml−1 , the accuracy of the nine individual flow settings was found to be within +0.3% to −6.8% of the expected mass (39.6 mg) with an average of −2%. The flow rate precision was found to be 3.9% RSD (nine flows). To access the precision of the entire analytical system (DSI, GC-MS), a full calibration was performed five times with a liquid injection flow rate of 0.5, 1.0, and 2.0 µL min−1 . For all flow rates, the compound specific (acetone, ethanol, α-pinene) peak area precision ranged between 9 and 15% RSD. This analytical precision range therefore includes the variability in liquid injection, gas mixing, sampling and analysis and falls within those found by other studies employing similar GC-MS systems. For example, during an intercomparison of oxygenated VOC measurements in the SAPHIR atmospheric simulation chamber, the stated analytical precision was 3–15% RSD for a Perkin Elmer GC-MS (Apel et al., 2008). Our observations suggest that in the range of flow rates used in this study, the M6 pump offers a repeatable and accurate method for liquid standard injections. After flushing the fresh liquid calibration solution through the M6 pump and tubing, regardless of the liquid flow (0.5– 4.0 µl min−1 ), the liquid calibration solution did not produce visible liquid drops at the end of liquid injection tube in the mixing vial, suggesting that that the liquid delivery rate determines the evaporation rate for both cyclohexane and methanol solutions. We also conclude from these results that the evaporation process is complete without the need for heating. PTR-MS measurements demonstrate that upon switching from measurement of UHP N2 (background signals) to measurement of the DSI system running with cyclohexane solution #1 at a liquid injection rate of 0.5 µL min−1 , a rapid increase in signals corresponding to the presence of the protonated compounds (MW + 1) occurred (Fig. 2). Due to the lower proton affinity of cyclohexane than water, the presence of high cyclohexane concentrations in the drift tube of the PTR-MS did not affect the primary ion intensity or the proton transfer reactions between the primary ion (H3 O+ ) and VOCs. These signals remained stable for the 30-min measurement period indicating establishment of a steady state evaporation process controlled by a constant liquid delivery rate. Upon increasing the liquid injection flow rate to 1.0, 2.0, and 4.0 µL min−1 , the PTR-MS signals increased in a step wise fashion and stabilized after a few minutes. Upon decreasing the solution #1 flow rate from the high (4.0 µL min−1 ) to the low (0.5 µL min−1 ) setting, the PTRMS signals returned rapidly to the original values (data not shown). This result suggests that in the flow rates used, steady state conditions rapidly form and that an accumulation www.atmos-meas-tech.net/3/1569/2010/
Figure 2: Example time series of PTR-MS signals (counts per second, cps) during dynamic injections of solution 1 into a 1.0 -1 slpm UHP N2 flow. Solution flow rates were injected at 0.0, 0.5, 1.0, 2.0, and 4.0 µL min sequentially.
Fig. 2. Example time series of PTR-MS signals (counts per second, cps) during dynamic injections of solution 1 into a 1.0 slpm UHP N2 flow. Solution flow rates were injected at 0.0, 0.5, 1.0, 2.0, and 4.0 µL min−1 sequentially.
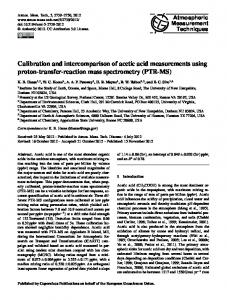
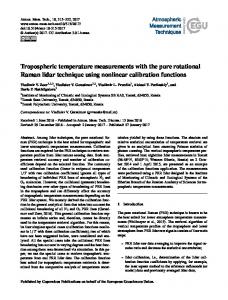
of unevaporated calibration solution in the mixing vial did not occur. To demonstrate the feasibility of calibrating the PTRMS for a variety of compounds using the DSI system, solutions 1–6 were analyzed. These solutions contained a variety of structural classes including isoprenoids, oxygenated VOCs, fatty acid oxidation products, aromatics, and dimethyl sulfide. Care was taken to avoid using compounds with limited solubility in cyclohexane such as organic acids. The results show that linear calibration plots for large mixtures of compounds can be produced with the DSI technique (Fig. 3). Different calibration curve slopes represent different sensitivities of the PTR-MS to each compound. Sensitivities are influenced by differences in transmission efficiencies, fragmentation channels, and proton transfer reaction rate constants. When both GC-MS and PTR-MS calibration slopes were obtained using the DSI and permeation tube methods, reasonable agreement was found for acetone (within 24% of each other) (Fig. 4). However, when calibration slopes for ethanol and α-pinene permeation tubes were compared with the DSI results, the DSI slopes were greater than those from the permeation tubes on both the PTR-MS and GC-MS by a factor of 1.5–2.3 (Fig. 4). To quantitatively validate the DSI method, additional comparisons with other compounds known to be stable in standard techniques like permeation tubes and compressed gas cylinders are needed.
4
Conclusions
Despite drawbacks including low accuracy for polar compounds and hydrocarbons beyond C10 –C11 like formaldehyde and sesquiterpenes (Jayanty et al., 1992), high cost, low field portability, and dangers associated with the use of compressed gas cylinders, the static method for the generation of low concentration (ppbv–pptv) VOC standards is routinely used in industrial, academic, and government settings. Atmos. Meas. Tech., 3, 1569–1576, 2010
1574
K. J. Jardine et al.: A new method for preparing pptv–ppbv standard atmospheres of volatile organic compounds
Figure 4: Quantitative comparison of calibration slopes using DSI and permeation tube methods for e pinene. PTR-MS measurements are shown in the first column and GC-MS measurements are shown in
Figure 3: Calibration of the PTR-MS to 30 different compounds in 4 different cyclohexane solutions using the DSI technique. VOC concentrations generated by the DSI system are plotted versus normalized counts per second (ncps).
References
Apel, E. C., Calvert, J. G., Greenberg, J. P., Riemer, D., Zika, R., Kleindienst, T. E., Lonne K., and Fujita, E.: Generation and validation of oxygenated volatile organic carbon sta 1995 Southern Oxidants Study Nashville Intensive, Journal of Geophysical Research-A 22281-22294, 1998.
Apel, E. C., Brauers, T., Koppmann, R., Bandowe, B., Bossmeyer, J., Holzke, C., Tillman
Figure 4: Quantitative comparison of calibration slopes using DSI and permeation tube methods for e Wegener, R., Brunner, A., Jocher, M., Ruuskanen, T., Spirig, C., Steigner, D., Steinbrec pinene. PTR-MS measurements are shown in the first column and GC-MS measurements are shown in
Figure 4: Quantitative comparison of calibration slopes using DSI and permeation tube methods for ethanol, acetone, and αpinene. PTR-MS measurements are shown in the first column and GC-MS measurements are shown in the second column.
References
Apel, E. C., Calvert, J. G., Greenberg, J. P., Riemer, D., Zika, R., Kleindienst, T. E., Lonne K., and Fujita, E.: Generation and validation of oxygenated volatile organic carbon sta 1995 Southern Oxidants Study Nashville Intensive, Journal of Geophysical Research-A Apel, E. C., Calvert, J. G., Greenberg, J. P., Riemer, D., Zika, R., Kleindienst, T. E.,technique. Lonneman, W. A., Fung, Figure 3: Calibration of the PTR-MS to 30 different compounds in 4 different cyclohexane 22281-22294, solutions using the DSI 1998. 0 different compounds in 4 different cyclohexane solutions using the DSI technique. K., and Fujita, E.: Generation and validation of oxygenated volatile organic carbon standards for the
References
VOC concentrations generated by the DSI system are plotted versus normalized counts per second (ncps). I system are plotted versus normalized counts per second (ncps). 1995 Southern Oxidants Study Nashville Intensive, Journal Apel, E.ofC.,Geophysical Brauers, T., Research-Atmospheres, Koppmann, R., Bandowe, 103, B., Bossmeyer, J., Holzke, C., Tillman 22281-22294, 1998. Wegener, R., Brunner, A., Jocher, M., Ruuskanen, T., Spirig, C., Steigner, D., Steinbrec
Figure 4: Quantitative comparison of calibration slopes using DSI and permeation tube method Figure 4: Quantitative comparison of calibration slopes using DSI and permeation tube methods ethanol, acetone, and α-and GC-MS measurements are sho pinene. PTR-MS measurements arefor shown in the first column Apel, E.PTR-MS C., Brauers, T., Koppmann, Bandowe, B., and Bossmeyer, J., Holzke, are C., shown Tillmann, Wahner, A., pinene. measurements are shownR., in the first column GC-MS measurements in theR., second column.
Wegener, R., Brunner, A., Jocher, M., Ruuskanen, T., Spirig, C., Steigner, D., Steinbrecher, R., Alvarez, E.
References
References
Apel, E. C., Calvert, J. G., Greenberg, J. P., Riemer, D., Zika, R., Kleindienst, T. E., L Apel, E. C., Calvert, J. G., Greenberg, J. P., Riemer, D.,K., Zika, Kleindienst, T. E., Lonneman, W. A.,ofFung, andR., Fujita, E.: Generation and validation oxygenated volatile organic carbo K., and Fujita, E.: Generation and validation of oxygenated volatile organic carbon the 1995 Southern Oxidants Studystandards Nashville for Intensive, Journal of Geophysical Resea 1995 Southern Oxidants Study Nashville Intensive, Journal of Geophysical 22281-22294, 1998. Research-Atmospheres, 103, 22281-22294, 1998. Apel, E. C., Brauers, T., Koppmann, R., Bandowe, B., Bossmeyer, J., Holzke, C., Til Figure E. 4: Quantitative of calibration slopes using and permeation tube methods for ethanol, acetone, and Apel, C., Brauers,comparison T., Koppmann, R., Bandowe, B.,DSI Bossmeyer, J.,Brunner, Holzke, C., R.,Ruuskanen, Wahner, A.,αWegener, R., A.,Tillmann, Jocher, M., T., Spirig, C., Steigner, D., Stein pinene. PTR-MS measurements are shown in the first column and GC-MS shown in the second column.E. Wegener, R., Brunner, A., Jocher, M., Ruuskanen, T., Spirig, C.,measurements Steigner, D.,areSteinbrecher, R., Alvarez, Fig. 4. Quantitative comparison of PTR-MS and GC-MS calibra0 different compounds 4 different cyclohexane solutions the DSI technique. Fig. 3. inCalibration of the PTR-MS to using 30 different compounds in tion slopes using DSI and permeation tube methods for ethanol, I system are plotted versus normalized counts per second (ncps). 4 different cyclohexane solutions using the DSI technique. VOC
References acetone, and α-pinene. concentrations generated by the DSI system are plotted versus norApel, E. C., Calvert, J. G., Greenberg, J. P., Riemer, D., Zika, R., Kleindienst, T. E., Lonneman, W. A., Fung, malized counts per second (ncps). K., and Fujita, E.: Generation and validation of oxygenated volatile organic carbon standards for the 1995 Southern Oxidants Study Nashville Intensive, Journal of Geophysical Research-Atmospheres, 103, 22281-22294, 1998.
Atmos. Meas. Tech., 3, 1569–1576, 2010 Apel, E. C., Brauers, T., Koppmann, R., Bandowe, B., Bossmeyer, www.atmos-meas-tech.net/3/1569/2010/ J., Holzke, C., Tillmann, R., Wahner, A., Wegener, R., Brunner, A., Jocher, M., Ruuskanen, T., Spirig, C., Steigner, D., Steinbrecher, R., Alvarez, E.
K. J. Jardine et al.: A new method for preparing pptv–ppbv standard atmospheres of volatile organic compounds Dynamic methods for the generation of low concentration gas standards have advantages for polar and low vapor pressure species due to the minimization of wall effects, but the current techniques (permeation and diffusion tubes) can suffer from long calibration times, high costs, low compound availability, and difficulties preparing complex mixtures. The DSI method overcomes these limitations and may provide an alternative to dangerous and non-portable compressed gas cylinders and expensive permeation tubes in most cases. The flexibility and versatility of the DSI system stems from the fact that liquid calibration solutions containing complex mixtures of VOCs can be used to dynamically generate a wide range of gas-phase concentrations. Instead of changing the solution injection rates used in this study, we recommend that lower or higher gas-phase concentrations be generated by preparing lower or higher concentrations of VOCs in solution. This would avoid the potentially lower accuracy and precision of solution delivery from the M6 pump at low flow rates (5 nl min−1 ) and incomplete evaporation at higher flow rates. The DSI system is more field portable relative to other calibration techniques due to its small size (pump: 2.0 in × 2.3 in × 7.1 in) and weight (1.7 kg with all components other than the mass flow controller used for the dilution gas). It eliminates the need for bulky temperature controlled permeation/diffusion tube ovens and compressed gas VOC cylinders and regulators. Like conventional methods, the DSI method requires a dilution gas, but the flow rate is low (1.0 slpm) and could easily be generated in the field from ambient air using a small catalytic converter/pump system. Therefore, the DSI calibration method could potentially operate free of compressed gas cylinders. Since our DSI method does not involve addition of heat, this technique may be very useful for the calibration of labile and reactive VOCs as well as “sticky” VOCs like oxygenated VOCs and semivolatile organic compounds. Because of its small size, low cost, and simplicity, we conclude that the dynamic solution injection method will be useful as a semi-quantitative field calibration system. Future tests will hopefully further demonstrate its quantitative capability. Acknowledgements. This research was supported by the University of Arizona-Biosphere 2 Earth Science division. Instrumentation support is acknowledged from NSF (CHE 0216226). We would like to thank Thomas Karl and Alex Guenther at the National Center for Atmospheric Research for their encouragement to develop a liquid injection calibration technique. Edited by: E. C. Apel
www.atmos-meas-tech.net/3/1569/2010/
1575
References Apel, E. C., Calvert, J. G., Greenberg, J. P., Riemer, D., Zika, R., Kleindienst, T. E., Lonneman, W. A., Fung, K., and Fujita, E.: Generation and validation of oxygenated volatile organic carbon standards for the 1995 Southern Oxidants Study Nashville Intensive, J.Geophys. Res.-Atmos., 103, 22281–22294, 1998. Apel, E. C., Brauers, T., Koppmann, R., Bandowe, B., Bossmeyer, J., Holzke, C., Tillmann, R., Wahner, A., Wegener, R., Brunner, A., Jocher, M., Ruuskanen, T., Spirig, C., Steigner, D., Steinbrecher, R., Alvarez, E. G., Muller, K., Burrows, J. P., Schade, G., Solomon, S. J., Ladstatter-Weissenmayer, A., Simmonds, P., Young, D., Hopkins, J. R., Lewis, A. C., Legreid, G., Reimann, S., Hansel, A., Wisthaler, A., Blake, R. S., Ellis, A. M., Monks, P. S., and Wyche, K. P.: Intercomparison of oxygenated volatile organic compound measurements at the SAPHIR atmosphere simulation chamber, J. Geophys. Res.-Atmos., 113, D20307, doi:10.1029/2008jd009865, 2008. Barratt, R. S.: The Preparation of Standard Gas-Mixtures – a Review, Analyst, 106, 817–849, 1981. Bouvier-Brown, N. C., Holzinger, R., Palitzsch, K., and Goldstein, A. H.: Quantifying sesquiterpene and oxygenated terpene emissions from live vegetation using solid-phase microextraction fibers, J. Chromatogr. A, 1161, 113–120, doi:10.1016/j.chroma.2007.05.094, 2007. Cardoso, A. A., Locateli, A. F., Carloni, J., and Franco, R.: Construction and calibration of permeation tubes, Ecletica Quimica, 21, 111–117, 1996. de Gouw, J. and Warneke, C.: Measurements of volatile organic compounds in the earths atmosphere using proton-transferreaction mass spectrometry, Mass Spectrom. Rev. 26, 223–257, doi:10.1002/mas.20119, 2007. Godin, J. and Boudene, C.: New Method for Preparation of Permeation Tubes, Anal. Chim. Acta, 96, 221–223, 1978. Goldstein, A. H. and Galbally, I. E.: Known and unexplored organic constituents in the Earth’s atmosphere, Geochim. Cosmochim. Acta, 73, A449, 2009. Hanson, D. R., Koppes, M., Stoffers, A., Harsdorf, R., and Edelen, K.: Proton transfer mass spectrometry at 11 hPa with a circular glow discharge: Sensitivities and applications, Int. J. Mass Spectrom., 282, 28–37, doi:10.1016/j.ijms.2009.01.021, 2009. Helmig, D., Revermann, T., Pollmann, J., Kaltschmidt, O., Hernandez, A. J., Bocquet, F., and David, D.: Calibration system and analytical considerations for quantitative sesquiterpene measurements in air, J. Chromatogr. A, 1002, 193–211, doi:10.1016/S0021-9673(03)00619-8, 2003. Hewitt, C. N., Hayward, S., and Tani, A.: The application of proton transfer reaction-mass spectrometry (PTR-MS) to the monitoring and analysis of volatile organic compounds in the atmosphere, J. Environ. Monitor., 5, 1–7, doi:10.1039/B204712h, 2003. Jakoubkova, M., Engst, P., and Zelinger, Z.: Continuous Generation of Trace Amounts of Gases by Means of Permeation Tubes, Chemicke Listy, 80, 1191–1195, 1986. Jaouen, P., Gonzalezflesca, N., and Carlier, P.: Dynamic Polluted Atmosphere Generator at Low Ppbv Levels for Validating Voc Sampling Methods, Environ. Sci. Technol., 29, 2718–2724, 1995.
Atmos. Meas. Tech., 3, 1569–1576, 2010
1576
K. J. Jardine et al.: A new method for preparing pptv–ppbv standard atmospheres of volatile organic compounds
Jardine, K. J., Sommer, E. D., Saleska, S. R., Huxman, T. E., Harley, P. C., and Abrell, L.: Gas phase measurements of pyruvic Acid and its volatile metabolites, Environ. Sci. Technol., 44, 2454– 2460, doi:10.1021/es903544p, 2010. Jayanty, R. K. M., Albritton, J. R., Straley, Y. H., and Vonlehmden, D. J.: Stability of Ppb and Ppm Organic Cylinder Gases Used for Calibration and Audits, J. Air Waste Manage. Assoc., 42, 1198– 1204, 1992. Kim, S., Karl, T., Helmig, D., Daly, R., Rasmussen, R., and Guenther, A.: Measurement of atmospheric sesquiterpenes by proton transfer reaction-mass spectrometry (PTR-MS), Atmos. Meas. Tech., 2, 99–112, doi:10.5194/amt-2-99-2009, 2009. Komenda, M., Parusel, E., Wedel, A., and Koppmann, R.: Measurements of biogenic VOC emissions: sampling, analysis and calibration, Atmos. Environ., 35, 2069–2080, 2001. Lindinger, W. and Hansel, A.: Analysis of trace gases at ppb levels by proton transfer reaction mass spectrometry (PTR-MS), Plasma Sci. Technol., 6, 111–117, 1997. Mitchell, G. D.: A review of permeation tubes and permeators, Separ. Purif. Method., 29, 119–128, 2000. Rappengluck, B., Apel, E., Bauerfeind, M., Bottenheim, J., Brickell, P., Cavolka, P., Cech, J., Gatti, L., Hakola, H., Honzak, J., Junek, R., Martin, D., Noone, C., Plass-Dulmer, C., Travers, D., and Wang, D.: The first VOC intercomparison exercise within the Global Atmosphere Watch (GAW), Atmos. Environ., 40, 7508–7527, doi:10.1016/j.atmosenv.2006.07.016, 2006.
Atmos. Meas. Tech., 3, 1569–1576, 2010
Rosenberg, E., Hallama, R. A., and Grasserbauer, M.: Development and evaluation of a calibration gas generator for the analysis of volatile organic compounds in air based on the injection method, Fresen. J. Anal. Chem., 371, 798–805, 2001. Rottenberger, S., Kleiss, B., Kuhn, U., Wolf, A., Piedade, M. T. F., Junk, W., and Kesselmeier, J.: The effect of flooding on the exchange of the volatile C2 -compounds ethanol, acetaldehyde and acetic acid between leaves of Amazonian floodplain tree species and the atmosphere, Biogeosciences, 5, 1085–1100, doi:10.5194/bg-5-1085-2008, 2008. Spinhirne, J. P. and Koziel, J. A.: Generation and calibration of standard gas mixtures for volatile fatty acids using permeation tubes and solid-phase microextraction, T. Asae, 46, 1639–1646, 2003. Teckentrup, A. and Klockow, D.: Preparation of Refillable Permeation Tubes, Anal. Chem., 50, 1728, 1978. Thompson, J. M. and Perry, D. B.: A new system of refillable and uniquely identifiable diffusion tubes for dynamically generating VOC and SVOC standard atmospheres at ppm and ppb concentrations for calibration of field and laboratory measurements, J. Environ. Monitor., 11, 1543–1544, doi:10.1039/B901954e, 2009.
www.atmos-meas-tech.net/3/1569/2010/