Int. J. Mol. Sci. 2011, 12, 9440-9462; doi:10.3390/ijms12129440 OPEN ACCESS
International Journal of
Molecular Sciences ISSN 1422-0067 www.mdpi.com/journal/ijms Article
Dynamic Structure-Based Pharmacophore Model Development: A New and Effective Addition in the Histone Deacetylase 8 (HDAC8) Inhibitor Discovery Sundarapandian Thangapandian, Shalini John, Yuno Lee, Songmi Kim and Keun Woo Lee * Division of Applied Life Science (BK21 Program), Systems and Synthetic Agrobiotech Center (SSAC), Plant Molecular Biology and Biotechnology Research Center (PMBBRC), Research Institute of Natural Science (RINS), Gyeongsang National University (GNU), 501 Jinju-daero, Gazwa-dong, Jinju 660-701, Korea; E-Mails:
[email protected] (S.T.);
[email protected] (S.J.);
[email protected] (Y.L.);
[email protected] (S.K.) * Author to whom correspondence should be addressed; E-Mail:
[email protected]; Tel.: +82-55-772-1360; Fax: +82-55-772-1359. Received: 29 August 2011; in revised form: 15 November 2011 / Accepted: 8 December 2011 / Published: 19 December 2011
Abstract: Histone deacetylase 8 (HDAC8) is an enzyme involved in deacetylating the amino groups of terminal lysine residues, thereby repressing the transcription of various genes including tumor suppressor gene. The over expression of HDAC8 was observed in many cancers and thus inhibition of this enzyme has emerged as an efficient cancer therapeutic strategy. In an effort to facilitate the future discovery of HDAC8 inhibitors, we developed two pharmacophore models containing six and five pharmacophoric features, respectively, using the representative structures from two molecular dynamic (MD) simulations performed in Gromacs 4.0.5 package. Various analyses of trajectories obtained from MD simulations have displayed the changes upon inhibitor binding. Thus utilization of the dynamically-responded protein structures in pharmacophore development has the added advantage of considering the conformational flexibility of protein. The MD trajectories were clustered based on single-linkage method and representative structures were taken to be used in the pharmacophore model development. Active site complimenting structure-based pharmacophore models were developed using Discovery Studio 2.5 program and validated using a dataset of known HDAC8 inhibitors. Virtual screening of chemical database coupled with drug-like filter has identified drug-like hit compounds that match the pharmacophore models. Molecular docking of these hits
Int. J. Mol. Sci. 2011, 12
9441
reduced the false positives and identified two potential compounds to be used in future HDAC8 inhibitor design. Keywords: molecular dynamics simulation; pharmacophore; virtual screening; Lipinski’s rule; molecular docking
1. Introduction Histone deacetylase (HDAC) is a zinc-dependant enzyme involved in the deacetylation of terminal acetylated lysine residues of histone proteins [1–3]. Deacetylation is one of the post-translational chromatin modifications that regulate the epigenetic control of gene expression. This chromatin modification is indispensable as this prepares the chromatin accessible to a large number of chromatin interacting proteins [4]. The acetylation and deacetylation of lysine residues of histone protein are controlled by histone acetyl transferase (HAT) and HDAC enzymes, respectively [5,6]. The mechanism behind controlling the gene transcription is the extent of histone-DNA binding which is the effect of exposure of the positive charge of lysine residues on deacetylation. In contrast, HATs loosen the histone-DNA binding by acetylating the positively charged lysine residues back to their acetylated form and leads to the transcriptional activation [7]. The transcriptional repression of various preprogrammed set of genes including tumor suppressor gene leads to cancer. These repression and activation of transcription have fundamental regulatory roles in developmental processes and their deregulation has been linked to the progression of cancers and different human disorders [8]. HDAC inhibitors can induce cancer cell death whereas normal cells are relatively resistant to the inhibitorinduced cell death [9,10]. HDACs are present in almost all organisms and at least, to date, 18 types of HDACs were identified and classified into four broad classes. First 11 of these 18 types are named HDACs, which contain divalent Zn2+ cation as catalytic machinery and the rest of them are known as sirtuins, which are NAD-dependant enzymes due to their deacetylation mechanism. Class I HDACs include HDAC1-3 and 8 whereas Class II is made of HDACs 4–7, 9 and 10. All of the sirtuins are grouped into Class III HDACs as their mechanism of deacetylation process is different to that of other HDACs. HDAC11, which shares substantial homology with Class I and Class II HDACs, is the only member of Class IV HDACs. Because of the widespread biological effects of HDACs the inhibition of these enzymes has emerged as a new therapeutic approach to treat many diseases such as neurodegenerative, hereditary, inflammatory diseases and cancer [11–18]. HDAC inhibitors are a structurally distinct class of chemical compounds with unique structural elements to compliment the active site components. The generally known pharmacophoric elements present in HDAC inhibitors are: (i) a zinc-binding moiety (ZBM) to co-ordinate with the catalytic metal ion; (ii) a hydrophobic cap group (HCG) to bind at the surface of the tunnel-like active site; and (iii) a hydrophobic linker (HYL) that joins both ZBM and HCG. This hydrophobic linker is normally six carbon chains longer, which is almost equal to the length of the tunnel of the active site (Figure 1) [7].
Int. J. Mol. Sci. 2011, 12
9442
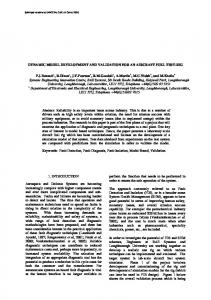
Figure 1. The 3D structure of human histone deacetylase 8 (HDAC8) bound with an inhibitor (PDB code 2V5X). A zoomed view of inhibitor binding region shows the tunnel-like active site in mesh form. The hydroxamic acid part of inhibitor binds close to the metal (Zn2+) ion whereas the aliphatic chain and hydrophobic cap groups occupy the tunnel and surface of the active site.
To date, a number of potential HDAC inhibitors are in clinical trials. Suberoylanilide hydroxamic acid (SAHA) was the first HDAC inhibitor approved by FDA. In terms of diverse chemical structures, HDAC inhibitors include a wide range of scaffolds and can be classified into structural classes such as aliphatic acids, hydroxamic acids, cyclic peptides and benzamides. Design and evaluation of linkerless hydroxamic acid derivatives reported that these new linkerless scaffolds have shown >100 fold selectivity for HDAC8 over other Class I and II HDACs. In addition, it is also reported that the active site of HDAC8 is unconventionally malleable and can accommodate inhibitors of diverse structures with no conventional structural arrangement, which is “ZBM-linker-HCG” [19]. In terms of selectivity of inhibitors, modifications of the ZBM, linker, and HCG have individually contributed to the selective nature of the compounds. All these modifications at various positions have led to the class-selective rather than isoform-selective inhibitors [19,20]. Various experimental evidences reported that different subtypes have intrinsic differences in substrate selectivity [20–22]. A clear knowledge of the selectivity profile over various HDACs from the structural perspective is necessary to design isoform-selective HDAC inhibitors with elevated potency [20]. All Zn-dependant HDACs possess well-conserved deacetylase core domains of approximately 400 amino acids and identical catalytic machinery. This functionally important catalytic machinery includes Zn (a divalent cation) and a charge relay system formed by two histidine and two aspartate residues very close to the metal ion. The active site region of HDACs is highly conserved among the family members and making it very difficult to design isoform-selective inhibitors. A recent study reported that the exposed surface of the active site entrance is less conserved among HDAC isoforms and can be utilized in designing isoform selective inhibitors [20]. Functional HDACs, except HDAC8, are usually found as high molecular weight multiprotein complexes
Int. J. Mol. Sci. 2011, 12
9443
and their purified recombinant forms are also enzymatically inactive [23]. Therefore, HDAC8 has been considered as a best model among mammalian HDACs from a structural biology perspective. The first crystal structure of HDAC8 was determined with a bound inhibitor in 2004 followed by some other diverse inhibitors and with mutations [24–28]. A study observing the structural differences due to the bound inhibitor has reported that the active site topology showed large differences based on the nature of the co-crystallized inhibitors. It also concluded that the enzyme’s inhibition is strongly regulated by the surface malleability [29]. Though the differences in the crystal structures showcase interesting information that they can be used in designing new class of selective inhibitors, the conformational flexibility of the enzyme also has become indispensable to be considered. Thus the utilization of molecular dynamic (MD) simulations to consider the flexibility of protein in the development of pharmacophore models can be a right choice and improve its reliability [30,31]. In this study pharmacophore models were developed using the representative structures of HDAC8 obtained from MD simulations. Two inhibitors showing potent inhibitory profile for HDAC8 were selected and docked into the active site of the enzyme to prepare enzyme-inhibitor complexes. The MD simulations of these complexes were performed and the representative structures from the highly clustered conformations of MD simulation trajectory were selected to be used in the development of pharmacophore models. These pharmacophore models, after validation, were used in virtual screening to identify new and potential hits for future drug design. Molecular docking study has reduced the probability of picking false positives as potential hits. Finally we obtained two potential compounds which can be used in future HDAC8 inhibitor design. 2. Results and Discussion 2.1. Molecular Dynamic Simulation Studies Two most active HDAC8 inhibitors were selected from a set of inhibitory molecules with the experimental activity values determined using the same biological assay procedure collected from the literature. These two compounds are structurally very different except having the hydroxamic acid moiety as common zinc binding group and showing very similar HDAC8 inhibitory profile. The C1 has the modified linker portion when compared to trichostatin A and SAHA whereas the C2 is linkerless (Figure 2). Thus these two compounds were selected to be used in MD simulation studies and the dynamic structures of HDAC8 complexed with these two diverse inhibitors were used in structure-based pharmacophore modeling. Utilization of dynamic structures of the enzyme obtained upon binding of two diverse most active inhibitors in pharmacophore development has an advantage over using a single static conformation of the enzyme [31]. These compounds were docked into the active site of HDAC8 enzyme using GOLD (Genetic Optimization for Ligand Docking) 4.1 program [32]. The X-ray determined crystal structure (PDB code: 2V5X) was used in molecular docking study. The binding poses of the inhibitors were carefully chosen as it is very important that the metal binding part of the inhibitors should be located close to the divalent metal (Zn2+) ion (Figure S1). The best binding conformation among the poses predicted by GOLD program was selected and the protein-inhibitor complex is used in 5 ns MD simulations. Before selecting the crystal structure with the PDB code 2V5X for further study, another HDAC8 crystal structure (PDB code: 1T64) was considered in
Int. J. Mol. Sci. 2011, 12
9444
molecular docking as it is the high resolution structure resolved so far. The 1T64 was identified to have two adjacent active sites bound with two molecules of inhibitors but only one site contains the metal ion responsible for the catalytic activity [20]. The best docked poses of inhibitors bound at this metal containing active site were selected and subjected to MD simulation for 5 ns (data not shown). Figure 2. The 2D chemical structures of HDAC8 inhibitors used in this study are displayed with two clinically proven HDAC inhibitors for structural comparison.
The results of MD simulation have displayed only a single active site merging both the initial active sites. This behavior of 1T64 was considered unfavorable and thus 2V5X, which exhibits a single active site in its crystal structure, was selected for this study. Another MD simulation of HDAC8 without inhibitor (apo-form) was also performed to compare the changes upon the binding of inhibitor. Our simulation results were analyzed using tools bundled with GROMACS distribution package. The root mean square deviation (RMSD) of backbone atoms of the protein revealed that apo-form of HDAC8 was very stable with an average RMSD value of 0.14 nm throughout the simulation time whereas the inhibitor complexes were slightly unstable during the first half of the simulation time i.e., up to 2500 ps. During the second half of the simulation time (2500–5000 ps), the RMSD values for HDAC8-C1 and HDAC8-C2 complexes were maintained at an average value of 0.19 and 0.17 nm, respectively. The RMSD value for HDAC8-C2 complex was slightly lower than HDAC8-C1 complex. This difference can simply be explained upon the size and chemical differences between both of them. These changes in RMSD also conclude that the binding of inhibitor seems to increase the conformational flexibility of HDAC8. None of the three MD simulations resulted in very unstable structures which in turn confirmed the convergent behavior of the systems during the entire course of simulation and the results are reliable for further studies (Figure 3a).
Int. J. Mol. Sci. 2011, 12
9445
Figure 3. Comparison of (a) root mean square deviation (RMSD) of backbone atoms; (b) root mean square fluctuation (RMSF); and (c) potential energy values of 5 ns molecular dynamic (MD) simulations for three systems.
The root mean square fluctuation (RMSF) plot was plotted to estimate the changes in dynamic flexibility of the regions of protein structure due to the inhibitor binding. It also has confirmed that all the catalytically important residues including charge relay system and most of the tunnel and surface forming residues except F209 and M274 were very stable throughout the simulation in all systems.
Int. J. Mol. Sci. 2011, 12
9446
The D101 which is present at the surface of the active site has shown increased flexibility in the C2 complex whereas the flexibility of F209 and M274 has reduced upon inhibitor binding (Figure 3b). The potential energy values of all the systems have shown a smooth decrease till 500 ps and later they stabilized around a constant value of −718,000 kcal/mol (Figure 3c). The distance between the hydroxamic acid moieties of bound inhibitors and the catalytic divalent (Zn2+) metal ion present at the bottom of the tunnel like active site was measured throughout the simulations. The average distance between the hydroxamic acid moieties of both inhibitors and Zn2+ was 0.19 nm which was maintained very stable during the simulation (Figure S2). Both the inhibitors were in interacting distance from the divalent metal Zn2+ ion and the charge relay system. A charge relay system comprising a couple of histidine (H142 and 143) and aspartate (D178 and 183) residues was identified as very important tool in deacetylation process [33–35]. Some structural studies predicted that both histidine residues forming two independent hydrogen bonds are essential for the charge relay systems present in the active site [1,36]. In order to confirm the presence of the inhibitory molecules within interacting distance from the functionally important residues H142 and H143, we have calculated the distance between the hydroxamic acid moieties of the inhibitors and these histidine residues. From the distance plot, we observed that C1 stayed closer to both the histidine residues when compared to C2. In detail, hydroxamic acid moieties of both the compounds were in similar distance with the average values of 0.30 and 0.34 nm from H142 whereas the distance between hydroxamic acid moieties of both compounds and H143 was fluctuating. The center of mass of six atoms of hydroxamic acid moiety and the corresponding histidine residues were used in these distance calculations. The average distance values observed between the hydroxamic aid moieties of compounds (C1 and C2) and H143 (Figure 4a,b) were 0.34 and 0.43 nm, respectively. As the hydrogen bond interaction is important for any HDAC8 inhibitors we calculated the hydrogen bond interactions between the inhibitors and protein during the course of simulation. The C1 and C2 have formed 2 and 1 hydrogen bonds as average values throughout the simulation time with maximum of four and two hydrogen bonds with the active site residues, respectively (Figure S3). Based on the size of the compounds, it was assumed that C1 binds the whole stretch of the tunnel-like active site using its hydroxamic acid, thiophenyl, phenyl and four-membered alkylamino chain while positioning its indole moiety outside the surface of the active site for extended interactions. In the other hand, the C2 positions itself only within the tunnel-like active site approaching the hydrophobic surface with its phenylmethoxy end (Figure S1). An analysis over the orientation of C1 throughout the simulation time has shown that its phenyl ring was placed against the phenyl ring of F139 enabling π-π interaction during the simulation time (not shown in figure). The orientation analysis on C2 has shown that six-membered part of its indole ring was stacked between F139 and H180 enabling very strong hydrophobic interactions at the active site. Based on the results of these analyses both the compounds were predicted to be interacting well at the active site and thus their middle structures snapped from the clustering analysis were used in structure-based pharmacophore modeling.
Int. J. Mol. Sci. 2011, 12
9447
Figure 4. Distance between the hydroxamic acid moieties of inhibitors and two catalytically important histidine residues (a) H142 and (b) H143 in the mechanism of HDAC8 enzyme.
The results of the simulation of HDAC8 enzyme with two different inhibitors were further analyzed using clustering method to cluster the snapshots based on the RMSDs of atom positions. Each structure is added to a cluster when its distance to any element is less than a given cutoff. This analysis will be useful to statistically characterize conformational families which are sampled during the simulations. Clusters were obtained with a cut off value of 0.077 nm and each cluster has a representative structure. The simulation with C1 and C2 were divided into 11 and 10 clusters, respectively, based on the RMSD values of the atom positions (Figure 5). This clustering process also calculates a middle structure for every single cluster obtained. In terms of simulation with C1, the ninth cluster containing 47% of simulated conformations was selected and its middle structure was obtained for further study. In the other hand from the simulation result of C2, tenth cluster containing 33% of the simulation structures was selected and its middle structure was taken to be used in further study. The representative middle structures from both the simulations with bound inhibitor were obtained and superimposed to observe the conformational changes occurred among active site catalytic residues including charge relay system upon different inhibitor binding. All of the catalytically important residues except H143, which is slightly tilted from its position, have behaved same for both the inhibitors whereas the surface forming hydrophobic residues such as Y100 and Y306 have fluctuated differently as response to the nature of the bound inhibitor (Figure 6).
Int. J. Mol. Sci. 2011, 12 Figure 5. The histogram obtained from the clustering analyses of last 4 of 5 ns conformational regions of HDAC8-inhibitor complex MD simulation trajectories. Dark and light gray color cylinders represent the clusters obtained from HDAC8-C1 and HDAC8-C2 complexes, respectively.
Figure 6. Overlay of the representative structures obtained from 5 ns MD simulations of HDAC8-C1 (white) and HDAC8-C2 (green) complexes. Important amino acid residues of HDAC enzyme and the inhibitors are shown in stick and ball-stick forms, respectively.
9448
Int. J. Mol. Sci. 2011, 12
9449
2.2. Structure-Based Pharmacophore Models Pharmacophore models were generated using the two representative structures obtained from the MD simulations of HDAC8 bound C1 and C2, respectively. The hydrogen bond acceptor (HA), hydrogen bond donor (HD), and hydrophobic (HY) chemical features were generated based on the interaction points available from the active site. Based on the mechanism of action and the general pharmacophore for HDAC8 inhibitors, residues were chosen and to trim down the generated pharmacophoric features we have selected only the features that are generated complementary to these residues. Seven pharmacophoric features containing three HD, three HY, and one HA were selected as a pharmacophore model (Pharm-A) from the dynamic structure resulted from HDAC8-C1 complex. Three HD features of Pharm-A were generated as complementary features to D101, H142 and D178 residues. Two features complementing H142 and D178 were located very close to each other and thus were merged to create a new average feature at their average position. The only HA feature of Pharm-A was generated as a complimentary to the catalytic metal (Zn2+) ion whereas the three HY features were picked to compliment the hydrophobic tunnel and surface residues. Thus the final Pharm-A contains one HA, two HD and three HY features was generated from HDAC8-C1 complex (Figure 7). Figure 7. Structure-based pharmacophore model generated from the HDAC8-C1 complex. Secondary structure of protein is shown in cartoon and amino acid residues are shown in stick form. The C1 inhibitor is shown in ball-stick representation. The identified pharmacophoric features are shown in green, cyan and magenta for HA, HY and HD features, respectively.
Int. J. Mol. Sci. 2011, 12
9450
In addition to the Pharm-A, another pharmacophore model was developed using the middle structure obtained from the simulation of HDAC8 bound with C2. Similar to the generation of Pharm-A, the pharmacophoric features generated complimentary to the important active site components were selected and developed a pharmacophore model (Pharm-B). Initially this pharmacophore model was made of one HA, two HY, and four HD features. The HA and HY features of Pharm-B were the complimentary features to the metal ion and the tunnel as well as surface forming residues. Four HD features were the complimentary result to D101, D178, D267, and Y306 residues of the active site. Three of these four HD features were formed very close to each other and has the starting vector point at the same place. Thus these three HD features were merged together to form an average HD feature. The final Pharm-B contains five pharmacophoric features which include one HA, two HD, and two HY features (Figure 8). These generated pharmacophore models represent the flexibility of protein and ligands in its conformational space. Comparison of the generated pharmacophore models revealed that both the models contain same pharmacophoric features except an additional HY feature in Pharm-A. Although the models look similar in their chemical features they are different in their 3D conformational space and this conformational difference is considered as the major advantage of the dynamic structure-based pharmacophore models (Figure 9). Figure 8. Structure-based pharmacophore model generated from the HDAC8-C2 complex. Secondary structure of protein is shown in cartoon and amino acid residues are shown in stick form. The C2 inhibitor is shown in ball-stick representation. The identified pharmacophoric features are shown in green, cyan and magenta for HA, HY and HD features, respectively.
Int. J. Mol. Sci. 2011, 12
9451
Figure 9. Generated pharmacophore models (a) Pharm-A and (b) Pharm-B are shown with their inter-feature distance constraints. Green, cyan, and magenta colors represent HA, HY and HD features, respectively.
2.3. Validation of Generated Pharmacophore Models The generated pharmacophore models were validated for their reliability to be used in database screening and prediction of new compounds. Two different methods with different information were employed in validating the pharmacophore models. The first method is based on the best binding orientation used in MD simulations while the second method is based on the collected dataset of HDAC8 inhibitors with the experimental inhibitory profile. In the first validation method, the best binding orientations of C1 and C2 were matched with generated pharmacophore models A and B, respectively. This study has shown interestingly that both the compounds could map the pharmacophoric features well except one HD feature generated complimentary to D101. In terms of C1, its terminal indole, central phenyl, and thiophene rings mapped upon the HY features of Pharm-A, whereas the closely present functional groups of hydroxamic acid have mapped over the HA and HD features (Figure S4). Comparing to this, C2 has mapped the two HY features of Pharm-B with its phenyl and indole rings whereas the hydroxamic acid moiety mapped over the HA and HD features (Figure S5). In the second method, a dataset containing 100 HDAC8 inhibitors with experimental activity values was screened using the generated pharmacophore models as 3D structural queries. This dataset was divided into three categories: (i) active (