M. Grootjen, M.A. Neerincx, M. Marckelbach. "Dynamic Task Load Scheduling for Platform Control and Navigation on a Naval Ship", in: Proceedings HFES Baltimore, 2007.
Dynamic Task Load Scheduling for Platform Control and Navigation on a Naval Ship M. Grootjen1,2, M. A. Neerincx2,3, M. Marckelbach1
[email protected];
[email protected] 1Defense Materiel Organization, P.O. Box 20702, 2500 ES The Hague, the Netherlands 2Technical University of Delft, P.O. Box 5031, 2628 CD Delft, the Netherlands 3TNO Human Factors, Kampweg 5, P.O. Box 23, 3769 ZG Soesterberg, the Netherlands In process control, the ongoing automation and application of new technologies caused a radical change in the position of the operator. Due to this change, increasing manning constraints and the pressure to maximize the operational capability in the Navy, naval operators need personalized and dynamic support which can differ in time: the system should accommodate the user with the right task support at the right time. This paper presents the design and user evaluation of an interface with task allocation support. This kind of support enables the operator to redirect the alarm (system or operator initiated). Evaluation with 34 navy students shows positive results on performance and general usability. Performance increases because the most important problems are solved faster. However, performance on a less important task decreases and can be interpreted as ‘reallocation costs’. Results on questionnaires show an increasing insecurity on the predictability of the system. 1. Introduction Designing highly complex interactive human-machine systems in process control has been subject of many studies. Ongoing automation causes a radical change in the position of the operator from monitoring and control to supervision. Grootjen et al. (2006b) defined six main problem areas for naval ships: (1) Increasing complexity; (2) Changing of information type and volume; (3) Increasing system autonomy causing ‘out of the loop’ operator problems; (4) Task integration from different domains; (5) Decreasing personnel and training budgets; (6) Increasing legislative constraints. Human-centered design methods are often proposed to establish for the human a central and distinct position from other aspects of the system (Stanton and Baber, 2006; Neerincx, 2003). In human-centered design of a new system, different configurations are tested and evaluated. This iterative process stops when the most efficient configuration, which fits on a generic set of constraints, is established and can be implemented. However, a different configuration could be more efficient for a specific situation or subset of constraints, although it would be less efficient generally. Even if we follow a “classical” human-centered design method, the six defined problem areas make it extremely difficult to develop static support concepts that cover all critical situations. Therefore, support systems in dynamic domains should be dynamic as the domain itself. For example Niwa and Hollnagel (2001) use dynamic mapping of alarm support to enhance operator performance in nuclear power plants. Another example is the alarm handling support system of Dutch navy ships, which has different levels of automation (Mulder, 2003).
At the moment, most implemented system in process control are developed with functional groups as described by Davidson and Nguyen (2003). During development of a new system, user groups are defined which each have authority over a certain set of functions. The operators have control only over functional groups they are properly trained for and certified to operate. A group can only be controlled by one workstation at a time, but there is the possibility to transfer the control to a different workstation (e.g. from Ship Control Centre to Bridge). To cope with problems arising from the 6 mentioned problem areas, we aim at the development of a more dynamic, adaptive system, in which tasks can be allocated and reallocated, and the level of automation can be altered when necessary. The necessity of adaptation will be based on a large variety of information (e.g. task load, operator state, context and system information). At the time of current work we were still specifying this information framework (Grootjen et al., 2006b; Grootjen et al., 2007). Parallel to this specification, current research should gain insight in user aspects of dynamic systems. We use a wizard of oz set up, where support is generated based on a fixed set of rules concerning alarm priorities. We will focus on the effects of task allocation support (TAS) under high and low task load (Neerincx, 2003) on performance and subjective mental effort (SME) and on the general usability of the dynamic interface. This paper presents the design (Section 2) and evaluation (Section 3) of a dynamic interface for naval ships. Next to four support concepts evaluated in earlier research (Grootjen et al., 2002; Neerincx and Lindenberg, 2000; Grootjen et al., 2006a), this research adds a task reallocation feature for dynamic workload scheduling.
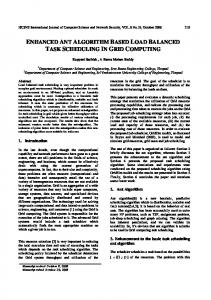
Figure 1: The interface with task allocation support, divided in six different area’s (Grootjen et al., 2002; Neerincx and Lindenberg, 2000; Grootjen et al., 2006a).
Figure 2: The interface without task allocation support. 2. Design of the user interface
display), the bottom part shows the alarms of the crew member. The operator can redirect the alarm, or an entire
This section presents the interface. Figure 1 shows the interface with TAS, an explanation will be given below according to the depicted numbers 1 to 6. 1. The status area is shown on the top part of the screen. In this area important real-time information is presented and an alarm bell is used to indicate the alarm status. 2. The emergency presentation area shows the emergencies with their time of occurrence, categorized into four groups. Each emergency is presented as a hyperlink that ‘loads’ the corresponding procedure in the procedure presentation area (area 3). Selection of an emergency is indicated by ‘inverted’ video (blue background in Figure 1). Next to each emergency a number is given to indicate the priority of that particular emergency. Next to the group name a priority indicator (horizontal bar) and a corresponding number are given, showing the highest priority of that group. With TAS, the alarm category has been split in two parts. In the top part the alarms of the operator are shown (i.e. the operator behind this
category, to another crew member by pressing the icon. 3. The procedure presentation area provides web-browsing functionality and presents a list of all actions that must be performed to deal with the selected emergency. Checkmarks can be placed in the appropriate checkboxes to indicate that a specific step in the procedure was completed. The background of the following step in the procedure is highlighted while the background of the other actions is grey (i.e. the first not check marked step is highlighted). The relevant application for the current (i.e. highlighted) step is activated and presented automatically in the application presentation area. 4. The application presentation area in the middle of the screen is used to present the active application. 5. The common control area contains buttons which can be used to switch from one application to another (5A and 5B). 6. TAS-messages are sent using pop-up boxes. In this case the message states: “ADVICE: reallocate alarm ‘Emergency stop engine 1’ to operator 2.”
Figure 2 shows area 2 without TAS. Only the alarms of the operator working behind this display are shown. The operator is still able to redirect an alarm, but without the visual support of the alarms of the crew member. Accordingly, no extra advice is given. In this situation the operators have to determine the optimal strategy themselves, by communicating with each other. 3. Evaluation of the user interface Method Participants. For the experiment participants with a maritime background were needed. 34 students of the Royal Netherlands Navy College voluntarily participated, 33 males and 1 female between 20 and 28 years of age (mean= 22.3; SD = 1.7). All participants were 3 to 5 years in service and successfully ended their second year with a practical exam, which guaranteed a certain base level. Two couples with the highest performance scores were rewarded with a bonus. The participants were randomly assigned to a condition and couple. One couple was excluded because of system failure during the experiment. Task. The participants’ goal was to solve the problems together, as good and fast as possible. The scenario was designed following the cognitive task load method of Neerincx (2003), and consisted of platform supervision, damage control and navigation related problems. During the first part of the scenario a ‘normal’ watch was simulated. At the end of this part, hostile threats appeared, which resulted in a high task load second part of the scenario. Every couple had to deal with 2 fire alarms, a low pressure alarm of the firefighting system, an alarm concerning the cooling system of the ship, one bilge water alarm, a high temperature diesel engine alarm, a propulsion failure, man overboard alarm and 4 collision warnings. Besides these alarms, they had to plot the ship’s position in an electronic sea chart 3 times. How to deal with these alarms was described in a predefined procedure (which is shown in Figure 1 area 3). Procedure. Depending on the performance of the couples, the scenario took about 25 minutes. The total experiment took 2.5 hours. Before starting the scenario an instruction was given (60 minutes) and the participants used the system during a training scenario (20 minutes). Evaluation took 30 minutes. All sessions were recorded using the Observer XT of Noldus (Noldus, 2006). Figure 3 (in the back) shows a couple during the experiment. They were allowed to talk to each other, it was forbidden to look on each others screen. Design & variables. The experiment has four conditions, each consisting 8 measurements, with the between subjects factor ‘TAS’ and the within factor ‘task load’ as independent variables. By manipulating task load, we are able to research the effects of TAS under different load conditions. The different levels of the independent variables are: 1. Without TAS, participants have to communicate verbally to adjust the task-allocation. The emergency presentation area shows only the alarms of the person operating the system (Figure 2). 2. With TAS. Participants can see each others alarms in
the emergency presentation area and the system provides advice when to reallocate tasks. 3. Task load low. Simulation of a normal ‘watch’ scenario. Task load was manipulated using the task set switches variable of Neerincx (2003). In the task load low condition, switches between problems (i.e. task sets) were minimized. 4. Task load high. At the end of the low task load condition, hostile threats appear, which resulted in multiple problems at the same time. Task set switching in this part of the scenario was high. The following dependent variables were measured: 1. Performance (total alarm time, alarm time and number of correct actions). 2. Subjective mental effort (Zijlstra, 1993) 3. User evaluation questionnaire (5 point scale) consisting of 19 questions. Wizard of oz. The timing of alarms was identical for all conditions (i.e. everybody started with the same scenario). In the condition with TAS, advices were generated by the experimental leader using a wizard of oz protocol (Figure 3). Timing of those messages was dependent on the priorities of the active alarms. The operators together should work on the two alarms with the highest priority. For example, operator 1 is working on a priority 6 alarm, operator 2 on a priority 3 alarm. Next to his priority 6 alarm, operator 1 also has a priority 5 alarm, and, because this is higher than the one operator 2 has available, this alarm will be reallocated.
Figure 3: Experimental leader in wizard of oz setup. In the back a couple is performing the scenario. Results For performance and effort an independent samples t-test was used. Data from the questionnaire was analyzed using Mann-Whitney U. For performance and effort, only significant results (p≤0.05) and interesting trends (0.05