Sep 3, 2010 ... 3Department of Civil Engineering, Monash University ..... For example, the Volvo
XC90 has been specifically designed to perform well in a rollover crash and this
is .... When a straight line is drawn as indicated by the yellow ...
Dynamic Test Protocol To Assess Rollover Crashworthiness
Grzebieta et al
Dynamic Test Protocol To Assess Rollover Crashworthiness 1
2
1
Grzebieta R.H. , McIntosh A.S. , Bambach M. , Young D.P. 1 NSW Injury Risk Management Research Centre, UNSW 2 School of Risk and Safety Sciences, UNSW 3 Department of Civil Engineering, Monash University email:
[email protected]
3
Abstract Recent investigations of Australian Coronial data has indicated that rollover fatalities constitute around 12% of all road deaths and are now higher than fatalities involving frontal (9%) and side impact (10%) crashes. Moreover, in around 2 4% of vehicle crashes where the occupant has been killed (excluding motorcyclists, pedestrians, cyclists, etc) the vehicle has rolled over. For three Australian states of NSW, NT and Victoria, single vehicle crashes accounted for 35% of all occupant fat alities in a single vehicle transport injury event. Despite this and the advances in understanding how occupants are being injured in rollover crashes, there is no accepted dynamic rollover crash test procedure (nor for that matter any test in Australia) o f m edium and small size passenger vehicles fo r the purposes of rollover crashworthiness ratings. This paper discusses the implementation of the Jordan Rollover System (JRS) dynamic rollover test rig being considered to assess the rollover crashworthiness of vehicles. Included is a discussion concerning the Insurance Institute for Highway Safety’s quasi-static roof crush tests based on NHTSA’s FMVSS 216 rule, to rate vehicle rollover crashworthiness. While it is argued the quasi -static rating should be implemented immediately as an interim measure, deficiencies in such an approach in terms of dynamic test outcomes are highlighted. A possible test protocol utilising the JRS is explored. When attempting to justify the test protocol in terms of scientific evidence-based research results, it becomes clear that further research work is still necessary. However, the authors conclude that the present JRS test protocol implemented in the US is conservative in terms of typical real world crash severity. Keywords Rollover crashworthiness, Rollover crash-testing, Vehicle safety, Occupant protection, Jordan Rollover System 1. Introduction Recent studies by the authors of Australian National Coroners Information System (NCIS) have indicated that just over 200 people die each year in Australia in vehicles that have rolled over, i.e. around 12% of all road deaths are rollover related road fatalities. Such fat alities are now higher than fat alities involving frontal crashes (9%) and side impact crashes (10%) [1,2,3]. It was further found that in around 24% to 29% of vehicle crashes where the occupant had been killed (excluding motorcyclists, pedestrians, cyclists, etc), the vehicle had rolled over [1,2]. A more recent study revealed that for three Australian states of NSW, NT and Victoria, single vehicle rollover crashes accounted for 35% of all occupant fatalities in a single vehicle crash [4]. Rollovers are also one of the leading causes (17%) of spinal cord injury. One in every three lives lost in the United States US in vehicle crashes (around 10,000) each year are as a result of a rollover crash [5]. In Europe, around 15% of vehicle occupant fatalities involve some element of a rollover [6].
2010 Australasian Road Safety Research, Policing and Education Conference 31 August - 3 September 2010, Canberra, Australian Capital Territory
1
Dynamic Test Protocol To Assess Rollover Crashworthiness
Grzebieta et al
To put the Australian fatalities into perspective, they can be compared to the total number of people killed 1 in all of Australia’s manmade and natural disasters to date, which number around 1200. The frequency of 2 serious injuries would be much higher than the number of deaths, i.e. possibly around 6000 per annum, with their associated impairments, lifetime disabilities, with estimated annual costs of around 3 billion dollars. Introducing a dynamic rollover crashworthiness test protocol, either via a consumer crash test rating as 3 currently provided by the Australian New Car Assessment Program (ANCAP) , or through a compliance 4 requirement such as an Australian Design Rule (ADR), is likely to assist in reducing this burden of injury significantly. Moreover, a rollover crashworthiness test ADR requirement for automotive manufacturers would align with one of the policy pillars outlined by the Department of Infrastructure, Transport, Regional Development and Local Government’s (DITRDLG) in their Safe Systems approach to Road Safety , namely Safer Vehicles. What this means is that in the case of a “safe driver” travelling in a “safe vehicle” on a “safe road” at the speed limit, and all occupants are correctly wearing their seat belt, then the occupants should not suffer any injury from which they can recover i f, through no fault of the driver, the vehicle is suddenly involved in a rollover crash. This principle at present would be violated if the vehicle was subjected to a rollover and had a vehicle roof strength to weight (SWR) 5 ratio at or above the present US National Highways Traffic Safety Administrations (NHTSA) requirement of 1.5. More recent work by Mandell et al [7] investigated the National Automotive Sampling System Crashworthiness Data System (NASS CDS) database fo r belted, adult (≥16), non-middle seat passengers involved in rollover crashes from 1993 to 2006 and the Crash Injury Research Engineering Network (CIREN) database. They used a logistic regression to evaluate the relationship between different levels of roof crush and mortality, severe injury (AIS ≥3) to the spine, spinal cord, and head injury. They found the risk of mortality, Traumatic Brain Injury (TBI), and spine injury all increased as the degree of roof crush increased. For spine injury, increased risk was seen above three inches (8 cm) crush. Rollover crashworthiness refers to the capacity of the vehicle to protect the occupants from injury during a rollover. Crashworthiness has become a central function of motor vehicles from fleet purchase and Occupational Health and Safety (OH&S) policy [2], consumer and road safety perspectives. Innovation in vehicle crashworthiness has led to significant benefits in the motor vehicle industry, and also in OH&S and public health. Innovation has been driven by a combination of national and international design rules or standards, and consumer tests. No regulatory (ADR) or consumer (ANCAP) crashworthiness standard exists in Australia to date to rate a vehicle’s rollover crashworthiness. Regulators, industry and consumer bodies have been reticent to introduce any ADR or ANCAP test because rollover crashes appear to be very complex events despite existing rollover crashworthiness design regulations, standards and industry and consumer best practice tests for a variety of vehicles as indicated in Table 1 [8]. 2. US Roof Crush Testing Vehicles offered for sale to the motoring public in the US must comply with all applicable Federal Motor Vehicle Safety Standards (FMVSS). FMVSS 216 governs the roof crush resistance of vehicles. It requires that the roof withstand a force of 1.5 times its curb weight (commonly referred to as the Strength to Weight Ratio or SWR) when applied to either front corner of the roof by a rigid flat platen thirty inches wide and seventy-two inches long prior to the roof deforming five inches. The preamble to FMVSS 216 states that 1
2 3 4 5
Some example disasters: Cyclone Tracy (66 deaths); Fires (2009 Victoria: 173; 2003: Canberra: 4, Linton: 5, Litgow: 2, Ferny Creek: 3, 1994 NSW: 4, Ash Wednesday: 75, 1967 Tasmania: 59, 1944 Victoria: 51, Black Friday: 71, 1926 Victoria: 3, a total of 450 deaths resulting from fire); Thredbo 18 fatalities; Bali bombing 202 fatalities; 1998 Sydney to Hobart 6 fatalities; Granville Train 83; Boxing Day Tsunami 12. The total is 837 deaths. Estimated as 12% of all 52,066 road transport serious injuries per annum and rounded down to nearest thousand. Australian New Car Assessment Program. See http://www.howsafeisyourcar.com.au/. Australian Design Rule See http://www.infrastructure.gov.au/roads/motor/design/index.aspx The strength to weight ratio (SWR) is the load measured at 127 mm (five inches) of roof crush divided by the kerb weight of the vehicle during a one-sided quasi static roof crush test. The crush test is carried out using a rigid flat platen 762 mm (thirty inches) wide and 1829 mm (seventy- two inches) long applied to the vehicle front A-pillar at a pitch angle of 5º and roll angle of 25º.
2010 Australasian Road Safety Research, Policing and Education Conference 31 August - 3 September 2010, Canberra, Australian Capital Territory
2
Dynamic Test Protocol To Assess Rollover Crashworthiness
Grzebieta et al
the standard’s purpose is “to reduce deaths and injuries due to the crushing of the roof into the passenger compartment in rollover accidents.” However, since the standard’s effective date for passenger cars of September 1, 1973, the number of deaths and injuries in rollover crashes has steadily increased over the past decade [8,9]. Currently there are approximately 10,000 fatalities and more than 20,000 serious injuries every year in rollover crashes in the US. In 1989 the National Highway Traffic Safety Administration (NHTSA), the US federal agency charged with regulating automobile safety, reported on a study analyzing the effectiveness of FMVSS 216. It found that the Standard had a negligible effect on occupant safety in rollovers. The FMVSS 216 test has also been criticised by a number of researchers such as Henderson and Paine [10], Rains and Van Voorhis [11] and Mao et al [12] among others. Indeed, the Australian Federal Department of Transport, through the Australian Transport Safety Bureau (ATSB), requested a review of the costs, benefits and feasibility of introducing a new ADR based on the FMVSS 216 rule. Henderson and Paine [10] carried out the study and the ATSB concluded on the basis of their investigation that “the FMVSS 216 is an inadequate standard, and that there would be little or no incremental benefit in introducing an Australian Design Rule based on it” and that “it is considered that improvement in roof strength (perhaps in certain key impact directions), along with other countermeasures, would decrease the incidence of rollover-related injuries.”
Rule* ADR
Sections applicable to Rollover 59
Requirement
Static vs. Dynamic
Mandatory
Dynamic
AS
2294
Best Practise
Static
AS ISO
1636 16333
Best Practise Best Practise
Static Static
ISO
3471
Best Practise
Static
SAE
J1040
Best Practise
Static
ECE
R66 220 216 208
Mandatory Mandatory Mandatory Optional
Rollover Ratings
Best Practice
Dynamic Quasi -Static Quasi -Static Dynamic Static/ Dynamic
FMVSS NCAP IIHS SANS
Crashworthiness Ratings 1563
Applicable Vehicle Class
Country
Buses Australia Earth-Moving Australia Machinery Tractors Australia Trucks and buses International Earth-Moving International Machinery Construction, Earthmoving, Forestry USA and Mining Machines Busses Europe School busses USA Passenger vehicles USA Passenger Vehicles USA Passenger Vehicles
USA
Best Practice
Static
Passenger vehicles
USA
-
-
Busses (capacity>16)
South Africa
* ADR – Australian Design Rule, AS – Australian Standard; FMVSS – Federal Motor Vehicle Safety Standard; ISO – International Standards Organisation; SAE – Society of Automotive Engineers; ECE – Economic Commission for Europe; NCAP – New Car Assessment Program; IIHS – Insurance Institute for Highway Safety; SANS – South African National Standard. Table 1 – Rollover Design Regulations and Industry and Consumer Best Practise (Young et al, 2006) Young [1] and Young and Grzebieta [13] have shown via mathematical derivation that the minimum SWR should be around 3.6 in order to prevent injury. The following was used to derive this value: Newtonian laws of physics; an understanding of how frame structures deform plastically; empirical values determined from General Motors (GM) Malibu rollover crash test data; and NHTSA’s FMVSS 216 test protocol criterion that a maximum allowable deformation of 127 mm (5 inches) is required to prevent injury. Moreover, in May 2009 NHTSA issued a final rule setting a two-sided static SWR criteria of 3.0 as a clear and unambiguous statement that "roof crush causes injury". Friedman and Grzebieta [14] and Grzebieta et al [2] also demonstrated experimentally that the load imparted onto the occupant as a result of roof crush is significantly reduced when a vehicle’s SWR is 4 or higher. Moreover, Young [1] has identified that no
2010 Australasian Road Safety Research, Policing and Education Conference 31 August - 3 September 2010, Canberra, Australian Capital Territory
3
Dynamic Test Protocol To Assess Rollover Crashworthiness
Grzebieta et al
fatalities have occurred in vehicles involved in a real world rollover crash, where the roof SWR is 4 or greater and the occupant was seat belted. A study by the Insurance Institute fo r Highway Safety (IIHS) [15] studied 11 midsize Sports Utility Vehicles (SUV) roof designs in single vehicle rollovers. They showed that, in real-world rollover crashes, “In all cases, increased measures of roof strength resulted in significantly reduced rates of fatal or incapacitating driver injury after accounting for vehicle stability, driver age, and state differences.” They found “A one-unit increase in peak strength-to-weight ratio (SWR) within 5 inches of plate displacement, the metric currently regulated under the FMVSS 216 standard, was estimated to reduce the risk of fatal or 6 incapacitating injury by 28 percent.” The IIHS have introduced a rating procedure for rollover roof strength. They have four ratings, namely ‘good’ (SWR must be 4 or greater), ‘acceptable’ (SWR between 3.25 and 4), ‘marginal’ (SWR 2.5 to 3.25) and ‘poor’ (SWR less than 2.5). IIHS indicate that “ a vehicle with a roof strength-to-weight ratio of 4.0 has an estimated 50 percent reduction in the risk of serious and fatal injury in single-vehicle rollover crashes compared with the minimum level of 1.5”. NHTSA have also published a table of SWR’s fo r a variety of v ehicles, albeit older model vehicles [16,17]. When these SWR’s for different models of vehicles sold in Australia are combined with the IIHS ratings, a reasonable range of tests of vehicle roof structures are available. It should be pointed out that while the steering for US vehicles is on the left hand side, the roof frame of the vehicles listed in Table 2 will likely be similar to Australian vehicles. Vehicles that are missing from this table are Australian sold vehicles such as the Holden Commodore, Ford Falcon, Nissan Patrol, Toyota Landcruiser, etc. The information provided in Table 2 would be a valuable fi rst step by a consumer group such as ANCAP as proposed by Paine and Newland [18], to providing consumers with important information regarding the roof strength of a vehicle to encourage purchase of a vehicle with an SWR of 4 or higher. Vehicle SWR Vehicle SWR 2009 Nissan Cube* 7.26 2009 Mazda 6* 3.55 2008 Smart Fortwo* 5.41 2006 Toyota Rav4* 3.46 2007 Toyota Camry* 5.31 2007 Mini Cooper* 3.44 2009 Toyota Corolla* 5.09 2009 Nissan Maxima* 3.43 2007 VW Jetta 5.1 2009 Honda Fit* (sold as Jazz) 3.42 2010 Subaru Outback* 4.68 2006 Hummer H3 3.4 2009 Subaru Forrester* 4.64 2007 Mitsubishi Outlander* 3.32 2009 Subaru Impreza Wagon* 4.62 2006 Kia Optima* 3.12 2006 Volvo XC90 4.6 2006 Hyundai Sonata* 3.12 2009 Subaru Impreza* 4.5 2006 Chrysler Cross fire 2.9 2006 Honda Civic 4.5 2004 Honda Accord 2.8 2006 Honda Civic 4 -door* 4.48 2006 Ford Mustang 2.7 2010 Kia Soul* 4.33 2006 Sprinter Van 2.6 2007 Nissan Frontier 3.9 2007 Honda CRV 2.6 (sold as Navara) 2008 Ford Escape* 2.55 2006 Subaru Tribeca 3.9 2008 Mazda Tribute* 2.55 * 2008 Honda Accord 3.87 2005 Kia Sportage* 2.43 * 2007 Toyota Yaris 3.8 2006 Honda Ridgeline 2.4 2006 Hyundai Accent 3.72 2007 Jeep Grand Cherokee 2.2 * Kia Rio * SWR value from IIHS site: http://www.iihs.org/ratings/roof/detailsbyclass.aspx Table 2: SWR of a selection of US vehicles with roofs likely to be the same as those sold in Australia. (Green: Author’s recommended minimum SWR; Yellow: vehicles exceed NHTSA’s updated SWR of 3.0, Red: Author’s consider these v ehicles expose occupants to unacceptable roof crush injury risk) While the SWR can provide a reasonable first indication of risk of injury to occupants in a rollover crash, it is not necessarily s o fo r all vehicles. In the absence of ADR or ANCAP guidance, Australian mining and petroleum companies have begun installing roof-strengthening systems such as internal and external roll 6
See: http://www.iihs.org/ratings/roof/information.html
2010 Australasian Road Safety Research, Policing and Education Conference 31 August - 3 September 2010, Canberra, Australian Capital Territory
4
Dynamic Test Protocol To Assess Rollover Crashworthiness
Grzebieta et al
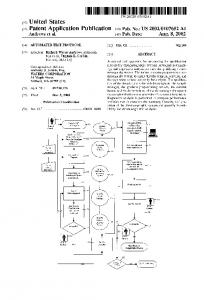
cages and roll bars to protect their employees in the event of a rollover crash [2]. They do this on the basis of the recent publications that have found roof strength plays a significant role in occupant survival in rollover crashes [7,15,19]. However, the issue is more complex than this simplistic approach adopted by industry would suggest. Friedman and Grzebieta [14] recently highlighted a test of a weak roof strength vehicle, namely the Honda CRV (SWR < 3) that performed as well as the higher SWR stronger roo f vehicles such as the VW Jetta and the Toyota Camry with SWR’s exceeding 5 (Figure 2). A more recent test carried out by Friedman from the Centre for Injury Research (CFIR) and Digges from the Automotive Safety Research Institute (ASRI) on a very strong roof vehicle (SWR > 6) resulted in the roof completely crushing in the second roll and potentially high injury risk levels measured. 7,8 Another issue concerns the testing of the effectiveness of restraint systems and aircurtains during a rollover crash. There should be an opportunity to assess new innovative restraint systems such as cross seat belts or roof liners that prevent head capture against the side header rail during impact with the roof. 3. Dynamic Versus Quasi Static Testing A dynamic test would provide information concerning the effect of different vehicle characteristics such as SWR, load paths, vehicle geometric shape, vehicle type such as SUV/4WD, sedan, etc. Occupant protection systems (seat belts, seat belt pre-tensioners, air curtains, air bags, etc) on mitigating head, neck, spine, chest and abdominal injuries that occur in the majority of real world crashes that are deemed to be of a survivable severity, could be assessed. Parametric studies for a range of rollover conditions could also be studied to determine the requirements for occupant protection systems and how for example air curtains and seat belt pre-tensioners will fu nction during the roll event. Out of position occupants as a result of fl ailing during the event may well counter act firing of restraints thus exacerbating injuries that will affect countermeasure designs. Unintended injury risks arising from this changed crashworthiness paradigm, can be assessed and considered i f a dynamic rollover test were available, where each phase of the rollover can be precisely isolated. It is conceivable that a stiffer roof structure may increase the risks of ‘diving’ or flail related impacts that lead to low severity Abbreviated Injury Scale (AIS ) 1 or 2 cervical spine or head injuries. However, this cannot be studied unless a dynamic crash test is developed. A test rig called the called the Jordan Rollover System (JRS) is capable of carrying out precise and repeatable rollover crashes that can investigate such parameters (Figure 1). A description of the test rig has
Drop Towers Moving Roadway
Cradle holds vehicle
Vehicle rotation coupled to roadway via pulley system Figure 1: Jordan Rollover System Mk I 7 8
See: http://www.centerforinjuryresearch.org/testing/scion_xb/ See: http://www.autosafetyresearch.org/pdfs/2008%20Scion%20xB%20JRS%20Tests.pdf
2010 Australasian Road Safety Research, Policing and Education Conference 31 August - 3 September 2010, Canberra, Australian Capital Territory
5
Dynamic Test Protocol To Assess Rollover Crashworthiness
Grzebieta et al
been provided in Friedman and Grzebieta [14] and how it functions in Grzebieta et al [2]. The vehicle is restrained by a cradle at the front and rear bumper regions through its Center-of-Gravity (CG). The cradle ends are mounted into drop towers that allow rotation of the vehicle about its longitudinal axis via the CG. The vehicle is simultaneously rotated and released as a roadbed moves under it. The roadway and rotation of the vehicle are coupled via a pulley cable system. The test starts from an almost vertical orientation to the road bed position similar to that shown in Figure 1. During the simultaneous rotation and fall, the vehicle strikes the moving roadbed below on the leading side of roll at the side roof rail at the prescribed roadbed speed, vehicle angular rate, drop height and impact pitch angle. After striking the near side, the vehicle continues to roll and strikes the side opposite to the leading side. The vehicle is then captured. The motions of the vehicle and roadway are coordinated so that the touchdown conditions can be controlled and thus repeated within a narrow range. A 50th percentile Hybrid III Anthropomorphic Test Dummy (ATD) is used to monitor head and neck loads in the driver seat position. String potentiometers are used to measure roof intrusion and intrusion rates, as well as the ATD’s motion. High speed cameras also record vehicle and ATD motions. The ATD is setup according to the FMVSS 208 protocol. In the protocol outlined in Friedman and Grzebieta [2], the vehicle’s fi rst roll, is set at 5º pitch angle whereas in the second roll the vehicle is set at 10º pitch angle. Roll rate at 190º per second, yaw at 10º and roadway speed at 24 km/h (6.7 m/s) are the same for each of the two rolls. An assessment of the JRS test rig compared with other test rigs and procedures has been carried out by Chirwa et al [20]. Similarly, Hutchinson and Friedman [21] have assessed the JRS against a free unconstrained over-the-road rollover and found JRS rollover testing approach closely replicates the impact environment of the rollover event. Figure 2 shows results from the series of tests detailed in Friedman and Grzebieta [2]. There is a reasonable correlation between the SWR and maximum dynamic roof crush during a JRS rollover test. It is clear there is better roof crush performance for vehicles with a higher SWR.
Figure 2: Maximum roof crush measured during a JRS test compared to corresponding SWR. For example, the Volvo XC90 has been specifically designed to perform well in a rollover crash and this is clearly evident in Figure 2. The Volv o XC -90 was introduced in the 2003 model year. The Volvo engineers recognized the design challenges in occupant safety posed by the SUV and resolved to design a safety cage of high strength materials and structural concepts that were able to achieve a remarkable
2010 Australasian Road Safety Research, Policing and Education Conference 31 August - 3 September 2010, Canberra, Australian Capital Territory
6
Dynamic Test Protocol To Assess Rollover Crashworthiness
Grzebieta et al
improvement in occupant protection. The result is an extremely strong upper body structure with good rollover properties. By using high performance materials in the upper A-pillar – roof header junction, and in the B pillar area, Volvo was able to increase both rollover protection and side impact protection with very little additional weight. 9
In contrast to the Volvo, the VW Jetta’s and Toyota Camry’s maximum roof crush during the second roll appear to exceed NHTSA’s requirement of 127 mm (5 inches) maximum allowable deformation to prevent injury. In other words, a strong roof vehicle tested under quasi-static conditions (e.g. FMVSS 216) does not necessarily ensure good performance in a dynamic test simulating a typical real world rollover crash. Given that a dynamic rollover crash test protocol would begin to address the above issues discussed, there still remains the problem of what the rollover test protocol should be adopted and how to measure any potential injury risk that reflect real world crash injuries that typically occur. Recent studies have now provided sufficient statistical information to establish parameters to develop such a dynamic test protocol [2,4,5]. The following sections provide details of a possible dynamic rollover test protocol that could be implemented using the JRS albeit there are still a number of gaps that need to be addressed. 4. Crash parameters A considerable amount of work has already been completed in regards to identifying what is a typical rollover crash in terms of crash severity and roll characteristics. To provide the input parameters fo r a dynamic test it is important to define the factors such as number of rolls, roll rate, pitch, yaw angle and drop height. For example, the number of rolls to some extent defines the trip speed and roll rate. Also the pitch angle and drop height is critical to roof strength requirements. Some of these can be established as follows. 4.1 Number of quarter turns Eigen [22] used the US National Automotive Sampling System - Crashworthiness Data System (NASS CDS) to identify 166,263 passenger vehicle rollover crashes that occurred between 1995 and 2001 [23,24]. Eigen’s results showed that:
81% of all rollover crashes were single vehicle events;
99% of these single vehicle rollovers were lateral rollovers (i.e. involved a vehicle that rolled about its longitudinal axis with a sideways motion); and
71% of these single vehicle rollovers were initiated by the mechanism known as the trip over.
More recent work in Australia by Frechede et al [4] also identified that a lateral roll lasting 8 quarter turns covered more than 90% of single vehicle fatal rollover crashes for three states of NSW, NT and Victoria. Hence, any test protocol should include subjecting the vehicle to 8 quarter turns which potentially involve two impacts to any particular point in the roof structure. 4.2 Rollover trip speed Given that a 2 roll crash would cover around 90% of single vehicle rollover crashes in Australia where a fatal or serious injury would occur, an approximate values for trip speed at which such a crash occurs can be determined. Jones and Wilson [25] reconstructed a number of four wheel drive SUV rollover crashes and plotted rollover distance versus number of rolls. It is possible to identify from their analysis that the roll distance for a two roll crash event ranged from around 27 m etres (m) to 31 m. Orlowski et al [26] also plotted roll distance versus number of rolls using data collected from 41 crash tests from various sources where the average number of rolls per test was two. The Orlowski et al [26] collected data were based on FMVSS 9
See: http://www.citizen.org/documents/ACF48DD.pdf
2010 Australasian Road Safety Research, Policing and Education Conference 31 August - 3 September 2010, Canberra, Australian Capital Territory
7
Dynamic Test Protocol To Assess Rollover Crashworthiness
Grzebieta et al
10
208 dolly rollover testing of a variety of vehicles including full-sized sedans, small cars, vans and pickup trucks. For a two roll event the distance covered ranged from around 18 m to 23 m. However, lateral dolly rollover tests tend to provide a higher number of rolls per distance than in a real world crash event. Hence, a more reliable figure of roll distance from a real world crash would be of the order of around 30 m as per Jones and Wilson’s [25] reconstruction. Tahan et al [29] investigated the initial configurations for the JRS test and concluded that a minimum road bed speed of 24 km/h was required for both near and far side contact. At speeds less than 24 km/h the far side impact was not significant. It is well recognised that impact with the far side is one of the main sources of injury to contained occupants [2,30,31]. Hence interaction with the far side of the vehicle during a dynamic test procedure is critical for driving vehicle design to mitigate injuries occurring in rollover crashes. Orlowski et al [26,27] also indicated that that effective friction coefficients for rollovers are in the range of 0.4g to 0.6g with 0.43g for on road rollovers of sedan vehicles where g = 9.81 m/sec2 . Jones and Wilson [25] also recommend these values albeit for on-road rollovers they recommend the lower values of friction. Table 1 shows that a trip speed of the order of around 50 km/hr (14 m/sec) would be a reasonable trip speed to simulate a two roll event on a roadway.
Roll distance (m) 18 23 27 31 average
Friction coefficient 0.4g 0.6g 43 52 48 60 52 64 56 69 ≈ 50 ≈ 61
Table 2: Trip speed in km/h for a two roll crash 4.3 Rollover rate The distance over which the rollovers occur appear to be linear with respect to roll angle [26]. Again assuming an average deceleration rate of 0.4g and an initial velocity of 50 km/h, the time taken for the two rolls to occur is approximately 3.5 seconds over a distance of around 25 m. Hence, this would result in an average roll velocity of around 200 degrees per second. However, the rollover rate can vary substantially from 200 to 400 degrees per second depending on the impact to ground interaction [26,27,32]. Jones et al [25] indicate an initial roll rate of around 250 to 350 degrees fo r on-road rollovers. It appears that a roll rate of 300 degrees per second would suitable. This would mean that the roadway’s velocity would be faster if set at 50 km/h than the velocity of the point where the roof comes into contact with the roadway. The roll rate of the vehicle would increase because of this fri ctional interaction. If the road way speed was much less then the effect of the frictional interaction of the roof with the roadway increasing the roll rate would be less. It would be expected that if the difference between the roadway speed and the velocity of the roof as a result of rolling was high, a load would be applied to the A-pillar as indicated in Grzebieta et al [3]. Hence, the lower the roll rate the higher the friction load. It is interesting to note that Tahan et al [29] in their parametric study of the initial configurations for the JRS test concluded that the roadway speed controls the roll rate and that for higher roll rates the far side impact duration extends. 4.4 Drop height The inverted drop t est J996 [20] developed by the Society of Automotive Engineers (SAE) Impact and Rollover Test Procedures Sub-Committee in 1967, does not specify a drop height. However when the protocol was being developed it initially required the vehicle be dropped from 2 feet, 6 inches (76.2 cm) 10
The FMVSS 208 Dolly rollover test fixture places the vehicle sideways on a sled inclined at 23°, propelled by moving it laterally at a velocity about 48.3 kph, and then decelerated suddenly so that it trips the vehicle into a rollover about its longitudinal axis (see also [20,27,28] ).
2010 Australasian Road Safety Research, Policing and Education Conference 31 August - 3 September 2010, Canberra, Australian Capital Territory
8
Dynamic Test Protocol To Assess Rollover Crashworthiness
Grzebieta et al
and then 3 feet (91.4 cm) at a combined 25˚ roll and 5˚ pitch angles. Mao et al used a height of 50 cm for their parametric study of pitch and roll angles. Henderson and Paine’s [10] report indicates that a sedan vehicle’s vertical movement of its CG in a one roll appears to be around 50 cm. The vehicle is dropped 4 inches (10.1 cm) in JRS tests carried out by the Center for Injury Research (CFIR) and Auto Safety Research Institute (ASRI). 11 Friedman and Nash [33] indicated “ The center of gravity of a rolling vehicle does not rise or fall more than a few inches during a rollover.” Tahan et al [29] investigated the effect of three drop heights of 10, 20 and 30 cm on the vehicle impact loads during a JRS test. They concluded that an increase in drop height increases the impact force for both sides of the vehicle. Finally, Grzebieta et al [3] showed the vertical drop height was around 30.5 cm in Test 7 of GM 1980 Malibu II rollover crash tests [34], where the highest neck load was measured. When the rotational speed of the vehicle 1.7 m/sec is coupled to the velocity of the CG, the impact speed at the roof rail roadway contact point would have been around 3 m/sec. This is equivalent to dropping the vehicle around 45.9 cm. Hence, it can be seen that the drop height can vary significantly. Which drop height is appropriate is still unclear. CFIR and ASRI’s adoption of 5 inches appears to be very conservative. A drop height of around 50 cm appears to be better representative of a real world crash as per Henderson’s and Paine’s findings and used by others. 4.5 Pitch Angle When the vehicle rotates, the CG along the axis of the vehicle will influence how the vehicle will roll. Vehicles with the engine mounted at the front of the vehicle will pitch forward. This is the most common configuration for sedan and 4WD/SUV style vehicles. The two vehicles shown in Figure 3 have interacted with the ground at the front of the vehicle in a rollover crash. When a straight line is drawn as indicated by the yellow line, it becomes clear that the pitch angle of the vehi cle was at some stage of the rollover greater than these final angles relative of 20 degrees and 15 degrees to the roadway outlining the deformation.
Figure 3: Vehicles involved in a rollover crash (Top 20 degrees, Bottom 15 degrees)
11
See: http://www.autosafetyresearch.org/Rollover%20%20Project.htm and http://www.centerforinjuryresearch.org/testing/
2010 Australasian Road Safety Research, Policing and Education Conference 31 August - 3 September 2010, Canberra, Australian Capital Territory
9
Dynamic Test Protocol To Assess Rollover Crashworthiness
Grzebieta et al
Friedman and Nash [33] determined the pitch angle at which the four largest peak forces were measured during the GM Malibu Series II rollover crash tests [34]. The angle varied from 3 to 10 degrees. The maximum force for the injury measure 7L4 was 10 degrees. 12
The CFIR and ASRI use a pitch angle of 5 degrees for the first roll and 10 degrees for the second roll in their two roll JRS tests. Mao et al [35] in their parametric study of the influence of pitch and roll angles in a 50 cm inverted drop test, found that a 10 degree pitch angle resulted in the largest amount of roof crush. From these studies it would appear that a pitch angle of 10 degrees would provide a reasonable loading of the roof that best simulates a typical real world condition. An issue that remains is that if a two roll protocol is adopted, then would both roll 1 and roll 2 be set at a pitch angle of 10 degrees or would the angles be set as per the CFIR/ASRI protocol of 5 degrees in the first roll and 10 degrees in the second roll. This needs to be fu rther researched. 4.6 Yaw Angle To date JRS tests are carried out with the yaw angle set at 10 degrees [30]. Jones et al [25] found that i n on-road rollovers the vehicle’s yaw angle at the point of rollover was usually between 35 to 50 degrees. Chirwa et al [20] also describe the corkscrew rollover test originally developed by ADAC (Allgemeiner Deutscher Automobil -Club) of Germany. When the vehicle’s roof impacts the roadway, it is subjected to a the combined forward velocity and yaw angle of around 80 to 90 degrees. It is clear that more research work in terms of a parametric study investigating how the yaw angle effects roof loading and consequential roof crush. In the interim, the yaw test angle chosen by CFIR and ASRI for the JRS tests appears to be conservative. 5. Conclusions The above discussion concerning the various rollover crash characteristics that would make up a JRS dynamic test protocol indicate that further parametric research work needs to be carried out in order to be able to confidently identify a set of parameters that represent the majority of real world rollover crashes. It is clear that a lateral two roll protocol would be representative of real world crashes. However, roadway speed, roll rate, pitch and yaw angle and drop height need further analysis. Recent work by Tahan et al [29] has identified some bounds for these parameters albeit more work needs to be done. Moreover, a dynamic crash test procedure must also include injury risk analysis that identifies what proportion of rollover injuries would be mitigated and hence benefit. Because these issue of the different parameters has not been adequately justified in terms of scientific evidence, a new Mk II JRS is presently being constructed at the Road Traffic Authority’s Crash Lab Facility under the auspices of an Australian Research Council research infrastructure Grant. The advanced JRS will be capable of varying the parameters discussed above. The key difference between the Mk I and Mk II test rig is that the roadway has been decoupled from the roll cradle. Otherwise all other specifications are essentially the same. Developing a dynamic test protocol to determine rollover crashworthiness has the potential to make vehicle rollover crashes much more survivable. Obviously the protocol used to date as described i n Friedman and Grzebieta [14] is a good start in terms of a lower to medium severity rollover crash. If the maximum dynamic roof crush measurements shown in Figure 2 are in the red highlighted box, then it would not matter if the test protocol was configured for a higher rollover crash severity. These vehicles would still perform poorly in terms of occupant injury risk in a rollover crash.
12
See: http://www.autosafetyresearch.org/Rollover%20%20Project.htm and http://www.centerforinjuryresearch.org/testing/
2010 Australasian Road Safety Research, Policing and Education Conference 31 August - 3 September 2010, Canberra, Australian Capital Territory
10
Dynamic Test Protocol To Assess Rollover Crashworthiness
Grzebieta et al
6. References 1. Young, D., (2010), Protecting Occupants In Passenger Vehicle Rollover Crashes, PhD Thesis, Department of Civil engineering, Monash University. 2. Grzebieta R., Friedman D., Bozzini S., Shipp C., Jama H., (2009), Retrofitting For Rollover Crashworthiness Occupant Protection, Proceedings Road Safety Research, Policing and Education Conference, Sydney, Australia, November. 3. Grzebieta R.H., Young D., McIntosh A., Bambach M., Fréchède B., Tan G., Achilles T., (2007), Rollover Crashworthiness: the final frontier for vehicle passive safety, Proc. Road Safety Research, Policing and Education Conference, Melbourne, , (also published in Journal of the Australasian College of Road Safety, 19(2), May 2008, pp. 29-38 and corrected reprint in 20(2) May 2009, pp. 46-55). 4. Fréchède B., McIntosh A.S., Grzebieta R., Bambach M.R. (2010), Characteristics of single vehicle rollover fatalities in three Australian states (2000-2007), submitted for review to Accident Analysis and Prevention. th
5. Digges K. And Eigen A.M., (2007), Injuries in Rollovers by Crash Severity, 20 Int. Tech. Conf. on the Enhanced Safety of Vehicles (ESV), Paper Number: 07-0236, Lyon, France. (http://wwwnrd.nhtsa.dot.gov/pdf/esv/esv20/07-0236-O.pdf) 6. Gugler J. and Steffan H. (2006), Improvement of Rollover Safety for Passenger Vehicles, European Community – R&TD-Project – 5th Framework -Programme “Growth”, Contract No: G3RD-CT-200200802. 7. Mandell S.P., Kaufman R., Mack C.D., and Bulger W.M. (Mortality and injury patterns associated with roof crush in rollover crashes, Accid. Anal. Prev. (2010), doi:10.1016/j.aap.2010.02.013. 8. Young D., Grzebieta R.H., Rechnitzer G., Bambach M. & Richardson S., (2006) Rollover Crash safety: Characteristics and issues, Proc. 5th Int. Crashworthiness Conf. ICRASH2006, Bolton Institute U.K., Athens, Greece. 9. Young D., Grzebieta R.H., McIntosh A., Bambach A. & Frechede B. (2007) Diving vs Roof Intrusion: A Review of Rollover Injury Causation, International Journal of Crashworthiness, Vol. 12 No. 6 pp. 609–628. 10. Henderson, M. & Paine, M. (1998) Passenger Car Roof Crush Strength Requirements. Report for the Federal Office of Road Safety, Report number CR 176. 11. Rains, G. C. & Van Voorhis, M. A. (1998) Quasi Static and Dynamic Roof Crush Testing. Technical Report No. DOT HS 808 873, National Highway Traffic Safety Administration, Washington DC. 12. Mao, M., Chirwa, E. C., Chen, T., Latchford, J. & Wang, W. (2005) Numerical analysis of a small European v ehicle under rollover condition, Proceedings of the Institution of Mechanical Engineers, Part D: Journal of Automobile Engineering, Vol. 219, pp. 1369-1379. 13. Young D. and Grzebieta R.H., (2010), Vehicle roof strength as it relates to contained occupant injury prevention during rollover crashes, Proc. Australasian Road Safety Research, Policing and Education Conference, Canberra, Australia. 14. Friedman D. and Grzebieta R.H., (2009), A Proposed Rollover and Comprehensive Rating System, st Proc. 21 International Technical Conference on the Enhanced Safety of Vehicles, Stuttgart, Germany, Paper Number 09 -0515. 15. Brumbelow, M.L., Teoh, E.R., Zuby, D.S., McCartt, A.T., (2008), Roof Strength and Injury Risk in Rollover Crashes. Insurance Institute For Highway Safety, Arlington, VA 22201. March 2008. 16. National Highway Traffic Safety Administration (2009), Federal Register, Vol. 74, No. 90, Docket No. NHTSA 2009 -0093-1, May 12, 2009. 17. National Highway Traffic Safety Administration (2009), Final Regulatory Impact Analysis, FMVSS 216, Upgrade Roof Crush Resistance, April.
2010 Australasian Road Safety Research, Policing and Education Conference 31 August - 3 September 2010, Canberra, Australian Capital Territory
11
Dynamic Test Protocol To Assess Rollover Crashworthiness
Grzebieta et al
18. Paine M.M. and Newland C., (2009), Roof Strength and Occupant Protection in Rollover Crashes, Proceedings Road Safety Research, Policing and Education Conference, Sydney, Australia, November. 19. Brumbelow, M. L. & Teoh, E. R. (2009) Roof strength and injury risk in rollover crashes of passenger cars and SUVs. 21st International Technical Conference on the Enhanced of Safety of Vehicles, Stuttgart, Germany. 20. Chirwa C., Stephenson R.R., Batzer S.A., Grzebieta R.H., (2010), Review of the Jordan Rollover System (JRS) vis-à-vis other dynamic crash test devices, accepted for publication International Journal of Crashworthiness. 21. Hutchinson J. and Friedman K., (2008), Comparison Of The Jordan Rollover System With An Over The Ground Rollover, Proc. of IMECE2008 ASME International Mechanical Engineering Congress and Exposition Boston, USA. 22. Eigen, A. (2003) Examination of Rollover Crash Mechanisms and Occupant Outcomes, DOT HS 809 692, Washington, DC, 2003. 23. Eigen A.M., (2005), ‘Rollover Crash Mechanisms and Injury Outcomes for Restrained Occupants’, Mathematical Analysis Division, Office of Traffic Records and Analysis; National Center for Statistics and Analysis; National Highway Traffic Safety Administration, U.S. Department of Transportation, Washington, DC, Technical Report DOT HS 809 894. 24. Digges K.H., Eigen A.M. (2003) Crash Attributes That Influence the Severity of Rollover Crashes. Paper 231, Proceedings of the 18th International Technical Conference on the Enhanced Safety of Vehicles, Nagoya, Japan. 25. Jones, I.S., and Wilson L.A., (2000) Techniques For The Reconstruction Of Rollover Accidents Involving Sport Utility Vehicles, Light Trucks and Minivans, SAE Paper No. 2000-01-0851. 26. Orlowski, K.F., Moffatt, E.A., Bundorf R.T., Holcomb M.P., (1989), Reconstruction of Rollover Collisions, SAE Paper No. 890857, February 27-March 3. 27. Orlowski, K.F., Bundorf R.T., Moffatt E.A., (1985), Rollover Crash Tests – the Influence of Roof Strength on Injury Mechanics, SAE Paper No 851734. 28. Chou C C, McCoy R W, Le J, “A literature review of rollover test methodologies”, International Journal of Vehicle Safety, vol. 1 Nos. 1/2/3, 2005. 29. Tahan F., Digges K., Mohan P, (2010), Sensitivity Study of Vehicle Rollovers to Various Initial Conditions, Finite Element Model Based Analysis, The National Crash Analysis Center, George Washington University, Research Report, April, 2010. 30. Friedman D. and Grzebieta R.H., (2009), Vehicle Roof Geometry And Its Effect On Rollover Roof Performance, Proc. 21st International Technical Conference on the Enhanced Safety of Vehicles, Stuttgart, Germany, Paper Number 09 -0513. 31. Chen T., Chirwa E.C., Mao M., Latchford J., Rollover Far Side Roof Strength Test and Simulation, International Journal of Crashworthiness, Vol. 12 No. 1 pp. 29-39. 32. Cooperrider, N.K. Thomas T.M., Hammond S.A., (1990), Testing and Analysis of Vehicle Rollover Behaviour, SAE Paper 900366. 33. Friedman, D. & Nash, C. E. (2001), Advanced roof design for rollover protection, Proc. 17th International Conference on the Enhanced Safety of Vehicles, Paper No. 01-S12 -W-94, 2001, Amsterdam, Netherlands. 34. Bahling G. S., Bundorf R. T., and Kaspzyk G.S., Moffatt E. A., Orlowski, K. F., and Stocke, J. E., (1990) Rollovers and Drop Tests- The Influence of Roof Strength on Injury Mechanics Using Belted Dummies, SAE Paper No. 902314, 34th Stapp Car Crash Conference Proceedings, pp. 101-112. 35. Mao M., Chirwa E.C., Wang W., (2006), Assessment of Vehicle Roof Crush Test Protocols Using FE Models: Inverted Drop Tests Versus Updated FMVSS No. 216, International Journal o f Crashworthiness, Vol. 11 No. 1 pp. 49-63.
2010 Australasian Road Safety Research, Policing and Education Conference 31 August - 3 September 2010, Canberra, Australian Capital Territory
12