Wireless Standards Committee. In addition to the above standards, ZigBee [3] is also a technology that has been developed with the aim to meet the growing ...
Dynamic Topology Control for WSNs in Critical Environments Zinon Zinonos, Vasos Vassiliou, Christiana Ioannou, and Marios Koutroullos Networks Research Laboratory Department of Computer Science University of Cyprus Nicosia, Cyprus Email: {zinonos, vasosv, cioannou, koutroullos}@cs.ucy.ac.cy
Abstract—Plant automation and control are mission-critical applications and require timely and reliable data delivery, which is difficult to provide using a wireless technology. This is especially more difficult in industrial environments with harsh radio conditions. In this paper we present a dynamic and distributed topology control algorithm for Wireless Sensor Networks for use in performance critical environments. This topology control algorithm assumes a small number of sensor nodes connected to a single sink and communicating using a TDMA-based MAC protocol designed with the application requirements in mind. Our solution was implemented and evaluated in real testbed inside an oil refinery. Evaluation results demonstrating the selforganizing properties of the proposed mechanism, as well as its operational performance are included. The results show that the system reliability is high and that data are delivered on time to the control center.
Keywords: Topology Control, Tree Construction, Performance Control, Wireless Sensor Networks I. I NTRODUCTION Nowadays, Wireless Sensor Networks (WSNs) are increasingly emerging as a viable solution to support industrial applications. The deployment of cabled systems to support those applications is not always desirable, given that these systems require the installation of thousands of cables in environments that in most cases are harsh. To overcome the aforementioned drawback, a wireless solution is highly advantageous. Wireless communication eases the deployment of nodes, while decreasing the installation and upgrade cost as well. Wireless technology holds great potential for many applications, as evidenced by the number of wireless-enabled devices currently coming to market. Furthermore, at the heart of the industrial wireless movement are the widely publicized standardization efforts - e.g. WirelessHART [1] and ISA100 [2] both of which promise to enable more widespread adoption of wireless systems. One of the key milestones WirelessHART has reached in recent months, was its March 2010 approval by the International Electrotechnical Commission (IEC), as a full international standard (IEC 62591Ed. 1.0). The approval This paper has been accepted for publication in the proceedings of the 3rd WSN Workshop 2011 that had been held in conjunction with NTMS 2011.
makes WirelessHART the first international standard for wireless communication in process automation. The ISA100 family of standards is an end-user-driven, complementary family of standards that address important marketplace requirements. It was approved in September 2009 by the ISA100 Industrial Wireless Standards Committee. In addition to the above standards, ZigBee [3] is also a technology that has been developed with the aim to meet the growing demand for wireless-enabled networking between numerous low-power devices. ZigBee is a low data rate, low power consumption, low cost, wireless networking protocol targeted towards automation and remote control applications. In industry, ZigBee is being used for next generation automated manufacturing, with small transmitters in every device on the floor, allowing for communication between devices to a central computer. However, the ZigBee technology does not seem to be able to support the strict requirements of industrial applications, like network robustness, reliable message delivery, end-to-end wireless communication delay, and integrity and generally it cannot quarantee the performance of the network. WirelessHART tried to address some of the main concerns raised by the industry towards ZigBee. By supporting mesh networking with graph routing WirelessHART provides path redundancy and self-healing properties in a way to limit the effect of broken links. In addition, Frequency Hopping Spread Spectrum (FHSS) allows WirelessHART to hop across the 16 channels defined in the IEEE802.15.4 standard in order to avoid interference. The main disadvantage of the WirelessHART is that is a centralized solution with extra network entities needed to support its functionalities. One of the desirable functionalities of these wireless technologies is the plug-and-play feature that nodes could have. To achieve this, dynamic topology control models are required, which can assure the automatic construction of a reliable communication network. The placement of the nodes inside a field area depends on the physical environment of the area; which that makes the network irregular. Therefore, the challenge of topology control is to deal with these limitations without affecting the performance of the network. The results of an OnWorld poll [4] based on interviews with
105 plant managers, process integrators and system engineers are clearly indicative of the end users’ concerns and show that data reliability ranks as the primary concern for 95.5% of the participants for the adoption of wireless sensor networks in industrial applications The reliability of the constructed network is one of the main targets of this work, which tries to enable multi-hop WSN operation in an industrial environment with strict requirements on message delivery latency and reliability. The proposed Dynamic Topology Control utilizes a TDMA MAC protocol to construct and maintain a tree-based topology network, instead of a mesh-topology network as in the standards mentioned above. The importance of this work is that the dynamic topology control, builds the system in a distributed self-organizing manner, and not centralized as WirelessHART, and that the evaluation is performed in a real testbed environment, inside a refinery, where different parameters like noise and interference can change from time to time. Another advantage of the proposed solution is that, it is quite simple (but not trivial), while at the same time it achieves the desired performance results in terms of data reliability. The rest of the paper is organized as follows: Section 2 presents the relevant TDMA-based MAC protocol. Section 3 presents our proposed topology control mechanism, while Section 4 explains the the evaluated scenario. Section 5 presents the practical evaluation as well as the obtained results, and Section 6 concludes the paper.
0 0-0-0
1
2
3
1-0-0
4
5 1-1-0
10
6 1-2-0
7 2-1-0
11 1-1-1
3-0-0
2-0-0
12 1-2-1
13 2-1-1
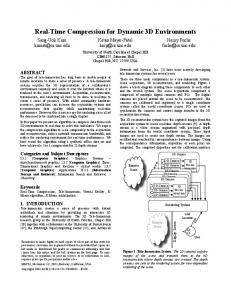
Fig. 1.
8 2-2-0
14 2-2-1
3-2-0
15 3-1-1
3-2-1
3-2-1 Tree Topology Child 1
Sink
9 3-1-0
Child 2
Advertisements select address to join Confirm joins
select address to join
Join requests
Join ACK attached to tree Advertisements
attached to tree Advertisements
II. P ERFORMANCE G UARANTEEING MAC P ROTOCOL The MAC protocol [5] used as the underlying mechanism is a TDMA-based protocol developed in the context of the EU FP7 project GINSENG [6]. GinMAC assumes that data is forwarded hop-by-hop towards a sink within a tree topology consisting of n nodes. The time axis is divided into fixedlength base units called epochs. Each epoch E is subdivided into k * n time slots for a network of at most n sensor nodes. Each node is assigned k exclusive slots per epoch E (sufficient to successfully forward messages from the node and its children in one epoch). A network dimensioning process is carried out before the network is deployed. The inputs for the dimensioning process are the network and application characteristics, which are known before deployment. The output of the dimensioning process is a TDMA schedule with frame length F that each node has to follow. The topology can be modeled as a tree, as shown in Fig. 1. A reasonable small number of nodes can be expected (N < 30) of which N is directly proportional to the required communications delay bound; the smaller the required delay, the smaller the N. Larger networks can be divided into smaller networks with additional in-field data collection stations (sinks). The maximum number of hops H can be expected to be small (H < 4), while most nodes will be within one or two hops from the sink. All communication sent between nodes within the network should travel via the sink. As a TDMA protocol, time synchronization is necessary. For this purpose, a node listens every k frames
Fig. 2.
Message Sequence Diagram of the Topology Control Mechanism
in the first slot that its parent node transmits data upstream. Thus, all nodes synchronize their time with the sink. Every node must always transmit a packet in the first slot used for upstream data, sending a ”dummy” packet (a packet without payload) if no data is available. The packet header contains information on how many packets the sender has to transmit in the current frame. III. P ROPOSED DYNAMIC T OPOLOGY C ONTROL (DTC) M ODEL The goal of the proposed dynamic topology control is to connect all nodes in the network and organize them in a tree structure topology to serve the needs of the MAC protocol. In our work, we do not assume any central entity that has full knowledge of the network and will be responsible for constructing the topology. The decision is made locally by each sensor node. The topology is constructed in a distributed manner while the nodes use the same transmission power during the construction phase. We can describe our basic topology control algorithm as a distributed homogeneous algorithm that produces a tree topology based on good links. Figure 1 presents an example
of a supported tree with the structure of 3-2-1 able to support 16 nodes (including the sink) Different tree structures, in terms of number of levels and children per level, can be used in order to support any number of nodes. Regarding the topology construction, we use MAC signaling (control messages) in order to discover our neighbors. The discovery of the neighbor nodes (parent and children) is done by the exchange of advertisement control messages (ADVERT). The first node that starts sending advertisement messages is the sink node. The advertisements are broadcast messages that advertise specific children tree positions. The advertisements are sent in the downstream slot of the epoch. When a node (not the sink) is firstly switched on it initializes during the first epoch and sets all the slots of the node in ”scan mode” so that to receive advertisements. Upon receiving an advertisement, the MAC will pass this packet to the topology control module running in each node, which will process the packet and select randomly a tree address to be attached. Then, the node will send a JOIN control packet to the advertiser node asking a confirmation to use the specific tree address. In case that a new node receives more than one advertisements it will select to join in the address with the best RSSI value and closest to the sink node (minimum number of hops from the sink). In the case that two different nodes select to join at the same tree address there will be a collision and the nodes will back-off and select a tree address again in the next epoch. Upon accepting a join request, the parent node will create a join acknowledgement packet (JOIN ACK) and send it to the child node. A child node receiving the join acknowledgement changes its status to attached and starts sending data upstream as well as advertising its children positions (if any). If the node is a leaf node it can not support child positions thus it is not sending advertisement. In order to keep track of the node state each node maintains a list where it keeps information about its children and free position(s). If the node does not receive any advertisements during its initialization phase it sets all the slots in idle mode and wakes up after a predefined time to listen for advertisement messages and repeat the above procedure. Figure 2 depicts the messages exchanged during the construction phase of the proposed topology control. We can characterize the tree nodes with their decoded addresses. For example 3-0-0 is the decoded address where it means that is the third child of the sink node. A. Tree Construction Delay In order for one node to be attached to the parent node three messages must be exchanged: ADVERT, JOIN, JOIN ACK. The time to transmit the messages is strongly dependent on the MAC frame size. The time duration of this frame is called epoch. The duration of the epoch is depended on the tree structure. The MAC frame is consisted of a number of slots with two directions: upstream and downstream. In our case upstream slots are used to send the JOIN request messages while downstream slots are used to send the ADVERT and the JOIN ACK messages. The upstream slots are located first
inside the MAC frame and the downstream slots at the end of it. More details about how the MAC frame is constructed can be found in [5]. To calculate the best-case tree construction time we have to consider the E: epoch duration, the L: layer level, the H is the three depth, the M : required number of control messages, and S: synchronization delay. Tree Construction Time: H X S+ E×L×M (1) L=1
IV. S CENARIO D ESCRIPTION The immediate target of this work is an oil refinery which aims to apply an efficient and trustable solution, taking advantage of all the benefits that WSNs are capable to bring. Fast and easy deployment, portability, small size and low cost are the most attractive benefits. Three main scenarios were defined: the production monitoring scenario, the pipeline leak detection scenario, and the personnel safety scenario. To better understand the strong requirements of timeliness and reliability a thorough analysis of application scenarios was performed, outlining the special characteristics that WSNs require for performance and mission-critical environments. In our evaluation, we consider only the production monitoring scenario. The specific scenario is an example of an indicatory system where data must arrive to the control center within a given time frame and with a given reliability. Based on the arrived information the control center technicians can proceed with their decisions. As in all indicatory systems, the main requirement is for the information to arrive to the control center in a timely fashion so that to be useful for the technicians for further actions. In our scenario, we consider that the information should not arrive to the control center in more than three seconds. Although packet losses should be minimized, this application can tolerate a small amount of packet loss, which means 99% of packet delivery. The lifetime of the network is also very important as it corresponds to the radio duty cycle of a node. We have chosen an expected lifetime of around 200 days (6˜ months) meaning about 2% of radio duty cycle (using TelosB nodes). Note that a 2% radio duty cycle is a very challenging value as most existing deployments have much higher radio duty cycles. Our scenario does not consider any mobile nodes. The above targeted values are defined based on the existing cable system of the oil refinery. More details on the scenarios and applications used to drive this work can be found in [7]. V. E VALUATION To evaluate the proposed dynamic topology control mechanism a number of tests were conducted on a real testbed, deployed inside the refinery area. The sensors were deployed as part of the production monitoring scenario and were configured to send their readings to the sink every one second, through the constructed tree topology. The tests were mainly performed to evaluate the tree construction process in terms of the time taken to construct the
End-to-End Delay per Node Average Time to Attach to Tree 30000
1000
Average Conf Interval 95% Level 3
Time (ms)
Level 1
800 End-to-End Delay(ms)
25000
20000
Average Conf Interval 95%
900
Level 2
15000
10000
Level 1
Level 2
Level 3
700 600 500 400 300
5000
1
1
23-
1
22-
1
21-
1
13-
1
12-
0
11-
0
23-
0
22-
0
21-
0
13-
0
12-
0
11-
03-
0
0-
0-
2-
1-
100
0
1
1
23-
1
22-
1
21-
1
13-
1
12-
0
11-
0
23-
0
22-
0
1-
2-
0
3-
1-
0
12-
0
11-
0
03-
0-
1-
2-
0-
0
200 0
Tree Address
Tree Address
Fig. 3.
Average Attachment Time
Fig. 5.
Active Duty Cycle
End-to-End Delay
Packet Loss Ratio per Node
5
1.4
Average Conf Interval 95%
Level 1
Average Conf Interval 95%
Level 2
1.2 4
Level 3 1
Level 3
Packet Loss Ratio(%)
Percentage(%)
Level 2 3 Level 1 2
0.8 0.6 0.4 0.2
1
Tree Address
Fig. 4.
Node Duty Cycle
tree topology and the number of nodes that have been attached. In addition, we monitored the performance of the network and collected results of delay, active duty cycle, and packet losses. Table I contains a summary of all experimental results. All the results in the figures are presented with a confidence interval of 95%. There were 14 nodes and 16 available tree positions (Node 1 is always connected as the sink). The testbed was operated for 24 hours and during this time we rebuilt the tree several times in order to obtain values from different topologies. Given the close range of several of the sensor nodes, it was possible for nodes to assume many positions in the tree since they had a lot of neighbors and many possible associations. We managed to connect all 14 nodes in 17 out of 20 tests. The average tree construction time for the case of a full tree is about 11.02 seconds. We consider that this is a satisfactory time interval for the tree self-organization. This value corresponds to the time between the first advertisement from the sink until the join of the last node to the tree (reception of a JOIN ACK). Fig. 3 shows the average attachment time for all nodes based on their tree position. Based on those results
21
21
3-
21
2-
1-
11 3-
11 2-
11 1-
20 3-
20 2-
20 1-
10 3-
10 2-
10 1-
00 3-
00 2-
1-
-0.2
00
1 23-
1 22-
1 21-
1 13-
1 1-
1 1-
2-
0 2-
1-
0
0
2-
3-
2-
0
21-
0
13-
12-
0 11-
0 03-
0 0-
01-
2-
0
0 0
Tree Address
Fig. 6.
End-to-End Packet Loss
it is obvious that the average attachment time is increasing as the distance from the sink is increasing. The tree construction time is definitely related to the epoch duration, which depends on the number of required slots, which in turn are based on the tree size. As the tree is structured as a 3-2-1 tree the epoch number was 1 second. A different tree structure would have had a different construction time, as can be shown also using equation 1. The construction time can also be reduced if the number of slots per epoch is further optimized. In addition, since in some tests (3 out of 20) a number of nodes were left out of the tree, we can conclude that there is a need of a maintenance and optimization mechanism to guarantee the connection of all the nodes. This is part of our continued work on the subject. Fig. 4 shows the active duty cycle of each node. By active duty cycle we mean the percentage of time a node was either transmitting or receiving packets. The average node duty cycle across all nodes is 2.04%. The active duty cycle depends on the tree level a node belongs to. Nodes located at one hop from the sink have an average duty cycle of 3.77% where nodes two hops away have an average duty cycle of 1.91%
and nodes with three hops away have an average duty cycle of 1.3%. Based on the MAC slot allocation the nodes that are closer to the sink are assigned more slots since each node requires a slot for each child node plus one slot for its own data for forwarding to its parent. Therefore, as we move closer to the sink, nodes have to stay up longer in order to serve both themselves and their children. In addition to the above, we measured the average packet delay during the operation of the testbed and found it to be equal to 459 ms. The delay does not seem to have any dependence on the tree level of the nodes (Fig. 5). Since the target of this work is to provide controlled performance we also measured the end to end packet loss in order to ascertain the reliability of the system. As mentioned above the operations in refinery are very critical thus the reliability of information is important. The average end to end packet success ratio is equal to 99.88% meaning that only 0.12% of the packets were not successfully delivered to the sink node (or 1.2x10⁻³ packet loss). Fig. 6 shows the packet loss rate per tree position. Both the delay and packet loss values compare with the publicized performance of WirelessHART and ISA100 [8] [9]. We should note, however, that the solution presented here is much simpler than the industrial solutions it compares to and that it does not include any optimizations, such as queue management, radio channel monitoring, or power control, which have also been under consideration. TABLE I E XPERIMENTAL RESULTS Tree address 1-0-0 2-0-0 3-0-0 1-1-0 2-1-0 3-1-0 1-2-0 2-2-0 3-2-0 1-1-1 2-1-1 3-1-1 1-2-1 2-2-1 3-2-1
Average Attachment Time (ms) 4680.00 5430.00 4263.33 7940.00 9366.66 10979.09 7106.66 10336.36 11800.90 13149.16 19450.83 21898.57 16856.62 23424.28 26370.00
Std. Dev. 1477.09 2261.33 1164.50 2632.83 3576.01 4052.22 1505.04 3931.22 4392.14 3719.87 6088.27 3286.50 6875.53 9678.63 5727.12
Average Delay (ms) 405.07 561.27 684.06 376.53 351.26 462.09 220.53 401.38 829.36 404.13 408.13 481.71 246.59 385.88 666.89
Std Dev. 91.13 145.30 242.61 27.91 115.80 203.69 98.57 123.81 12.61 163.10 82.11 182.86 108.20 27.91 122.54
Average Duty Cycle(%) 3.91 4.01 3.39 2.03 2.01 1.58 1.86 2.07 1.89 1.24 1.28 1.57 1.36 1.29 1.09
Std. Dev. 0.85 0.59 0.66 0.43 0.29 0.24 0.41 0.90 0.71 0.62 0.43 0.77 0.48 0.33 0.26
Average Packet Loss(%) 0.27 0.18 0.26 0.00 0.15 0.11 0.03 0.18 0.04 0.03 0.00 0.12 0.08 0.10 0.13
Std. Dev. 0.45 2.29 0.51 0.58 1.00 0.78 1.82 1.03 0.99 1.49 0.70 2.08 1.69 1.37 2.24
Given that our topology is tree based, it is expected that some performance parameters may be affected by the node’s position on the tree and, as a consequence, to the tree level. Table II summarizes the results based on tree level. TABLE II E XPERIMENTAL RESULTS Tree Level 1 2 3
Theoretical Best-Case Attachment Time (ms) 3000 6000 9000
Average Attachment Time(ms) 4791.11 9588.28 20191.58
Average Duty Cycle(%) 3.77 1.91 1.30
This behavior also affects the average duty cycle of layer three nodes. The fact that they have to extend the attachment phase increases the time they stay on for transmitting, thus increasing their duty cycle from a possible 1% to 1.3%.
Finally, Table III compares the requirement values that were set during the definition of the evaluated scenario and the actual values that were obtained from the testbed evaluation of the scenario inside the oil refinery. Based on the comparison, we can conclude that our solution managed to meet the strict performance requirements defined. TABLE III T ESTBED VALUES VERSUS REQUIREMENTS VALUES Metric Average Duty Cycle Average Delay Average Packet Loss
Testbed values 2.04(%) 459 ms 0.12(%)
Requirement values 2(%) 3000 ms 1(%)
VI. C ONCLUSION In this paper, we proposed a decentralized dynamic topology control algorithm capable to construct tree-based topologies using wireless sensors for use in performance critical applications. The proposed solution was tested in the hazardous environment of an oil refinery, where the deployment and maintenance of wired systems are difficult and expensive. Based on our results we can construct 3-2-1 tree, in an average of about 11 seconds. Our evaluation showed that the proposed dynamic topology control algorithm did not influence negatively the energy consumption of the nodes and that the data messages were delivered to the sink node with high reliability (99.88%) within certain time limits (460ms). In the future, we plan to extend the topology control construction algorithm with maintenance and optimization functions to be able to handle more complex scenarios and situations including also limited mobility and contention-based MAC protocols. VII. ACKNOWLEDGEMENTS The research leading to these results has received funding from the European Community Seventh Framework Programme (FP7/2007-2013) under grant agreement n 224282. We acknowledge all GINSENG partners for creating the first version of the GINSENG platform. Special thanks to Jose D’Or of Petrogal for helping us run the on-site experiments. R EFERENCES [1] Wireless HART, www.hartcomm.org/protocol/wihart/wirelesstechnology.html [2] ISA-100.11a-2009: Wireless Systems for Industrial Automation: Process Control and Related Applications, http://www.isa.org/ISA100/ [3] W. C. Craig, Zigbee: ”Wireless Control That Simply Works”, White paper, ZigBee Alliance. [4] M. Hatler, D. Gurganious, and C. Chi, ”Industrial Wireless Sensor Networks, A Market Dynamics Report”, March 2010, ONWorld Report [5] P. Suriyachai, J. Brown, U. Roedig, ”Time-critical data delivery in wireless sensor networks”, 6th IEEE International Conference on Distributed Computing in Sensor Systems (DCOSS ’10), IEEE, 2010. [6] GINSENG Project - www.ict-ginseng.eu [7] ”D1.3.: Final GINSENG Architecture, Scenarios and Quality of Service Measures”, GINSENG-Performance Control in Wireless Sensor Networks, http://www.ict-ginseng.eu/ October, 2010 [8] Control with WirelessHART, Hart Communication Foundation Technical Report HCFLIT-127, March 5, 2010 [9] G. McMillan, ”Is Wireless Process Control Ready for Prime Time?” CONTROL Magazine, May 2009. Available from www.controlglobal.com/articles/2009/WirelessProcessControls0905.html