Dynamic transcriptomes during neural differentiation of human embryonic stem cells revealed by short, long, and paired-end sequencing Jia Qian Wua,1,2, Lukas Habeggerb,1, Parinya Noisac, Anna Szekelyd, Caihong Qiue, Stephen Hutchisonf, Debasish Rahag, Michael Egholmf, Haifan Line, Sherman Weissmand, Wei Cuic, Mark Gersteinb,h,i, and Michael Snydera,2 a Department of Genetics, Stanford University School of Medicine, Stanford, CA 94305; bProgram in Computational Biology and Bioinformatics, Yale University, New Haven, CT 06511; cInstitute of Reproductive and Developmental Biology, Imperial College London, Hammersmith Hospital, W12 ONN London, United Kingdom; dDepartment of Genetics, Yale University, New Haven, CT 06511; eYale Stem Cell Center, Yale University, New Haven, CT 06509; f454 Life Sciences Sequencing Centre, Branford, CT 06405; and Departments of; gMolecular, Cellular and Developmental Biology, hMolecular Biophysics and Biochemistry, and iComputer Science, Yale University, New Haven, CT 06511
Edited* by Joseph R Ecker, Salk Intstitute, La Jolla, CA, and approved January 26, 2010 (received for review December 8, 2009)
To examine the fundamental mechanisms governing neural differentiation, we analyzed the transcriptome changes that occur during the differentiation of hESCs into the neural lineage. Undifferentiated hESCs as well as cells at three stages of early neural differentiation—N1 (early initiation), N2 (neural progenitor), and N3 (early glial-like)—were analyzed using a combination of single read, paired-end read, and long read RNA sequencing. The results revealed enormous complexity in gene transcription and splicing dynamics during neural cell differentiation. We found previously unannotated transcripts and spliced isoforms specific for each stage of differentiation. Interestingly, splicing isoform diversity is highest in undifferentiated hESCs and decreases upon differentiation, a phenomenon we call isoform specialization. During neural differentiation, we observed differential expression of many types of genes, including those involved in key signaling pathways, and a large number of extracellular receptors exhibit stage-specific regulation. These results provide a valuable resource for studying neural differentiation and reveal insights into the mechanisms underlying in vitro neural differentiation of hESCs, such as neural fate specification, neural progenitor cell identity maintenance, and the transition from a predominantly neuronal state into one with increased gliogenic potential. RNA-Seq
| splicing isoforms | unannotated transcripts | neuron | glial
N
eural commitment and subsequent differentiation is a complex process. Although the complexity of RNAs expressed in neural tissues is very high (1, 2), a comprehensive analysis of the genes and RNA isoforms that are expressed during the different stages of neural cell differentiation is largely lacking. Such information is expected to be important for understanding mechanisms of neural cell differentiation and ultimately providing therapeutic solutions for neural degenerative diseases, such as Parkinson’s and Alzheimer’s disease. Our current knowledge of the mechanisms involved in neural cell formation is derived mostly from studying neurogenesis in the developing embryos of animal models (3, 4). However, neurogenesis in animals is a complex process involving many different cell types that differentiate asynchronously. This heterogeneity, along with the relatively small number of cells that can be readily obtained, makes the analysis of the temporal differentiation of individual cell types extremely difficult. One solution is to analyze hESCs during in vitro differentiation to different stages of neural development, which can be performed using a relatively large numbers of cells (5–9). Analysis of the transcriptome in these cells is expected to provide insights into the mechanisms and pathways involved in early cell fate specification, such as the acquisition of neurogenic potential and the transition to gliogenic potential, which may ultimately be extremely
5254–5259 | PNAS | March 16, 2010 | vol. 107 | no. 11
useful for pharmacologic screening and neurodegenerative disease therapies. Many high-throughput methods have been used previously to study global transcription (10–14). The recent development of massively parallel sequencing of short reads derived from mRNA (RNA-Seq) makes it possible to globally map transcribed regions and quantitatively analyze RNA isoforms at an unprecedented level of sensitivity and accuracy (15–22). Although the use of short reads enables detection of transcribed regions and spliced adjacent exons, it has limitations. In particular, the relationship of nonadjacent exons and multiple exons within the same transcript cannot be deduced. In this study we combined the strengths of several massively parallel sequencing technologies, including short Illumina single and paired-end reads (sequence reads from both ends of cDNA fragments; 35-bp reads) and longer Roche 454 FLX and Titanium sequencing reads (250–450-bp reads) to discern transcript structure and analyze transcriptome complexity at an unprecedented level (21, 23, 24). We applied these technologies to the analysis of early stages of neural differentiation of hESCs. Our results revealed an extraordinary degree of stage-specific transcription and splicing. From more than 150 million uniquely mapped sequence reads, we found thousands of unannotated transcriptionally active regions (TARs) and unannotated isoforms. Some unannotated TARs and splice isoforms are transcribed only at particular stages, implying functional roles in specific steps of neural differentiation. Moreover, we describe a phenomenon we call isoform specialization, whereby splicing isoform diversity is the highest in undifferentiated hESCs and decreases in cells undergoing neural differentiation. Finally, the characterization of dynamic changes of gene transcription levels has provided important insights into the in vitro neural differentiation of hESCs with regard to neural specification, neural progenitor identity maintenance, and the transition from a predominantly neuronal nature to one with increased gliogenic potential.
Author contributions: J.Q.W., S.W., and M.S. designed research; J.Q.W., L.H., P.N., A.S., C.Q., and S.H. performed research; L.H., P.N., A.S., C.Q., D.R., M.E., H.L., W.C., and M.G. contributed new reagents/analytic tools; J.Q.W. and L.H. analyzed data; and J.W., L.H., and M.S. wrote the paper. The authors declare no conflict of interest. *This Direct Submission article had a prearranged editor. Data deposition: Data were submitted to Gene Expression Omnibus (GEO; accession number GSE20301). 1
J.Q.W and L.H contributed equally to this work.
2
To whom correspondence may be addressed. E-mail:
[email protected] or
[email protected]. This article contains supporting information online at www.pnas.org/cgi/content/full/ 0914114107/DCSupplemental.
www.pnas.org/cgi/doi/10.1073/pnas.0914114107
RNA-Seq at Specific Stages of Neural Differentiation of hESCs. We
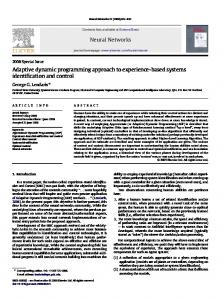
characterized changes in the transcriptome profiles during early human neural differentiation using H1 hESC cultures. Two differentiation strategies were used (Fig. 1, Materials and Methods, and SI Text). In approach A, the hESC H1 line was differentiated and cultured using feeder-free chemically defined adherent cell culture system through three stages: N1, an initiation stage; N2, a neural progenitor cell (NPC) stage that produces only neurons upon further differentiation; and N3, which produces both neurons and glial cells (Fig. 1 A and B) (7, 8, 25). In approach B, neural progenitors (N2-B) were generated from undifferentiated H1 hESCs via embryoid body-like neurosphere formation (SI Text) (9). In each case, we used standard protocols involving bone morphogenic protein signaling antagonists (Noggin) and basic fibroblast growth factor (bFGF) (Materials and Methods). According to qualitative and quantitative analyses, the differentiation protocols were highly reproducible. The derived cell populations from each preparation were characterized by both immunoassays and FACS analysis for a large variety of markers to ensure that the cell cultures were highly homogeneous at the various stages (Fig. 1 and SI Text). (i) Undifferentiated hESCs (present in both approaches A and B) expressed all hESC surface antigens (e.g., TRA-1-60/81 and SSEA4) as well as transcription factors OCT4 and SOX2 (Fig. 1C and SI Text). (ii) N1 initiation stage cells (present only in approach A) lost TRA-1-60/ 81 expression but were still positive for SSEA4, although at a lower level, and began to express SSEA1. They also expressed OCT4 at a low level (SI Text). (iii) N2 NPCs generated by approach A lost OCT4 as well as SSEA4 expression (SI Text) but expressed NESTIN, PAX6, and SOX1 (Fig. 1B). The cells showed a typical morphology of NPCs: bipolar with small soma (Fig. 1A and SI Text). Glial fibrillary acidic protein (GFAP) was not expressed (Fig. 1B and SI Text). Upon withdrawal of growth
A
Noggin hESCs
Noggin
bFGF/EGF
N1 1 wk
2-3 wks
N3
4-10 wks
>15 wks
N2
Pax6/Dapi
Tuj1
GFAP
Tuji/GFAP/Dapi
N3
Nestin/Dapi
GFAP
vious studies (10, 14, 27), thousands of unannotated TARs were identified. Specifically, if a TAR overlapped with University of California, Santa Cruz (UCSC) gene annotation it was categorized as “known,” and if there was no overlap it was classified as
A
B
Tuji/GFAP/Dapi
SOX2
DAP1
C
N2
ES
C
-bFGF/EGF
Sox1/Dapi
NESTIN
of cells at the specific differentiation stages, we generated a combination of 35-bp single reads, 35-bp paired-end reads, and 250–450-bp long reads. The paired-end reads were from cDNA fragments of different lengths, ≈300 bp, 300–600 bp, and 600– 1,000 bp. A total of 140, 15, and 1.5 million uniquely mapped single, paired-end, and long reads, respectively (summarized in Table S1), were generated from two to three biologic replicates from each of the differentiation stages (Spearman correlations: 0.94–0.97). The fraction of genes detected at 1-fold average coverage approached saturation for the sequencing of hESC-B and N2-B cells (Fig. 2A). We achieved extensive sequence depth primarily with the 35-bp single reads; the paired-end and 250–450-bp reads provided longer-range exon connectivity information and aided in defining complex splice isoforms. Longer reads, particularly 450-bp reads, can link up to eight exons (see Fig. 2B for distribution). Fig. 2C illustrates the structure of a 16-exon gene that was constructed using a combination of the sequencing technologies. Identification of Unannotated Transcribed Regions and Their Connectivity Using Paired-End Reads. Consistent with our pre-
+bFGF/EGF
B
Tuj1
Complex Gene Structure Revealed Through the Integration of Short, Long, and Paired-End Sequences. To characterize the transcription
bFGF/EGF N2
Time 0
factors, the N2 cells predominantly differentiated into neurons rather than glial cells, as indicated by the expression of neuronal marker TUJ1 (Fig. 1B). Similarly, >95% of N2 neural precursors generated by approach B expressed an array of neural markers (neuroepithelial marker PAX6, neural stem cell markers NESTIN, and SOX2, as well as neuronal stem/precursor markers MUSASHI) (Fig. 1C and SI Text). The N2 cell populations were negative for pluripotent hESC markers such as OCT4 (2fold) in N2 cells compared with hESCs. (B) Quantification of dynamic transcriptome changes during neural differentiation process [x axis: differentiation stages hESC, N1, N2, and N3; y axis: log2(gene expression values by RNA-Seq)]. Twenty-seven patterns were identified from clustering the expression changes of the UCSC gene annotation set. U, up-regulation; D, down-regulation; F, flat (