Received: 18 January 2016
Revised: 16 August 2016
Accepted: 7 November 2016
DOI: 10.1002/cpe.4067
RESEARCH ARTICLE
Dynamic Voltage and Frequency Scaling-aware dynamic consolidation of virtual machines for energy efficient cloud data centers Patricia Arroba1,2
José M. Moya1,2
1 Laboratorio de Sistemas Integrados (LSI), Departamento de Ingeniería Electrónica, Universidad Politécnica de Madrid, Madrid, Spain 2 CCS - Center for Computational Simulation, Universidad Politécnica de Madrid, Madrid, Spain 3 DACYA, Universidad Complutense de Madrid, Madrid, Spain 4 Cloud Computing and Distributed Systems (CLOUDS) Laboratory, Department of Computing and Information Systems, The University of Melbourne, Melbourne, Australia
José L. Ayala3
Rajkumar Buyya4
Summary Computational demand in data centers is increasing because of the growing popularity of Cloud applications. However, data centers are becoming unsustainable in terms of power consumption and growing energy costs so Cloud providers have to face the major challenge of placing them on a more scalable curve. Also, Cloud services are provided under strict Service Level Agreement conditions, so trade-offs between energy and performance have to be taken into account. Techniques as Dynamic Voltage and Frequency Scaling (DVFS) and consolidation are commonly used to reduce the energy consumption in data centers, although they are applied independently and their effects on Quality of Service are not always considered. Thus, understanding the relationship between power, DVFS, consolidation, and performance is crucial to enable energy-efficient
Correspondence Patricia Arroba, Laboratorio de Sistemas Integrados (LSI), Departamento de Ingeniería Electrónica, Universidad Politécnica de Madrid, Spain. Email:
[email protected]
management at the data center level. In this work, we propose a DVFS policy that reduces power consumption while preventing performance degradation, and a DVFS-aware consolidation policy that optimizes consumption, considering the DVFS configuration that would be necessary when mapping Virtual Machines to maintain Quality of Service. We have performed an extensive evaluation on the CloudSim toolkit using real Cloud traces and an accurate power model based on data
Funding Information Spanish Ministry of Economy and Competitiveness, Grant/Award Number: TEC2012-33892, IPT-2012-1041-430000, RTC-2014-2717-3; Australian Research Council (ARC)
gathered from real servers. Our results demonstrate that including DVFS awareness in workload management provides substantial energy savings of up to 41.62% for scenarios under dynamic workload conditions. These outcomes outperforms previous approaches, that do not consider integrated use of DVFS and consolidation strategies. KEYWORDS
cloud computing, DVFS, dynamic consolidation, energy optimization, green data centers
1
INTRODUCTION
increasing power demand of up to 70% in metropolitan areas, where the power density is becoming too high for the power grid.8 In 2 or 3
The trend towards Cloud computing has lead to the proliferation of
years, the 95% of urban data centers will experience partial or total out-
data centers because they are the infrastructure that provides this
ages incurring in annual costs of about US$2 million per infrastructure.
new paradigm of computing and storage. Reference companies such as
The 28% of these service outages are expected to be due to exceeding
Amazon,1
the maximum capacity of the grid.9
Google,2
Microsoft,3
and Apple4
have chosen this computa-
tional model where information is stored in the Internet Cloud offering
Besides the economical impact, the heat and the carbon footprint
services more quickly and efficiently to the user. Cloud market oppor-
generated by cooling systems are dramatically increasing and they are
tunities in 2013 were supposed to achieve up to $150 billion,5 but the
expected to overtake the emissions of the airline industry by 2020.10
rising price of energy had an impact on the costs of Cloud infrastruc-
The cooling infrastructure is needed to ensure that IT operates within
tures, increasing the Total Cost of Ownership and reducing the Return
a safe range of temperatures, ensuring reliability. The energy efficiency
on Investment.
of novel cooling technologies, as water-based cooling, heat reusing,
Nowadays, data centers consume about 2% of the worldwide energy production,6
originating more than 43 million tons of CO2 per
year.7
Also, the proliferation of urban data centers is responsible for the Concurrency Computat: Pract Exper. 2017;29:e4067. https://doi.org/10.1002/cpe.4067
and free cooling approaches outperform traditional Computer Room Air Conditioning units. However, the implantation rate of these new techniques is still low for typical data centers.
wileyonlinelibrary.com/journal/cpe
Copyright © 2016 John Wiley & Sons, Ltd.
1 of 13
2 of 13
ARROBA ET AL.
However, the main contributor to the energy consumption in a data
require policies to adapt the operating server set to the workload
center is the IT infrastructure, which consists of servers and other
needs during runtime in order to minimize performance degradation
IT equipment. The IT power in the data center is dominated by the
because of overprovisioning. However, both strategies are applied inde-
power consumption of the enterprise servers, representing up to 60%
pendently, regardless the effects that consolidation have on DVFS and
of the overall data center consumption.7
The power usage of an enter-
vice versa. Therefore, the implementation of DVFS-aware consolida-
prise server can be divided into dynamic and static contributions.
tion policies has the potential to optimize the energy consumption of
Dynamic power depends on the switching transistors in electronic
highly variable workloads in Cloud data centers.
devices during workload execution. Static consumption associated to
The key contributions of our work are (1) a DVFS policy that
the power dissipation of powered-on servers represents around 70%
takes into account the trade-offs between energy consumption and
and is strongly correlated with temperature because of the leakage
performance degradation; (2) a novel consolidation algorithm that is
currents that increase as technology scales down.
aware of the frequency that would be necessary when allocating a
The Cloud helps improving energy efficiency, reducing the carbon emissions11
Cloud workload in order to maintain Quality of Service (QoS). Our
by
frequency-aware consolidation strategy reduces the energy consump-
increasing data centers overall utilization. The main reason is that, in
tion of the data center, making use of DVFS to reduce the dynamic
this computational model, the computing resources are shared among
power consumption of servers, also ensuring SLA. The algorithm is light
users and applications so, less powered-on servers are needed, which
and offers an elastic scale-out under varying demand of resources.
footprint per executed task and diminishing CO2
means less static consumption. In this way, smaller facilities are able
The rest of the paper is organized as follows: Section 2 gives fur-
to consolidate higher incoming workloads, thus reducing the comput-
ther information on the related work on this topic. The proposed
ing and cooling energy requirements. Cloud computing provided a 17%
DVFS policy that considers both energy consumption and performance
reduction in energy consumption by 2011 according to the Schneider
degradation is presented in Section 3. This section also provides our
Electric’s report on virtualization and Cloud computing efficiency.12
Frequency-Aware Optimization strategy for the energy optimization
To meet the growing demand for their services and ensure minimal
of data centers. The simulation configuration is detailed in Section 4.
costs, Cloud providers need to implement an energy-efficient manage-
In Section 5, we describe profusely the performance evaluation and
ment of physical resources. Therefore, optimization approaches that
the experimental results. Finally, Section 6 concludes the work with
rely on accurate power models and optimize the configuration of server
future directions.
parameters (voltage and working frequency, workload assignment, etc.) can be devised. Furthermore, as many applications expect services to be delivered as per Service Level Agreement (SLA), power consumption
2
RELATED WORK
in data centers may be minimized without violating these requirements whenever it is feasible.
Recently, there has been a growing interest in developing techniques to
From the application-framework viewpoint, Cloud workloads
provide power management for servers operating in a Cloud. The com-
present additional restrictions as 24/7 availability, and SLA constraints
plexity of the power management and workload allocation in servers
among others. In this computation paradigm, workloads hardly use
has been described by Gandhi et al13 and Rafique et al,14 where the
100% of CPU resources, and their execution time is strongly con-
authors show that the optimal power allocation is non-obvious, and,
strained by contracts between Cloud providers and clients. These
in fact, depends on many factors such as the power-to-frequency rela-
restrictions have to be taken into account when minimizing energy
tionship in processors, or the arrival rate of jobs. Thus, it is critical to
consumption as they impose additional boundaries to efficiency
understand quantitatively the relationship between power consump-
optimization strategies. Users’ Quality of Experience would be deter-
tion and DVFS at the system level to optimize the use of the deployed
mined by these constraints, and it would be impacted by performance
Cloud services.
degradation.
Dynamic Voltage and Frequency Scaling is by far the most frequent
Also, Cloud scenarios present workloads that vary significantly over
technique at the architectural-level as well as one of the currently
time. This fluctuation hinders the optimal allocation of resources, that
most efficient methods to achieve energy savings. This technique scales
requires a trade-off between consolidation and performance. Work-
power according to the workload in a system by reducing both oper-
load variation impacts on the performance of 2 of the main strategies
ating voltage and frequency. Reducing the operating frequency and
for energy-efficiency in Cloud data centers: Dynamic Voltage and Fre-
voltage slows the switching activity achieving energy savings but also
quency Scaling (DVFS) and Consolidation.
decreasing the system performance. Dynamic Voltage and Frequency
Dynamic Voltage and Frequency Scaling strategies modify frequency
Scaling implementation on CPU results in an almost linear relation-
according to the variations on the utilization performed by dynamic
ship between power and frequency, taking into account that the set of
workload. These policies help to dynamically reduce the consumption
states of frequency and voltage of the CPU is limited. Only by applying
of resources as dynamic power is frequency dependent. Dynamic Volt-
this technique on a server CPU, up to 34% energy savings in dynamic
age and Frequency Scaling has been traditionally applied to decrease
consumption can be reached as presented in.15
the power consumption of underutilized resources as it may incur
Dynamic Voltage and Frequency Scaling has been mainly applied
on SLA violations. On the other hand, consolidation policies decrease
to enhance energy efficient scheduling on idle servers, or those
significantly the static consumption by reducing the number of active
performing under light workload conditions,16 and during the exe-
servers, increasing their utilization. Dynamic workload scenarios would
cution of noncritical tasks.17 However, a recent research shows that
3 of 13
ARROBA ET AL.
DVFS can be also used to meet deadlines in mixed-criticality systems.18
ing QoS, and under dynamic workload conditions. In our previous
Furthermore, DVFS-based scheduling research on multiprocessor sys-
work,28 we derived a complete accurate model to calculate the total
tems shows promising results. Rizvandi et al19 achieved considerable
energy consumption of a server Ehost (m, k) in kW·h that can be seen in
energy savings by applying this technique on up to 32-processor sys-
Equation 1:
tems for High-Performance Computing workload. However, the effects of DVFS in loaded servers have not been analyzed yet for Cloud sce-
Ehost (m, k) = Phost (m, k) · Δt = (Pdyn (m, k) + Pstat (m)) · Δt
(1)
T = {t1 , … , ti , … , tT }
(2)
Δt = ti+1 − ti
(3)
2 Pdyn (m, k) = 𝛼(m) · VDD (m, k) · fop (m, k) · ucpu (m)
(4)
2 Pstat (m) = 𝛽(m) · Tmem (m) + 𝛾(m) · FS3 (m)
(5)
narios. The Quality of Experience offered to the user that depends on the SLA contracted to Cloud providers could be violated under certain frequency-voltage conditions. Dynamic Voltage and Frequency Scaling-aware approaches could help to reduce the energy consumption of Cloud facilities but new algorithms have to be devised for large scale data center infrastructures also taking into account the SLA considerations of Cloud workloads. On the other hand, many of the recent research works have focused on reducing power consumption in cluster systems by power-aware Virtual Machine (VM) consolidation techniques, as they help to
where Δt is the time along which the energy is calculated. In this paper,
increase resource utilization in virtualized data centers. Consolidation
we assume a discrete set of times T in which the algorithm is evalu-
uses virtualization to share resources, allowing multiple instances of
ated in order to optimize the power performance of the system. We
operating systems to run concurrently on a single physical node. Virtu-
define each time ti as the particular instant in which the system evalu-
alization and consolidation increase hardware utilization (up to 80%20 )
ates an incoming batch of workload. Our proposed model estimates the
thus improving resource efficiency.
instantaneous electric power of a server in ti so, the energy is computed
The resource demand variability of Cloud workload is a critical factor
for the time interval Δt between 2 workload evaluations, considering
in the consolidation problem as the performance degradation bound-
that the power is stable in this time period. For practical reasons, we
ary has to be considered for both migrating VMs and reducing the
have selected Δt to be 300s in our experiments, which is a realistic
active server set.21
assumption for our setup.
Balancing the resource utilization of servers during
consolidation was performed by Calheiros et al22 to minimize power
Phost (m, k), Pdyn (m, k) and Pstat (m) represent total, dynamic, and
consumption and resource wastage. In the research proposed by Her-
static contributions of the power consumption in Watts of the phys-
menier et al,23 their consolidation manager reduces the VM migration
ical machine m operating in a specific k DVFS mode. 𝛼 (m), 𝛽 (m) and
overhead. Also, there exist interesting works that focuses on model-
𝛾 (m) define the technological constants of the server in the range of X,
ing the energy consumption of the migration process as the research
X·10 − 3 and X·10 − 11 .
proposed by Haikun et al24 and De Maio et al.25
Our proposed model consists of 5 different variables: ucpu (m) is the
However, DVFS-Aware consolidation techniques that maintain QoS
averaged CPU percentage utilization of the specific server m and is
in data centers have not been fulfilled yet. Although some combined
proportional to the number of CPU cycles defined in Millions of Instruc-
application of DVFS and consolidation methods for Cloud environ-
tions Per Second (MIPS) in the range [0,1]. VDD is the CPU supply
ments can be found, no one of them are considering performance
voltage, and fop is the operating frequency in GHz. Tmem defines the
degradation because of VM migration or resource over-provisioning. In
averaged temperature of the main memory in Kelvin, and FS represents
the research presented by Wang et al,26 the consolidation is performed
the averaged fan speed in RPM. Depending on the target architec-
regardless the frequency impact, and the DVFS is applied separately.
ture, some factors might have higher impact than others. This model
The approach presented by Petrucci et al27 shows the dependence of
has been validated for Intel architectures achieving accuracy results of
power with frequency but the algorithm does not scale for large data
about 95%.
centers, and SLA violations are not taken into account.
Our model allows to obtain power estimations during run-time facil-
Our work provides a novel DVFS-aware consolidation algorithm
itating the integration of proactive strategies in real scenarios. Power
that helps to reduce the energy consumption of data centers under
consumption is measured with a current clamp, so we can validate our
dynamic workload conditions. The proposed strategy considers the
approach comparing our estimations with real values, obtaining valida-
trade-offs between energy consumption and performance degradation
tion errors ranging from 4.22% to 4.94%. perf monitoring tool is used
thus maintaining QoS. The work presented in this paper outperforms
to collect the values acquired by different hardware counters in order
previous contributions by allowing the optimization of Cloud data cen-
to monitor different parameters of the CPU and the memory. ucpu (m)
ters from a proactive perspective in terms of energy consumption and
has been measured by monitoring the execution of the virtual machines
ensuring the user experience of Cloud-based services.
with the ps aux Linux command. cpufreq-utils Linux package is used to monitor and modify fop and VDD according to the DVFS states dur-
3 FREQUENCY-AWARE VIRTUAL MACHINE CONSOLIDATION
Platform Management Interface.
The major challenge that we face in this work is to reduce the energy
power consumption Pdyn (m, k) depends on the workload profile exe-
consumption of the IT infrastructure of data centers, while maintain-
cuted in the server. So, the lower the ucpu (m), the lower the dynamic
ing workload execution. Finally, Tmem and FS are collected via Intelligent As shown in Equation 4, the energy consumption due to the dynamic
4 of 13
energy contribution. On the other hand, the static consumption rep-
ARROBA ET AL.
where k represents the operating DVFS mode. It is important to note
resents the energy consumed because of power dissipation of a
that not all frequencies from 0 to fMAX (m) are available, as the set of
powered-on server, even if it is idle. This energy represents around
states of frequency and voltage of the CPU is limited, and it may be dif-
70% of the total server consumption. In this context, we can see some
ferent depending on the architecture of the physical machine m. We
observations about the dynamic consolidation problem:
define the available CPU utilization percentage ucpuavailable (m, k) as the
• DVFS vs SLA. Dynamic Voltage and Frequency Scaling can be used to achieve power savings because reducing the frequency and voltage of the CPU (fop (m, k) and VDD (m, k)) slows its switching activity. However, it also impacts on the performance of the system by extending
maximum CPU utilization that could be used by the workload without performance degradation. We present the relationship between these parameters in Equation 7. fop (m, k) ∈ {f1 (m), f2 (m), · · · , fk (m), · · · , fMAX (m)}
tasks duration (t), which can lead to the appearance of SLA violations and to the increase of energy consumption.
MIPSavailable (m, k) =
• Underloaded servers. If the workload is spread over a larger number of servers, the CPU utilization in each server will be lower, so the dynamic power contribution in each server will be also lower. As ucpu is reduced, fop can be scaled thus decreasing the power contribution due to CPU frequency. However, the global energy consumption will be increased disproportionally because of the impact of static consumption of a higher number of servers. • Overloaded servers. On the other hand, if the incoming workload is concentrated in a smaller set of servers, even though the static consumption is reduced, the QoS may be affected. This situation is intensified because of the dynamic variation of workload and, if the maximum server capacity is exceeded during peak loads, it would lead to performance degradation. To avoid overloaded servers, 1 or more VMs can be migrated from 1 server to another. However, VM migration has associated costs in terms of energy consumption and time, which could lead to SLA violations.
ucpuavailable (m, k) =
fop (m, k) · MIPSMAX (m) fMAX (m)
fop (m, k) MIPSavailable (m, k) = MIPSMAX (m) fMAX (m)
(6) (7)
(8)
In order to motivate these metrics, we provide the following case of use for the Fujitsu RX300 S6 server. The maximum frequency for this type of physical machine is fMAX (Fujitsu) = 2.4GHz, so the maximum number of instructions per second is MIPSMAX (Fujitsu) = 2400 · CPI, where CPI defines the number of cycles per required per instruction. One of the available operating frequencies for this server is fop (Fujitsu, 1) = f1 (Fujitsu) = 1.73GHz. Assuming that the server is operating at 1.73GHz, MIPSavailable (Fujitsu, 1) = 1.73/2.4 · 2400 · CPI = 1730 · CPI, and according to Equation 7, the available CPU utilization percentage takes the value ucpuavailable (Fujitsu, 1) = 0.72. Thus, if the utilization of the Fujitsu server, running at 1.73GHz, exceeds the 72% of its total capacity, the required number of instructions to be executed will be higher than the available MIPS than can be provided, provoking a delay. On the
In this paper, we propose a strategy to allow the energy opti-
other hand, when the utilization is kept below this threshold, no perfor-
mization of a Cloud under SLA constraints. As opposed to previous
mance degradation occurs because of DVFS. These quality and perfor-
approaches, our work offers a DVFS policy that considers the trade-offs
mance metrics will be considered by the proposed energy optimization
between energy consumption and performance degradation explained
algorithm, so that they are not degraded (as it will be confirmed by the
in Section 3.1. Thus, frequency is managed according to the available
experimental results).
states depending on the server architecture while ensuring QoS. On the other hand, in Section 3.2, we provide an energy-aware dynamic placement algorithm that considers the frequency configuration according to the allocation of VMs. Finally, in Section 3.3, we use both strategies combined to proactively optimize a Cloud under dynamic workload conditions.
3.1 Dynamic Voltage and Frequency Scaling-Performance management Dynamic Voltage and Frequency Scaling scales the power of the system varying both CPU frequency and voltage. Reducing the operating frequency and voltage slows the switching activity to achieve energy savings; however, it also impacts negatively on the performance of the system.
Our proposed DVFS management policy (DVFS-perf), presented in Algorithm 1 takes into account the previous relationships in order
The CPU performance of a physical machine m is characterized by
to improve energy efficiency, avoiding performance degradation. As
the maximum MIPS that can be provided by its CPU (MIPSMAX (m)) at
inputs, we consider the complete set of hosts (hostList), and the set of
its maximum frequency (fMAX (m)). Moreover, the real available cycles
valid frequencies (frequenciesList). For each host, the current value of
offered by the system (MIPSavailable (m, k)) depend on the current oper-
CPU utilization is acquired in step 4. This variable, which depends on
ating frequency of the CPU (fop (m,k)). As we present in Equation 6,
the workload that is already hosted and running in the server, is moni-
fop (m,k) can only take a value from a specific set of valid frequencies
tored during runtime by using calls to the system utility (eg, Linux top).
5 of 13
ARROBA ET AL.
Then, ucpuavailable (m, k) (availableUtilization) is calculated for the different
3.2.2
frequencies in frequenciesList in steps 5 to 9. The algorithm selects the
One of the main challenges when designing data center optimizations is
Algorithm considerations.
minimum frequency that offers a suitable ucpuavailable (m, k) value that is
to implement fast algorithms that can be evaluated for each workload
greater or equal to the current utilization in the host in step 7. Finally, the
batch during run-time. For this reason, the present research is focused
DVFS configuration for the entire set of hosts is provided by frequency-
on the design of an optimization algorithm that is simple in terms of
Configuration.
computational requirements, in which both decision making and its
As dynamic power is reduced with frequency, our algorithm sets the
implementation in a real infrastructure are fast. Instead of developing
operating frequency of each host to the lowest available value that pro-
an algorithm for searching the optimal solution, we propose a sequen-
vides sufficient CPU resources according to Equation (7). This ensures
tial heuristic approach because it requires lower computational com-
that the server offers sufficient MIPS based on the amount demanded
plexity. Our solution scales properly in accordance with large numbers
by the allocated workload satisfying QoS.
of servers as explained in Subsection 3.2.3.
We motivate these metrics by providing a case of use based on a
Minimizing the overall power consumption of the data center as a
Fujitsu RX300 S6 server, whose maxFrequency is 2.4GHz. The operat-
whole by only considering the consumption of each server separately
ing frequencies set (frequenciesList) in GHz is fop (Fujitsu, k) = {1.73, 1.86,
may drive to some inefficiencies. The dynamic power of a host depends
2.13, 2.26, 2.39, 2.40}. Our aim is to find the best frequencyConfigura-
linearly on the CPU utilization, while the static remains constant (see
tion for a current utilization of the server of 80%. First, we calculate the
Equation 1.) So, when the reduction in consumption is performed indi-
availableUtilization for the minimum frequency according to Equation 7
vidually, server by server, it results in the allocation of less workload
obtaining ucpuavailable (Fujitsu, 1) = 1.73∕2.4 = 0.721. As 72% is lower than
on each physical machine, leading to the underloaded server-issue. This
80%, this frequency is discarded so the algorithm check the next one
situation increases the number of active servers, that become under-
in an increasing order. ucpuavailable (Fujitsu, 2) = 1.86∕2.4 = 0.775 is also
utilized, regardless the increase in the global static consumption. Oth-
lower so the next frequency is evaluated. For fop (Fujitsu) = 2.13GHz, we
erwise, if the total energy consumed by the infrastructure is considered
calculate ucpuavailable (Fujitsu, 3) = 2.13∕2.4 = 0.887 obtaining an avail-
to be optimized, increasing the CPU utilization will reduce the num-
able CPU utilization of 88.7%, that is higher than the 80% required by
ber of servers required to execute the workload thus decreasing the
the workload allocated in it. Thus, our algorithm sets the frequency
overall static consumption but leading to an overloaded server-scenario.
of the Fujitsu server running at 80% to 2.13GHz, as it is the mini-
Therefore, both QoS and energy consumption could be affected as a
mum frequency that allows running the workload without performance
consequence of VM migrations.
degradation because of DVFS.
The proposed power and performance considerations, in
This policy allows servers to execute the workload in a more efficient
Equations 1-5 and 6-8 respectively, provide a better understanding
way in terms of energy as frequency is scaled depending on the CPU
of how the system’s behavior varies depending on frequency and uti-
requirements of the workload, while maintaining QoS.
lization simultaneously. According to this, a more proactive allocation policy could be devised using DVFS to dynamically constrain aggressive consolidation scenarios to preserve QoS. To this purpose, the
3.2
Frequency-aware dynamic consolidation
trade-offs between CPU utilization and frequency have to be analyzed in terms of energy. An increase in the resource demand of a host in
As an alternative to previous approaches, in this research, we provide an energy-aware consolidation strategy that considers the frequency configuration according to the allocation of VMs. We use this approach to proactively optimize a Cloud under dynamic workload conditions.
terms of MIPS could represent an increment in its frequency depending on the available set of frequencies to maintain QoS. If frequency needs to be risen, the power consumption will be increased because of the frequency contribution (see Equation 6). So, we propose a VM placement policy that estimates the frequency increment during workload consolidation. Our strategy decides to allocate workload in those
3.2.1
Dynamic consolidation outlook.
servers that have a higher utilization (but still have resources left to
In this context, the dynamic consolidation problem can be split into
accommodate the incoming VM) and that impact less on the frequency
4 different phases, as proposed by Beloglazov et al.29 Each phase
contribution. Consequently, the policy uses more efficiently the ranges
considers (i) detection of overloaded and (ii) underloaded hosts, (iii)
of utilization in which the frequency is not increased.
selection of VMs to be migrated from these hosts, and (iv) VM placement after migrations, respectively. Their research also present different algorithms for optimizing phases (i)-(iii) that we use during will be focused on finding new placements to host VMs after their
3.2.3 Dynamic Voltage and Frequency Scaling-aware dynamic placement.
migration from underloaded and overloaded hosts. In this work, we
The policy proposed in this research is not only aware of the utiliza-
aim to optimize VM placement taking into account the frequency
tion of the incoming workload to be assigned, but also is conscious of
variations caused by the workload allocation together with the estima-
the impact of its allocation on servers working at different frequencies.
tion of its impact in the overall consumption. This premise is incorpo-
Dynamic Voltage and Frequency Scaling-awareness allows to predict
rated in our policy and evaluated lately in terms of energy efficiency
operating frequencies depending on VM allocation, thus helping to
and performance.
estimate future energy contributions. The presented approach takes
performance evaluation (see Sections 4.4.1 and 4.4.2). So our work
6 of 13
ARROBA ET AL.
advantage of this knowledge to optimize VM placement within the
obtained when a VM is allocated in a specific host is calculated in step
Cloud infrastructure under QoS and energy constraints.
9 using Equation 9.
Our algorithm is based on the bin packing problem, where servers are represented as bins with variable sizes because of the frequency scaling. To solve this nondeterministic polynomial time-hard problem, we use a Best Fit Decreasing-based algorithm as BFDs are shown to use no more than 11/9·OPT + 1 bins,30 being OPT the bins provided by the optimal solution. The bin packing approach under similar conditions has been proved to work well for this type of problems with large server sets of 800 hosts.29 The allocation of a VM in a specific host provokes an increase in its CPU utilization and, according to our proposed DVFS-perf configuration algorithm, may increase or not its operating frequency. According to our previous considerations, a tradeoff between servers’ utilization and frequency may be inferred to reduce energy consumption of dynamic workload scenarios. Typically, the frequency span in which a CPU ranges is of about 1 GHz. So, the difference between a frequency of the set of valid frequencies and the next one is 0.X, being more common steps of about 0.1 to 0.5 GHz. On the other hand, average cloud workload utilization ranges from 16% to 59%.31 As we define utilization of CPU as a value that ranges from 0 to 1, average cloud workload utilization would be in the range 0.16 to 0.59. Thus, utilization and frequency increments originated by the allocation of VMs have the same
As can be seen in steps 10, 11, and 12, the VM is allocated in the host
orders of magnitude. So, in order to maximize servers’ utilization while
that has a higher placement value, that means a high CPU utilization but,
minimizing frequency increment, we propose to maximize the differ-
on the contrary, it represents a low increase in frequency because of the
ence between these 2 parameters as can be seen in Equation 9. We
utilization increment. This approach minimizes the number of bins used
avoid the use of normalization, providing a light algorithm. We mean
by this combinatorial nondeterministic polynomial time-hard problem
that our proposed algorithm is light because, compared with tests that
while taking full advantage of the range of CPU utilization available for
we have conducted with metaheuristics as Simulated Annealing and
each frequency. The output of this algorithm is the frequency-aware
Grammatical Evolution, we achieve simulation times that are about 160
placement (FreqAwarePlacement) of the VMs that have to be mapped
times lower.
according to the under/overloaded detection and VM selection policies. Placementhost,vm = uhost,vm − Δfhost,vm
(9)
uhost,vm = uhost + uvm
(10)
Δfhost,vm = fhost,vm − fhost
(11)
3.3
Frequency-aware optimization
Our Frequency-Aware Optimization combining the DVFS-perf policy with the Freq-Aware Placement algorithm is shown in listing of Algorithm 3. First, it finds the optimized placement of the VMs (optiuhost,vm is the estimated CPU utilization resulting from adding both host
mizedPlacement) that have to be migrated because of dynamic work-
and vm utilizations (uhost and uvm ). Δfhost,vm provides the estimated dif-
load variations. This is calculated in Algorithm 3, taking care of the
ference between the host frequency after (fhost,vm ) and before (fhost ) the
frequency requirements. In step 2, the function consolidateVM allo-
VM allocation calculated for the new estimated utilization. Algorithm 2
cates the VMs according to this mapping, performing VM migrations
presents our DVFS-Aware Dynamic Placement proposal.
and updating utilization requirements for each host. Then in steps 3
The input vmList represents the VMs that have to be migrated
and 4, the DVFS-perf configuration is obtained using Algorithm 1 with
according to the stages (i), (ii), and (iii) of the consolidation process,
current utilization values. Finally, the data center status is updated
while hostsList is the entire set of servers in the data center that are
according to the optimized allocation and frequency configuration. Our
not considered overutilized. First, VMs are sorted in a decreasing order
DVFS-Aware strategy provides an elastic scale out that is adapted to
of their CPU requirements. Steps 3 and 4 initialize bestPlacement and
the varying demand of resources. Also, the algorithm is light, making
bestHost, which are the best placement value for each iteration and the
it suitable for quickly adaptation to workload fluctuations in the data
best host to allocate the VM respectively. Then, each VM in vmList will
center and run-time execution.
be allocated in a server that belongs to the list of hosts that are not overutilized (hostList) and have enough resources to host it. In steps 7 and 8, the algorithm calculates the value of the estimated
4
SIMULATION CONFIGURATION
CPU utilization (uhost,vm ) and freqIncrement (Δfhost,vm ) after vm allocation using Equations 10 and 11. According to our allocation strategy, derived
In this section, we present the impact of our frequency-aware poli-
from the above considerations, the placement value (Placementhost,vm )
cies in energy consumption because of the improved management
7 of 13
ARROBA ET AL.
PlanetLab workload main features
of the workload and the frequency assignment in servers. However,
TABLE 1
large-scale experiments and their evaluations are difficult to replicate
Date
VMs
CPU mean utilization (%)
CPU utilization SD
in a real data center infrastructure because it is difficult to maintain the
2011.03.03
1052
12.31
17.09
same experimental system condition necessary for comparing different
2011.03.06
898
11.44
16.83
user and application scenarios. This can be achieved in simulation envi-
2011.03.09
1061
10.70
15.57
ronment as simulators helps in setting up repeatable and controllable
2011.04.12
1054
11.54
15.15
experiments.
2011.04.20
1033
10.43
15.21
VM, Virtual Machine.
Also, the usage of traces from a real system makes our simulation-based analysis applicable to real scenarios.
4.2
Physical nodes
The simulation consists of a set of 400 hosts conforming a data center. This is the minimum amount of resources required by the CloudSim initial provisioning policy to manage the number of VMs for the different workloads that we have selected. During simulations, the number of servers will be significantly reduced as oversubscription is enabled. For that reason, we have chosen the CloudSim toolkit32 to simulate a Infrastructure as a Service (IaaS) Cloud computing environment. In contrast to other simulators, CloudSim provides the management of on-demand resource provisioning, representing accurately the models
Hosts are modeled as a Fujitsu RX300 S6 server based on an Intel Xeon E5620 Quad Core processor @2.4 GHz, RAM memory of 16 GB and storage of 1 GB, running a 64bit CentOS 6.4 OS virtualized by the QEMU-KVM hypervisor.
of virtualized data centers. The software version 2.0 that we have chosen supports the energy consumption accounting as well as the execution of service applications with workloads that vary along time.29 For this work, we have provided frequency-awareness to the CloudSim simulator, also incorporating the ability to modify the frequency of servers. This frequency management policy allows to evaluate the performance of the algorithms proposed in Sections 3.1 and 3.2. Our code also supports switching the VM placement policy to compare our strategy with other approaches.
4.2.1
Dynamic Voltage and Frequency Scaling governors.
The DVFS system of our Fujitsu server operates at 1.73, 1.86, 2.13, 2.26, 2.39 and 2.40 GHz, respectively. For our experiments, we define 2 different governors to dynamically manage the CPU frequency. Both of them are fully available in our CloudSim modified version. For this work, we have provided frequency-awareness to the CloudSim simulator, also incorporating the ability to modify the frequency of servers according to our new DVFS-perf policy.
Simulations by our frequency-aware version of CloudSim have been executed in a 64-bit Windows 7 Operating System running on an Intel
• Performance. The CPUfreq governor performance* is a typical gov-
Core i5-2400 3.10GHz Dell Workstation with 4 cores and 4 GB of RAM.
ernor available in the Linux Kernel. It sets the CPU to the highest
Moreover, the simulations are configured according to the following
frequency of the system.
considerations:
• DVFS-perf. This governor dynamically modifies the CPU frequency according to Algorithm 3 so, it is set to the minimum frequency that ensures QoS depending on the workload.
4.1
Workload
We conduct our experiments using real data from PlanetLab, that comprises more than a thousand servers located at 645 sites around the
4.2.2
Server power modeling.
world. The workload consists of 5 days of data with different resource
The power model used to estimate the energy consumed by these
demand profiles obtained from the CoMon monitoring project.33 The
servers was proposed in our previous work28 and can be seen
data traces are available and fully operative in CloudSim as this work-
in Equation 12. Then the energy consumption is obtained using
load is commonly used by researchers using this simulator. By using
Equation 13 where t determines the time in which the energy value is
these traces we can compare our approach with published and future
required. The operating frequencies set (in GHz) is provided in 14.
research works. The main features of each of the 5 sets, as the number of VMs and both the mean and standard deviation values of the CPU utilization, are shown in Table 1. Each of the 5 data sets includes CPU utilization values of around a thousand VMs with a monitoring interval of
2 PFujitsu, k = 7.25 · VDD (k) · fop (k) · ucpu 2 + 1.63 · 10−3 · Tmem + 4.88 · 10−11 · FS3
EFujitsu = PFujitsu · t
300 seconds. We have chosen this collection because each independent workload can be executed for the same data center’s initial size.
* www.kernel.org/doc/Documentation/cpu-freq/governors.txt
(12)
(13)
8 of 13
ARROBA ET AL.
4.3.2 fop (k) = {1.73, 1.86, 2.13, 2.26, 2.39, 2.40}(GHz)
(14)
VDD (k) = {0.80, 0.90, 1.05, 1.10, 1.15, 1.20}(V)
(15)
Migration policy.
In all our scenarios, we allow online migration, where VMs follow a straightforward load migration policy. During migration, another VM, which has the same configuration as the one that is going to be migrated, is created in the target server. Then the cloudlets are
This model presents a validation error of 4.46% when comparing power
migrated from the source VM to the target VM. Finally, when the migra-
estimation to real measurements of the actual power. We used appli-
tion is finished the source VM is removed. Live migration has 2 different
cations that can be commonly found in nowadays’ Cloud data centers
overheads that affect to energy consumption and performance degra-
(including web search engines, and intensive applications) for training
dation. Therefore, it is crucial to minimize the number migrations in
and validation stages. We assume a thermal management that allows
order to optimize energy efficiency while maintaining QoS.
memory temperature and fan speed to remain constant as we are inter-
Energy overhead. A migration takes a time known as migration time
ested in analyzing the power variations only because of utilization and
(tmigration ), that is defined in Equation 19. Migration delay depends on the
DVFS management provided by our Freq-Aware optimization. The tem-
network bandwidth (BW) and the RAM memory used by the VM. We
perature of the memory Tmem and the fan speed FS are considered
consider that only half of the bandwidth is used for migration purposes,
constant at 308 K and 5370 RPM, respectively. Both parameters take
as the other half is for communication. Thus, migrations have an energy
their average values from the exhaustive experimental evaluation for
overhead because, during migration time, 2 identical VMs are running,
this type of server that has been performed in our aforementioned pre-
consuming the same power in both servers.
vious work. This approach is valid because current models usually take into account only the variation of the dynamic consumption, as seen in Section 2. By including our power model in the CloudSim toolkit,
tmigration =
RAM BW∕2
(19)
we are able to evaluate the power consumption in a more accurate way, as both the dynamic (depending on CPU utilization and frequency)
Performance overhead. Performance degradation occurs when the
and the static contributions are now considered. Thus, the impact of
workload demand in a host exceeds its resource capacity. In this work,
DVFS and consolidation-aware optimizations on the data center IT
we model that oversubscription is enabled in all servers. So, if the VMs
energy consumption is more likely to be measured by including our
hosted in 1 physical machine simultaneously request their maximum
proposed models.
CPU performance, the total CPU demand could exceed its available capacity. This situation may lead to performance degradation because of host overloading. The impact on SLA can be calculated as the SLA
4.2.3
Active server set.
violation time per active host (SLATAH ) that can be seen in Equation 20.
In this work, we assume that a server is switched off when it is idle, so no
On the other hand, when overloading situations are detected, VMs
power is consumed when there is not any any running workload. Also,
are migrated to better placements, thus provoking performance degra-
servers are turned on when needed, if the system is overloaded. We
dation due to migration (PDM) as seen in Equation 21. The metric used
take into account the booting energy consumption required by a server
in this work to determine the SLA violation (SLAviolation )29 combines
to be fully operative as seen in Equation 17.
SLATAH and PDM as shown in Equation 22:
Pboot = 1.63 · 10−3 · 3082 + 4.88 · 10−11 · 53703 = 162.1768W (16)
tboot = 300s
(17) PDM =
Eboot = Pboot · tboot = 13.514 · 10−3 kW · h
1 ∑ t100%i M M i=1 tactivei
(20)
pdmj 1∑ V V j=1 Cdemandj
(21)
SLATAH =
(18) t0 +tmigration
where Pboot is the server booting power working at 308 K and
pdmj = 0.1 ·
5370 RPM as defined above and tboot is the booting time obtained exper-
∫t0
uj dt
(22)
imentally. SLAviolation = SLATAH · PDM
4.3 4.3.1
Virtual Machines Virtual Machine types.
(23)
where M is the number of servers; t100%i and tactivei are the time in which the CPU utilization of the host i is 100% and the total time in which it
The simulation uses heterogeneous VM instances that correspond to
is active, respectively. V is the number of VMs, and Cdemandj represents
existing types of the Amazon EC2 Cloud provider. The Extra Large
the CPU demand of the VM during its lifetime. pdmj defines the per-
Instance (2000 MIPS, 1.7 GB RAM), the Small Instance (1000 MIPS,
formance degradation per VM during tmigration . In our experiments, it is
1.7 GB RAM) and the Micro Instance (500 MIPS, 613 MB RAM) are
estimated as the 10% of the CPU utilization in MIPS during the migra-
available for all the scenarios. All the VM are forced to be single-core to
tion time of VM j. Finally, t0 is the time in which the migration starts and
meet the PlanetLab data set requirements.
uj is the CPU utilization of VM j.
9 of 13
ARROBA ET AL.
4.4
Dynamic consolidation configuration
4.5
Scenarios
The present work aims to evaluate the performance of DVFS-aware
We provide 3 different scenarios to evaluate the performance of our
dynamic consolidation. Consolidation phases (i), (ii), and (iii) are able
frequency-aware optimization. For this purpose, we will compare our
to use the algorithms for the detection of overloaded or underloaded
work with 2 different approaches. All the proposed scenarios are able
hosts and for the selection of VMs to be migrated that are available
to power on/off servers when needed as can be seen in section 4.2.3
in CloudSim 2.0.29 We have simulated all the possible combinations for both types of algorithms with the default configuration of internal
• Baseline scenario represents the default performance of CloudSim. The performance governor is active so, the servers always oper-
parameters, resulting in 15 different tests. The internal parameters for
ate at the maximum frequency. Power Aware Best Fit Decreasing
each option are set to those values that provide better performance according to Beloglazov et al.29 Finally, consolidation phase (iv) is able to use 2 different power-aware placement algorithms.
placement is used to perform VM allocation. • DVFS-only scenario uses our DVFS-perf governor combined with Power Aware Best Fit Decreasing placement. Thus, the frequency of each server is reduced to the lowest value that allows the system
4.4.1
to meet QoS. However, the mapping is not aware of the allocation
Over and underloading detection algorithms.
We consider the detection of overloaded or underloaded hosts using 5
impact on CPU frequency that also impacts on the power consump-
specific policies that belong to 3 different detection strategies.
tion. • Freq-Aware Optimization scenario combines our DVFS-perf gover-
• Adaptive Utilization Threshold Methods. Includes the Interquar-
nor with our Freq-Aware Placement as shown in Algorithm 3. Both
tile Range and the Median Absolute Deviation (MAD) algorithms, and
utilization and frequency estimations are considered to find the
offers an adaptive threshold based on the workload utilization to
optimized allocation. It aims to evaluate our proposed optimization
detect overloaded or underloaded hosts. The internal safety param-
strategy.
eters take the value 1.5 and 2.5, respectively, and define how aggressively the consolidation is considered in this stage. • Regression Methods. Both the Local Regression and the Local Regression Robust are Regression Methods based on the Loess method and
5
EXPERIMENTAL RESULTS
have the same internal parameter of 1.2. • Static Threshold Method. The Static threshold sets a fixed value to consider when a host is overloaded or underloaded. The internal parameter is 0.8.
We have simulated the 3 different scenarios for each of the 5 different PlanetLab workloads presented in Table 1, and tested the 15 different combinations of algorithms for overloading detection and VM selection aforementioned. Therefore, for each of the daily workloads, we are able
4.4.2
Virtual Machine selection algorithms.
The selection of the VMs that have to be migrated from overloaded or
to present the following results per test (under/overload detection-VM selection) and per scenario, in order to compare our Freq-Aware optimization with the other 2 alternatives.
underloaded hosts is performed by 3 different algorithms. • Maximum correlation. The system migrates the VM that presents a higher correlation of CPU utilization with other VMs so, the peak
5.1
Performance analysis
loads would occur at the same time.
We consider the following metrics to analyze the obtained results. The
• Minimum migration time (MMT). The algorithm selects the VM that
number of VM migrations is considered as a figure of merit because
takes less time to be migrated when compared with the rest of VMs
migrations may cause SLA violations because of performance degra-
hosted in the same server.
dation, also impacting on energy consumption. Additionally, we have
• Random choice. The VM is randomly selected.
included the overall SLA violations provided by the metric SLAviolation to simultaneously verify if our policies meet QoS requirements. As CloudSim allows turning machines on when needed, we have included
4.4.3
Virtual Machine placement algorithms.
the additional booting energy consumption of the servers to the sim-
• Power Aware Best Fit Decreasing. This placement policy for Cloud
ulation. The number of Power on events is our proposed metric to eval-
infrastructures takes into account the power consumption of the
uate its impact because, reducing the number of these events would
servers when finding an optimal placement under dynamic work-
decrease the overall data center energy. Service outages are experi-
load conditions.29 It works well for SLA-constrained systems, main-
enced when the power density exceeds the maximum capacity of the
taining QoS while reducing energy consumption. This solution does
grid. So, we evaluate the peak power during the simulation in order to
not take into account frequency increments because of workload
analyze the system’s performance under critic situations in terms of
allocation.
electricity supply. Finally, the energy signature is obtained in order to
• Frequency-Aware Placement (Freq-Aware Placement). This is the
evaluate the efficiency introduced by our strategy.
DVFS-aware placement policy that we propose in Algorithm 2. This
Table 2 shows the average values of these metrics when compar-
solution allows a dynamic consolidation that is aware of both power
ing the baseline with the DVFS-only policy and with the Freq-Aware
and frequency also taking into account QoS.
optimization. For each PlanetLab workload (represented as the date
10 of 13
ARROBA ET AL.
TABLE 2
Average values per day for baseline comparison
Optim. Policy
Date (yy.mm.dd)
VM migrations reduction (%)
Power on events reduction (%)
DVFS-only
2011.03.03
4.40
13.63
2011.03.06
4.81
9.60
2011.03.09
3.63
2011.04.12
Freq-Aware
SLA violations reduction (%)
Peak power reduction (%)
Energy savings (%)
0
− 6.08
4.64
0.01
− 2.87
3.45
5.16
0
− 7.27
3.44
1.44
1.49
0
0.1
2.36
2011.04.20
1.82
− 3.72
0.01
5.81
2.59
2011.03.03
23.44
86.10
0
68.16
34.82
2011.03.06
19.38
79.16
0.01
64.29
34.64
2011.03.09
19.53
85.41
0
64.34
39.14
2011.04.12
26.77
88.03
0.01
66.19
38.88
2011.04.20
19.55
85.81
0
69.09
41.62
DVFS, Dynamic Voltage and Frequency Scaling; SLA, Service Level Agreement; VM, Virtual Machine.
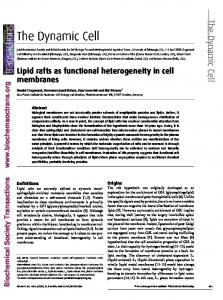
FIGURE 1 Average metrics per test. DVFS, Dynamic Voltage and Frequency Scaling; IQR, Interquartile Range; LR, Local Regression; MAD, Median absolute deviation; MC, Maximum correlation; MMT, Minimum migration time; RS, Random choice; SLA, Service level agreement; THR, Static threshold; VM, Virtual Machine
when it was obtained), the table shows the averaged values that result
simulation infrastructure for all the workloads. The savings in energy
from their execution under every possible combination of the overload-
consumption come from the combined reduction of the VM migrations
ing detection and the VM selection algorithms. An average of 3.35%
and the Power on events. In this scenario, QoS is maintained, but the
energy savings is achieved just including the DVFS capabilities to the
peak power is not improved when compared with the baseline.
11 of 13
ARROBA ET AL.
The proposed Frequency-Aware Placement combined with the
0.05% as can be seen in Figure 1B. Also in Figure 1A, average VM
DVFS management significantly reduces both the number of power
migrations vary considerably from one test to another. So, the SLA vio-
on events and VM migrations. The minimization of the times that a
lations and VM migrations metrics may be determining factors when
server is powered on has several benefits, not only reducing the energy
selecting a combination of overloading detection and VM selection
consumption but also extending its lifetime. However, its impact on
algorithms.
the total energy consumption represents only about 5.31%. So, the energy savings are obtained mainly because of the reduction of the VM migrations as, during each migration, an identical VM is simulta-
5.2
neously running in the source and in the target hosts. Our proposed
Moreover, to deeply understand the performance of the Freq-Aware
Freq-Aware optimization policy outperforms the baseline obtaining
optimization during run-time, we have selected 1 of the workloads for
average energy savings of 37.86% significantly reducing peak power
its simulated execution under the conditions of a specific test. Figure 2
consumption around 66.14% while maintaining the QoS, as can be seen
presents the temporal evolution of the test that combines the MAD
in the peak power reduction column and in the SLA violations reduction
and MMT algorithms as it achieved the lowest total energy consump-
column, respectively.
tion. The test runs the 1052 VMs of the workload dated on 2011.03.03
The different tests, each of them representing a specific combination of overloading detection and VM selection algorithms, perform differ-
Run-time evaluation
because it achieves the highest CPU utilization and standard deviation (see Table 1).
ently. However, the performance pattern for each test is repeated for
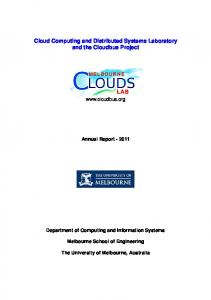
In this framework, we evaluate additional metrics to compare
every considered PlanetLab workload in Table 1. Thus, we are able to
both baseline and Freq-Aware scenarios. Figure 2A shows the global
analyze the system’s performance for every test, shown in Figure 1,
resource demand of this workload in terms of MIPS. The global uti-
which presents the averaged values of each metric for all the work-
lization represents the average CPU utilization of all the servers in the
loads. As shown in 1E, both policies achieve energy savings for each
data center. The number of active hosts within the total facility is also
test but the Freq-Aware optimization reduces the data center energy
analyzed because, as this value increases, the global utilization will be
consumption to an average value of 69.16 kWh for all the workloads
reduced. Finally the cumulative energy consumption of the IT infras-
regardless the combination of algorithms. This means an average sav-
tructure is presented to study its deviation between both scenarios
ings of 37.86%. In 1D, we obtain a similar pattern in the overall peak
during a 24 hours-workload.
power of the IT infrastructure, achieving a reduction of about 66.14%.
For the baseline policy, the number of active hosts is highly increased
The same occurs in Figure 1C for the number of power on events that
during peaks of workload demand, consequently reducing the data
is reduced to about 76.53 events, showing average savings of 86.03%.
center global utilization, as can be seen in Figures 2B and C, respec-
However, not every test performs the same in terms of SLA violations.
tively. The decrease on the overall utilization also reduces each server
Overall SLA violation for local regression methods combined with Max-
energy consumption, as its power depends linearly on CPU demand.
imum correlation and MMT algorithms present better values of about
However, the static consumption (which accounts for about 70% of
FIGURE 2 Temporal evolution for Median absolute deviation-Minimum migration time test running workload 2011.03.03. MIPS, Millions of Instructions Per Second
12 of 13
ARROBA ET AL.
TABLE 3 Average results for MAD-MMT test running workload 2011.03.03
Scenario
Global utilization (%)
Active hosts
Total energy (kWh)
Baseline
60
35.49
125.45
Freq-Aware
83
19.55
76.72
will help to optimize not only the computing resources of the data center but also the cooling contribution.
ACKNOWLEDGMENT Visit of Patricia Arroba to CLOUDS lab, Melbourne University, has been supported by a collaboration fellowship of the European Net-
total consumption in each physical machine) due to the additional
work of Excellence on High Performance and Embedded Archi-
servers that are required to execute the workload with this utilization,
tecture and Compilation (HiPEAC). This project has been partially
highly increases the total energy budget. On the other hand, for the
supported by the Spanish Ministry of Economy and Competitive-
Freq-Aware optimization policy, both values remain more constant, as
ness, under contracts TEC2012-33892, IPT-2012-1041-430000, and
shown in Figures 2B and E, respectively.
RTC-2014-2717-3. This work is partially supported by a project grant
The DVFS configuration of the active server set during run-time can
from the Australian Research Council (ARC). We thank members of
be seen in Figure 2D. The DVFS mode operating at 2.13GHz is the most
the CLOUDS Lab especially Rodrigo Calheiros and Amir Vahid for their
selected, as it offers a wider range of utilizations in which the frequency
comments and support.
remains constant. This frequency allows a sufficiently high utilization (from 77.5% to 88.75%) that helps to minimize the number of servers. The rest of DVFS modes are also used but mainly to absorb load peaks as dynamic workload fluctuates during run-time. Our algorithm speeds up both the consolidation into a lower number of active servers and the elastic scale out of the IT infrastructure, increasing the global utilization in a 23.46% while reducing the number of active hosts around a 44.91%. Table 3 presents the averaged values for these results. Figure 2F shows how this behavior impacts on the energy usage of the data center where the baseline consumption grows at a higher rate during dynamic workload variations than for the optimized scenario, achieving total energy savings of 45.76%.
6
CONCLUSIONS AND FUTURE WORK
The contribution of Cloud data centers in the overall consumption of modern cities is growing dramatically, so minimizing their energy consumption is a critical challenge to reduce economical and environmental impact. Cloud workloads significantly vary over time, thus achieving an optimal allocation of resources while preserving performance is not trivial. The work presented in this paper makes relevant contributions on the optimization of Cloud data centers from a proactive perspective. In this work, we present the Freq-Aware optimization that combines a novel reactive DVFS policy with our proactive Frequency-aware Consolidation technique. We have achieved competitive energy savings of up to 41.62% at the data center level maintaining QoS, even improving slightly the SLA violations around 0.01%, for real workload traces in a realistic Cloud scenario. According to our results, our algorithm enhances the consolidation process and speeds up the elastic scale out, reducing the global peak power demand about a 66.14% while improving the energy efficiency. For future research, we plan to extend the techniques proposed in this paper (Freq-Aware optimization) for other application programming models supporting Web, High-Performance Computing, Big Data, enterprise, and transactions on mobile applications, and for different power models that also include memory performance. We also envision further energy optimization techniques, thus considering the combined effect of workload consolidation, DVFS and temperature. This research
REFERENCES 1. Varia J. Best Practices in Architecting Cloud Applications in the AWS Cloud. New York, USA: John Wiley & Sons, Inc., Wiley Press; February 2011. 457–490. 2. G. A. for Business. Top ten advantages of Google’s cloud. 2012. Available from: http://www.google.com/apps/intl/en/business/cloud.html [Accessed on 1-March-2012]; 2012. 3. Microsoft News Center. Microsoft on Cloud Computing. 2012. Available from: http://www.microsoft.com/presspass/presskits/cloud/ [Accessed on 1-March-2012]; 2012. 4. iCloud. What is iCloud? 2012. Available from: http://www.apple.com/ icloud/what-is.html [Accessed on 1-March-2012]. 5. Raskino M, Mahoney J, Meehan P. Gartner Research Report ID Number G00164278. [CIO New Year’s Resolutions, 2009]; 5 January 2009. 6. Engbers N, Taen E. Green Data Net. Report to IT Room INFRA. European Commision. FP7 ICT 2013.6.2; 2014. 7. Koomey J. Growth in data center electricity use 2005 to 2010. Technical Report, Analytics Press, Oakland, CA; 2011. 8. Donoghue A, Inglesant P, Lawrence A. The EU dreams of renewable-powered datacenters with smart-city addresses. 2013 Available from: https://451research.com [Accessed on March 4, 2015]. 9. Ponemon Institute. 2013 Study on Data Center Outages. Technical Report, Sponsored by Emerson Network Power; September 2013. 10. Hartley J. The truth about data centre cooling. eCool Solutions. 2010. Available from: http://www.bcs.org/upload/pdf/jeremy-hartley. pdf [Accessed on June 25 2014]. 11. Berl A, Gelenbe E, Di Girolamo M, Giuliani G, De Meer H, Dang MQ, Pentikousis K. Energy-efficient cloud computing. The Comput J. 2010;53(7):1045–1051. 12. Niles P, Donovan P. Virtualization and Cloud Computing: Optimized Power, Cooling, and Management Maximizes Benefits. White paper 118. Revision 3. Technical Report, Schneider Electric; 2011. 13. Gandhi A, Harchol-Balter M, Das R, Lefurgy C. Optimal power allocation in server farms. ACM SIGMETRICS Perform Eval Rev. 2009;37(1): 157–168. 14. Rafique MM, Ravi N, Cadambi S, Butt AR, Chakradhar S. Power management for heterogeneous clusters: an experimental study. Proceedings of the 2011 International Green Computing Conference and Workshops, IGCC ’11. IEEE Computer Society, Washington, DC, USA; 2011:1–8. 15. Le Sueur E, Heiser G. Dynamic voltage and frequency scaling: the laws of diminishing returns. Proceedings of the 2010 International Conference on Power Aware Computing and Systems, HotPower’10. USENIX Association, Berkeley, CA, USA; 2010:1–8.
13 of 13
ARROBA ET AL.
16. Wu CM, Chang RS, Chan HY. A green energy-efficient scheduling algorithm using the dvfs technique for cloud datacenters. Future Gener Comput Syst. 2014;37(0):141–147.
26. Wang Y, Wang X. Performance-controlled server consolidation for virtualized data centers with multi-tier applications. Sustainable Comput: Inf Syst. 2014;4(1):52–65.
17. Wang L, von Laszewski G, Dayal J, Wang F. Towards energy aware scheduling for precedence constrained parallel tasks in a cluster with dvfs. Proceedings of the 2010 10th IEEE/ACM International Conference on Cluster, Cloud and Grid Computing, CCGRID ’10, IEEE Computer Society, Washington, DC, USA; May 2010:368–377.
27. Petrucci V, Loques O, Mossé D. A dynamic optimization model for power and performance management of virtualized clusters. Proceedings of the 1st International Conference e-Energy ’10. ACM, New York, NY, USA; 2010:225–233.
18. Huang P, Kumar P, Giannopoulou G, Thiele L. Energy efficient dvfs scheduling for mixed-criticality systems. Proceedings of the 14th International Conference on Embedded Software, EMSOFT ’14. ACM, NY, USA; 2014:11:1–11:10. 19. Rizvandi NB, Taheri J, Zomaya AY, Lee YC. Linear combinations of dvfs-enabled processor frequencies to modify the energy-aware scheduling algorithms. Proceedings of the 10th IEEE/ACM International Conference on Cluster, Cloud and Grid Computing CCGRID’10, Melbourne, Victoria, Australia; May 2010:388–397. 20. Katz RH. Tech Titans Building Boom. February 2009. Available from: http://spectrum.ieee.org/green-tech/buildings/tech-titansbuildingboom/0 [Accessed on 9-March-2012]. 21. Buyya R, Beloglazov A, Abawajy J. Energy-efficient management of data center resources for cloud computing: a vision, architectural elements, and open challenges. Proceedings of the 2010 International Conference on Parallel and Distributed Processing Techniques And Applications. PDPTA 2010, CSREA Press, Las Vegas, USA; July 12-15, 2010:6–20. 22. Ferdaus M, Murshed M, Calheiros R, Buyya R. Virtual machine consolidation in cloud data centers using aco metaheuristic.. In: Silva F, Dutra I, Santos Costa V, eds. Proceedings of the 20th international european conference on parallel processing (Euro-Par’14), Lecture Notes in Computer Science, vol. 8632: Springer International Publishing Switzerland; 2014:306–317. 23. Hermenier F, Lorca X, Menaud JM, Muller G, Lawall J. Entropy: a consolidation manager for clusters. Proceedings of the 2009 ACM SIGPLAN/SIGOPS VEE’09. ACM, NY, USA; 2009:41–50. 24. Liu H, Xu CZ, Jin H, Gong J, Liao X. Performance and energy modeling for live migration of virtual machines. Proceedings of the 20th International Symposium on High Performance Distributed Computing, HPDC ’11. ACM, New York, NY, USA; 2011:171–182. 25. Maio VD, Prodan R, Benedict S, Kecskemeti G. Modelling energy consumption of network transfers and virtual machine migration. Future Gener Comput Syst. 2016;56:388–406.
28. Arroba P, Risco-Martín JL, Zapater M, Moya JM, Ayala JL, Olcoz K. Server power modeling for run-time energy optimization of cloud computing facilities. Energy Procedia. 2014;62(0):401–410. SEB-14. 29. Beloglazov A, Buyya R. Optimal online deterministic algorithms and adaptive heuristics for energy and performance efficient dynamic consolidation of virtual machines in cloud data centers. Concurrency Computat: Pract Exper. 2012;24(13):1397–1420. 30. Minyi Y. A simple proof of the inequality FFD(L) < 11/9 OPT (L) + 1, for all L for the FFD bin-packing algorithm. Acta Mathematicae Applicatae Sinica (English Series). 1991;7(4):321–331. 31. Frey S. Conformance Checking and Simulation-Based Evolutionary Optimization for Deployment and Reconfiguration of Software in the Cloud: Books on Demand GmbH University of Kiel, Department of Computer Science, CAU Kiel; 2014. 32. Calheiros RN, Ranjan R, Beloglazov A, De Rose CAF, Buyya R. Cloudsim: a toolkit for modeling and simulation of cloud computing environments and evaluation of resource provisioning algorithms. Software: Pract Exper. 2011;41(1):23–50. 33. Park K, Pai VS. Comon: a mostly-scalable monitoring system for planetlab. ACM SIGOPS Operating Syst Rev. 2006;40(1):65–74.
How to cite this article:
Arroba P, Moya JM, Ayala JL,
Buyya R. Dynamic voltage and frequency scaling-aware dynamic consolidation of virtual machines for energy efficient cloud data centers. Concurrency Computat: Pract Exper. 2017;29:e4067. https://doi.org/10.1002/cpe.4067