JOURNAL OF GEOPHYSICAL RESEARCH, VOL. 106, NO. C8, PAGES 16,641–16,656, AUGUST 15, 2001
Dynamical interpolation of mesoscale flows in the TOPEX/ Poseidon diamond surrounding the U.S. Joint Global Ocean Flux Study Bermuda Atlantic Time-series Study site D. J. McGillicuddy Jr. and V. K. Kosnyrev Department of Applied Ocean Physics and Engineering, Woods Hole Oceanographic Institution, Woods Hole, Massachusetts
Abstract. An open boundary ocean model is configured in a domain bounded by the four TOPEX/Poseidon (T/P) ground tracks surrounding the U.S. Joint Global Ocean Flux Study Bermuda Atlantic Time-series Study (BATS) site. This implementation facilitates prescription of model boundary conditions directly from altimetric measurements (both T/P and ERS-2). The expected error characteristics for a domain of this size with periodically updated boundary conditions are established with idealized numerical experiments using simulated data. A hindcast simulation is then constructed using actual altimetric observations during the period October 1992 through September 1998. Quantitative evaluation of the simulation suggests significant skill. The correlation coefficient between predicted sea level anomaly and ERS observations in the model interior is 0.89; that for predicted versus observed dynamic height anomaly based on hydrography at the BATS site is 0.73. Comparison with the idealized experiments suggests that the main source of error in the hindcast is temporal undersampling of the boundary conditions. The hindcast simulation described herein provides a basis for retrospective analysis of BATS observations in the context of the mesoscale eddy field.
1.
Introduction
Ocean time series measurements at fixed locations are among the most valuable means for assessing temporal trends in physical, biological, and chemical properties of the water column. Depth profile data at such sites provide a onedimensional window into oceanic variability on timescales ranging from the sampling interval to the length of the record. However, three-dimensional effects can pose some challenges for interpretation. Without additional information about the surrounding waters it can be difficult to distinguish temporal changes from spatial heterogeneity moving past the site. Moreover, if such three-dimensional phenomena play a role in maintaining the mean conditions, their signature in a onedimensional time series may not be adequate to deduce the mechanisms by which this impact is expressed. In such circumstances it is of interest to obtain the spatial context in which the time series observations are embedded [e.g., Mitchum, 1996]. Motivation to provide such information around the U.S. Joint Global Ocean Flux Study (JGOFS) Bermuda Atlantic Time-series Study (BATS) site arose from the recognition that mesoscale phenomenology is relevant to both aspects: mesoscale variability is aliased into the time series record, and the underlying processes contribute significantly to biogeochemical cycling in the Sargasso Sea. Analysis of BATS hydrographic data with a one-dimensional model revealed month-to-month variability that cannot be explained by local air-sea fluxes; these anomalies are almost certainly associated with mesoscale advection [Doney, 1996]. Comparison of two nutrient profiles Copyright 2001 by the American Geophysical Union. Paper number 2000JC000363. 0148-0227/01/2000JC000363$09.00
sampled 1 month apart in the summer of 1986 suggested an eddy-driven nutrient injection event that could account for 20 –30% of the annual new production [Jenkins, 1988]. Since that time, additional evidence has accumulated that suggests that mesoscale eddies supply a significant portion of the annual nutrient budget [McGillicuddy et al., 1998]. Regional numerical simulations suggest eddy-induced upwelling causes intermittent fluxes of nitrate into the euphotic zone of magnitude sufficient to balance the nutrient demand implied by geochemical estimates of new production [McGillicuddy and Robinson, 1997a]. Nitrate flux calculations based on satellite altimetry and a statistical model linking sea level anomaly to subsurface isopycnal displacements provide estimates of comparable order [Siegel et al., 1999]. Analysis of observations capable of resolving mesoscale fluctuations reveals that they are replete with this phenomenology. High-resolution time series from the Bermuda Testbed Mooring program [Dickey et al., 1999] documented a nutrient pulse and associated increase in chlorophyll and particulate material associated with the passage of an eddy [McNeil et al., 1999]. Mesoscale biogeochemical surveys carried out as part of the BATS validation activities demonstrate that eddy-induced upward displacement of density surfaces can inject nutrients into the euphotic zone and result in the accumulation of biomass in the overlying waters [McGillicuddy et al., 1999]. Finally, satellite data show covariation in mesoscale ocean color and sea surface temperature patterns in the Sargasso Sea that are consistent with these ideas [McGillicuddy et al., 2001]. The technology for detecting oceanic mesoscale phenomena from satellite-based altimetric measurements dates back to the late 1970s with the GEOS-3 [Tapley et al., 1982] and Seasat [Stanley, 1979] missions. Since then, regular coverage over a
16,641
16,642
MCGILLICUDDY AND KOSNYREV: HINDCASTING THE BATS TIME SERIES
large portion of the world ocean has been provided by Geosat (1986 –1989) [Douglas and Cheney, 1990], the European Space Agency’s ERS satellites (1991–present) [Archiving, Validation, and Interpretation of Satellite Oceanographic data (AVISO), 1997], and TOPEX/Poseidon (1992–present) [Fu et al., 1994]. As with any mapping operation, competing interests of spatial and temporal resolution determine the ground tracks of the satellite’s orbital configuration. For example, the TOPEX/ Poseidon (T/P) instrument completes its global coverage once every 10 days; adjacent ground tracks are spaced ⬃250 km apart at the latitude of Bermuda. In contrast, ERS-1 and ERS-2 tracks are much closer (about 70 km around Bermuda) at the expense of a longer repeat cycle (35 days). The T/P and ERS missions occupy opposite ends of the space/time resolution requirements needed for direct diagnosis of mesoscale processes in this region. Observations from the Mid-Ocean Dynamics Experiment (MODE) and its successor program POLYGON Mid-ocean Dynamics Experiment (POLYMODE) programs documented eddy sizes in the Sargasso Sea on the order of 100 –150 km, with synoptic dynamical timescales (i.e., the minimum time period for significant changes in mesoscale flows) of 10 –15 days [Richman et al., 1977; The MODE Group, 1978; Harrison and Heinmiller, 1983]. Thus the T/P repeat cycle can adequately resolve temporal variations in the eddies near Bermuda, but the ground tracks are far enough apart that an entire eddy can fit in between them. Closer spacing of the ERS tracks insures satisfactory spatial coverage, but the repeat cycle is so long that important temporal dynamics can be missed. Clearly, some form of interpolation is needed to provide a basis from which to diagnose mesoscale fluctuations in the BATS time series. Siegel et al. [1999] describe a statistical approach to this problem based on objective analysis of T/P and ERS altimetry. Our objective here is to use a data assimilative model to provide a dynamical basis for space/time interpolation. A variety of techniques have been used to incorporate satellite altimetry into numerical models. Excellent overviews of the subject of ocean data assimilation are provided by Bennett [1992], Wunsch [1996], and Malanotte-Rizzoli [1996]; only a few illustrative examples pertaining to the use of altimetry are mentioned here. Some of the earliest applications with limited area models utilized simple methods of data insertion for model initialization and boundary condition specification [e.g., DeMey and Robinson, 1987]. Although such approaches could be used to keep relatively small regional models on track for short time periods [e.g., Dombrowsky and DeMey, 1992], the need for long-term simulations over large regions necessitated continuous assimilation of data in the interior. One of the most straightforward techniques for doing so is to “nudge” the numerical model toward observations via a forcing term added to the model equations. Nudging with altimeter data has been used to construct simulations of ocean circulation in a variety of regions [e.g., Holland and Malanotte-Rizzoli, 1989; Blayo et al., 1994, 1997; Capotondi et al., 1995a, 1995b; Stammer, 1997]. Optimal interpolation is a slightly more sophisticated approach in which the error characteristics of the observations are used to determine the weighting of model and data in the blending procedure. A different class of assimilation techniques involves use of the model dynamics as a constraint in the estimation problem; this includes the Kalman filter (and smoother) and the adjoint method. Although direct implementation of the Kalman filter continues to be impractical for large-scale oceanographic problems, approximations to this algorithm have proven to be effective in using altimeter data in both regional
applications [e.g., Fukumori and Malanotte-Rizzoli, 1995; Brasseur et al., 1999; Chen et al., 1998; Verron et al., 1999] and global general circulation models [e.g., Fukumori et al., 1999]. The adjoint method has been used successfully with altimeter data in several different contexts to invert for control variables (such as initial conditions, boundary conditions, and model parameters), which minimize an objective function measuring goodness of fit to the observations [e.g., Moore, 1991; Schro ¨ter et al., 1993; Morrow and DeMey, 1995; Vogeler and Schro ¨ter, 1999]. Nearly all of the examples of altimetric data assimilation described above deal with model domains that are regional or larger than regional in their spatial extent. That is, the operational area spans much more than a single set of adjacent ground tracks. The intent here is to provide mesoscale context for time series observations at BATS, a single point within the diamond-shaped domain bounded by two ascending and two descending T/P lines. The approach is to configure a model domain so that its boundaries are matched to the T/P diamond as closely as possible. This facilitates specification of the required boundary conditions directly from altimetry. For a domain of sufficiently small dimensions (such as this one), evolution of the interior will be almost entirely controlled by the boundary conditions. In a sense the model is used to interpolate dynamically in between T/P ground tracks. In contrast with purely statistical interpolation such as objective analysis, this approach yields four-dimensional field estimates that are dynamically consistent with model physics. This study consists of two main elements. First, simulated data are used to conduct identical twin experiments to determine the expected error levels in the model interior given perfect boundary condition information at various intervals. Second, the T/P diamond model is forced along its boundaries with actual altimetric observations from 1992 to 1998. Its performance is then evaluated with observations in the interior.
2. 2.1.
Methods Model Description
A quasigeostrophic (QG) model is used for the assimilation experiments described herein. The relevance of the QG equations to open ocean mesoscale flows has been established on theoretical grounds [Bretherton and Karweit, 1975; Charney and Flierl, 1981], analysis of observations [McWilliams, 1976], and numerical simulation [Haidvogel, 1983]. A detailed description of the model is provided by Robinson and Walstad [1987, and references therein], so it will be described only briefly here. The model has been applied in a number of areas throughout the world ocean, with extensive use in the Sargasso Sea. Of particular interest here are ocean prediction experiments that demonstrate predictive skill in the region [Robinson and Leslie, 1985; Carton, 1987; Walstad and Robinson, 1990]. In addition, it has been used for detailed dynamical process studies of these flows [Pinardi and Robinson, 1987; Spall, 1989]. The prognostic equation is
t ⫹ ␣ J共 , 兲 ⫹  x ⫽ F pqr,
(1)
where is the stream function and is the dynamic vorticity given by 2 ⫽ ⵜH ⫹ ⌫ 2共 z兲 z.
(2)
The Jacobian J is defined as J( , ) ⫽ x y ⫺ y x , and F pqr represents a Shapiro filter that is used to parameterize sub-
MCGILLICUDDY AND KOSNYREV: HINDCASTING THE BATS TIME SERIES
16,643
Table 1. Model Parametersa Parameter
Value
Computational Parameters Horizontal resolution ⌬x Vertical resolution Time step ⌬t Physical Scales Timescale t 0 Space scale D Vertical scale H Velocity scale V 0 Buoyancy frequency scale N 0 Coriolis parameter f 0 f 0 ’s meridional gradient 0
␣ ⫽ V 0 t 0 D ⫺1  ⫽  0 Dt 0 ⫺2 ⌫ 2 ⫽ f 20 D 2 N ⫺2 0 H
10 km 6 levels 4320 s
10 days 27 km 700 m 0.04 m s⫺1 0.55 䡠 10⫺2 s⫺1 0.77 䡠 10⫺4 s⫺1 2.00 䡠 10⫺11 m⫺1 s⫺1
Nondimensional Parameters
1.5 0.5 0.3
Additional Control Parameters Used in Hindcasting 0.3 Deep EOFa amplitude Vorticity filtering 50 km, 7.5 d a
EOF, empirical orthogonal function.
gridscale dissipation. The stratification is given by ( z) ⫽ N 20 /N 2 , where N is the Brunt-Va¨isa¨la¨ frequency and N 0 is its typical scale. Computational parameters and the nondimensional numbers ␣, , and ⌫2 are described in Table 1. Lateral boundary conditions are of the Charney, Fjo ¨rto ¨ft, and von Neumann type: stream function is prescribed everywhere along the boundary, whereas vorticity is specified only at inflow points. In this particular application, surface and bottom boundary conditions consist of a rigid lid and a frictionless flat bottom. Explicit treatment of the surface boundary layer [Walstad and Robinson, 1993; McGillicuddy and Robinson, 1997b] will be included in future work. 2.2.
Simulated Data and Identical Twin Experiments
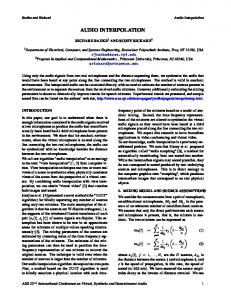
In order to assess the error characteristics of the T/P diamond model if it were fed perfect boundary condition information, identical twin experiments were conducted with simulated data. These “data” are generated by forcing the model along the boundaries of a large (106 km2) domain with timedependent statistical representations of typical synoptic features in the region. This boundary forcing consists of Rossby wave fits to the MODE data computed by McWilliams and Flierl [1976], including the surface intensification of modal amplitudes documented by McWilliams [1974]. Starting from an arbitrary initial condition, the model is run out to statistical steady state. Far enough away from the direct boundary forcing, the freely evolving interior takes on a realistic character (Figure 1). This technique has been used to produce environmental fields for forecasting studies in the region by Robinson and Haidvogel [1980] and Miller and Robinson [1984], as well as nutrient transport calculations by McGillicuddy and Robinson [1997a]. This configuration was deliberately chosen over other alternatives (such as spin-down in a doubly periodic domain) to facilitate long-term simulations from which robust statistics can be derived. Simulated fields are extracted from a 105 km2 interior subdomain, which is of approximately the same dimensions as the T/P diamond model. Results archived on a daily basis constitute a “perfectly” sampled representation of the ocean, which
Figure 1. Simulated nondimensional stream function field at 100 m after 880 days of integration. The entire model domain is 1000 km on a side, and the dimensions of the interior subdomain from which simulated data are extracted are 312 km by 312 km. The zero contour is bold; positive and negative contours are solid and dashed lines, respectively. obeys the model equations to within numerical accuracy. This solution can thus be used as a basis to evaluate the capability of the T/P diamond model to reconstruct evolution of its interior based only on information provided at the boundaries. 2.3. Altimetric Observations and the Assimilation Procedure Merged sea level anomaly (SLA) data from ERS-1, ERS-2, and T/P were obtained via CD-ROM from the AVISO [1997] project. ERS and T/P data were combined with a global minimization algorithm using dual-crossover differences [Le Traon et al., 1995; Le Traon and Ogor, 1998], which result in compatible orbit error characteristics. Ground tracks in the vicinity of Bermuda are shown in Figure 2. The BATS site lies near the southwestern edge of a T/P diamond, very near an ERS crossover point. Field estimates of SLA were derived from the alongtrack observations using an objective analysis (OA) algorithm based on that of Carter and Robinson [1987]. The details of this procedure are provided by Siegel et al. [1999] and therefore are presented here only briefly. A correlation model of the form C共R, ⌬t兲 ⫽ exp
冉冊 冉 冊 冉 冊 R c1
cos
2
R c2
exp ⫺
兩⌬t兩 c3
was utilized [see Thie´baux and Pedder, 1987], where the space/ time distance R ⫽ 公(⌬x ⫺ c 4 ⌬t) 2 ⫹ ⌬y 2 accounts for the observed westward phase propagation of features in this region. This function was fit to the SLA data to obtain the empirical constants c 1 ⫽ 175 km, c 2 ⫽ 575 km, c 3 ⫽ 26 days, and c 4 ⫽ ⫺4.3 km d⫺1. Daily SLA maps were produced on a uniform grid that was subsequently interpolated onto a 10 km mesh for incorporation into the model. Objectively analyzed altimetric observations provide a direct estimate of the upper level stream function in the QG model via the relation
1 ⫽
g SLA, V 0f 0D
16,644
MCGILLICUDDY AND KOSNYREV: HINDCASTING THE BATS TIME SERIES
where g is the acceleration of gravity and the remaining parameters are defined in Table 1. Near-surface stream function must be projected vertically onto the deeper levels using a set of basis functions, for which there are a number of possible choices. We experimented with several, including the dynamical modes of the vertical structure equation, subjectively chosen profiles, and empirical orthogonal functions (EOFs) derived from 0 to 4000 m dynamic height anomalies computed from BATS hydrography. Model results are not overly sensitive to the details of the extension procedure, but the EOF method clearly worked best in this application. It takes the form
k ⫽ 1
Figure 2. Ground tracks for T/P (solid lines) and ERS (dotted lines) altimetry. Repeat cycles are 10 and 35 days, respectively. The bold line indicates the boundaries of the rectangular model domain fit to the T/P diamond.
EOFk , k ⫽ 2, 6. EOF1
In this study only the first EOF is used, as it contains almost 98% of the variance (Figure 3). Because the conductivitytemperature-depth (CTD) data do not extend all the way to the bottom, the barotropic contribution to SLA variability is not accounted for in the EOF calculations. For the purposes of this extension procedure a constant partitioning between baroclinic and barotropic modes is assumed. In other words, energy in the barotropic mode is taken to be proportional to that which resides in the baroclinic mode (as represented in the EOF decomposition). This is implemented by adding an empirically derived constant to the EOF profile shown in Figure
Figure 3. Vertical structure at the BATS site computed from observations between October 1992 and September 1998: (a) mean density and Brunt-Va¨isa¨la¨ frequency profiles, (b) mean dynamic height (solid line) ⫾1 standard deviation (dashed lines), and (c) the first three EOFs of dynamic height anomaly.
MCGILLICUDDY AND KOSNYREV: HINDCASTING THE BATS TIME SERIES
Table 2. Assimilation Experiments Using Simulated Data in Which the Boundary Condition Updating Frequency is Varieda
Run 1 2 3
Updating Frequency, days
NRMS Error, %
NRMS Error, %
1 4 10
6.8 7.8 21.9
28.0 29.4 40.1
a Stream function and vorticity error statistics reported here are the temporal average (days 100 – 800) of the RMS differences between simulated fields and the reference solution integrated over the model domain, normalized by the time-mean RMS of the reference fields.
3c. This constant representing the barotropic component of SLA is evaluated through sensitivity analysis (see below). The full three-dimensional stream function field created by vertical projection of objectively analyzed SLA provides all the information necessary to compute the two terms of the dynamic vorticity defined in (2). Spatial derivatives in these vorticity calculations tend to amplify noise in the observed fields, which can have an adverse effect on the quality of the boundary conditions. To counterbalance this effect, the alongboundary vorticity is smoothed with a two-dimensional (spacetime) Gaussian filter. Sensitivity experiments indicated that the optimal filtering parameters for this application are half-width scales of 50 km and 7.5 days. The procedure described above thus provides a method for obtaining all the initial and boundary condition information needed to drive the dynamical model (equations (2)–(3)) from altimetric observations. The “assimilation” method is simply to initialize the model with these analyses and provide boundary condition updates on a daily basis (with linear interpolation in between). Thus there are no data assimilated in the interior other than those used in the initial condition. In the parlance of Bennett [1992] this procedure can be categorized as a very simple application of the sequential estimation problem.
3. 3.1.
Results Assimilation of Simulated Data
A set of three experiments was carried out to ascertain the degree to which error characteristics of dynamical interpolation in a model domain the size of the T/P diamond depend on the frequency at which boundary condition information is supplied. In each case the model is started at rest and then fed boundary conditions from the simulated data set at the prescribed intervals (with linear interpolation in between updates). Values of the computational parameters, physical scales, and nondimensional parameters are listed in Table 1. Table 2 summarizes the results of these computations for boundary updating of 1, 4, and 10 day intervals. Temporal evolution of the stream function and vorticity errors is shown in Figure 4. For the timescales associated with mesoscale flows in this region, 1 day boundary condition updating is essentially continuous. Ten day updating reflects that which can be provided by the T/P altimeter given its repeat cycle, and 4 day updating represents an intermediate case. In all three experiments, there is rapid adjustment of the stream function field owing to the elliptic nature of (2). Vorticity adjustment is slightly more protracted because of the time required for information to propagate into the domain. After approximately
16,645
60 days (the time required for features to transit the domain at an average phase speed of 5 km d⫺1) the model fields are fully equilibrated and are essentially independent of the initial conditions. Thus the statistics reported in Table 2 are computed for days 100 – 800. The results of 1 and 4 day updating experiments are nearly identical, with normalized RMS stream function errors of ⬍10%. Examination of the fields shows that these are mostly composed of slight errors in phase and amplitude. Occasional events drive the stream function error higher than average. For example, around day 500 a large anticyclone begins to propagate into the domain from the east, intensifying as it moves westward. This intensification occurs mostly in the interior of the domain and is largely driven by interactions with the surrounding eddies, which are mostly outside the domain. The geometry of this situation, that a highly dynamic event straddles the edge of the model domain, degrades the ability of the model to reconstruct the evolution of the interior from boundary condition information alone. In this particular instance this issue results in underprediction of the anticyclone’s intensification, causing the RMS stream function error to approach 20% (Figure 5). Note, however, that despite the increase in relative error, the general characteristics of the simulated fields track that of the reference ocean quite closely. For animated visualizations of the results, see http://science.whoi.edu/users/ mcgillic/tpd/anim.html. Error characteristics for 10 day updating are noticeably degraded in comparison with more frequent updating. Although the RMS stream function error is acceptable on average (22%), there are sporadic episodes during which error levels climb beyond 50% (Figure 4). Just as in the prior cases, these periods of anomalously high error are associated with eddyeddy interactions that straddle the model boundary. Whereas more frequent boundary updating is able to keep the interior solution firmly on track, in certain circumstances, 10 day updating allows for fairly significant errors in phase and amplitude. Nevertheless, even for the incidents of highest stream function error, the character of the simulated fields is similar to that of the reference ocean (Figure 6). Scatterplots of predicted versus reference SLA for the three experiments reveal yet another aspect of the error characteristics (Figure 7). Updating at 1 and 4 day intervals simply produces scatter about the 1:1 line, with slopes of the best fit line that are not significantly different from 1.0 at the 95% confidence interval. However, 10 day updating introduces significant smoothing of features, such that the amplitude of the predicted SLA in the interior is only 83% of that in the reference ocean. 3.2.
Assimilation of T/P and ERS Data
Results in section 3.1 were based on simulated data for which the underlying physics (provided by the model) was perfectly known and the boundary conditions were sampled without error. Use of real observations to simulate the natural system is significantly more complicated, owing to imperfections in the model, noise in the data, and errors in the approximations used in the assimilation procedure. In addition, construction of a skillful hindcast requires choosing optimal values for a collection of control parameters that are not known a priori. The approach here is to conduct a set of sensitivity experiments in which these parameters are systematically varied within the envelope of reasonable limits to ascertain an “optimal” set of values using objective metrics of simulation skill.
16,646
MCGILLICUDDY AND KOSNYREV: HINDCASTING THE BATS TIME SERIES
Figure 4. Time series of (a) stream function and (b) vorticity errors for three assimilation experiments using simulated data. Bold, dashed, and thin lines represent 1, 4, and 10 day boundary condition updating, respectively. Error statistics represent the RMS difference between simulated fields and the reference solution integrated over the model domain.
Clearly, this method is not guaranteed to result in a truly optimal set unless all possible combinations of values are tried (which is obviously impractical). Nevertheless, by executing a large number of runs (several hundred) it is possible to examine a significant portion of parameter space and thereby assess the robustness of the results with respect to these unknowns. Rather than document the entire ensemble of runs carried out in this undertaking, a base case will be presented along with selected sensitivity experiments. First, the central run will be described, which is the most faithful representation of the natural system that we were able to achieve. Then a series of sensitivity experiments about that central case will be shown, which illustrates how the results depend on the particular choices of control parameters. The central hindcast simulation was initialized on October 27, 1992, from an objective analysis of SLA and run forward to the end of the available data on September 16, 1998. Results are available in animated form on the Web at http:// science.whoi.edu/users/mcgillic/tpd/anim.html. An example snapshot at a particular time is shown in Plate 1. There are a variety of metrics that can be used to evaluate the skill of these simulations. The time series of normalized RMS difference between simulated SLA and OA of the altimetric observations (averaged over the model domain, exclu-
sive of boundary points) provides a measure of how well the model tracks observed eddy structures in an integrated sense (Figure 8a). Note that this is not a perfectly independent metric; points close the edges of the model domain will obviously be correlated with those used in the boundary condition forcing. The robustness of this metric relies very heavily on ERS data to fill in the interior of the T/P diamond. For time periods when ERS data are not available (as in 1994 and the beginning of 1995) this measure is reduced to an assessment of the degree to which dynamical interpolation of T/P data by the model matches purely statistical interpolation via objective analysis. A more independent test is provided by direct comparison of predicted SLA with individual ERS observations in the interior of the model domain (Figure 8c). This requires sampling the model output in space and time along each of the ERS ground tracks, extracting the predicted SLA at the model gridpoint that is closest to each of the ERS observations. This comparison leads to three quantitative metrics: the RMS difference between the predicted and observed values, their correlation coefficient, and the slope of the least squares fit. The y intercept of the least squares fit is not included in this list because in most cases it is not significantly different from zero. The BATS CTD data provide a completely independent
MCGILLICUDDY AND KOSNYREV: HINDCASTING THE BATS TIME SERIES
16,647
Figure 5. (top) Simulated stream function and vorticity (both nondimensional) at 100 m on day 539 from the experiment with daily boundary condition updates. (middle) The same fields from the reference solution. (bottom) Difference between simulated and reference fields.
measure of hindcast skill, as these observations were not used at all in the boundary condition forcing. The time series of predicted dynamic height anomaly ⌬D versus that computed from hydrographic profiles at BATS (Figure 8b) provides a measure of how well the model is able to reconstruct mesoscale fluctuations at this particular point. Presentation of these two quantities in ensemble format (Figure 8d) provides an additional three metrics analogous to those introduced for the ERS comparisons shown in Figure 8c. Note that the CTD-derived dynamic height anomaly estimates are based on observations that do not extend all the way to the bottom and thus do not include barotropic contributions to the total variance in SLA. 3.3.
Sensitivity Analysis
The central run evaluated in Figure 8 reflects the best fit to the observations we were able to obtain through variation of the model control parameters within the range of their expected values. These control parameters are the deep ampli-
tude of the EOF used in the stream function projection scheme, the space scale and timescale on which the vorticity boundary condition is filtered, and the nondimensional parameters of the dynamical model itself (Table 1). A series of experiments will now be presented to quantify the sensitivity of the results to the particular choices of parameters used in the central run. The various metrics of hindcast skill are well behaved over a wide range of choices for the EOF amplitude at depth (Figure 9). For amplitudes less than the central value of 0.3, RMS differences between predicted and observed SLA values based on both altimetry and BATS hydrography rise significantly. Changes in the model performance are less pronounced for amplitudes larger than the central value, but all three RMS metrics are either slightly degraded or remain the same. Thus the central value appears to be at the center of a local minimum in the RMS error measures. The statistics of the least squares fit between predicted and observed SLA values are
16,648
MCGILLICUDDY AND KOSNYREV: HINDCASTING THE BATS TIME SERIES
Figure 6. (top) Simulated stream function and vorticity (both nondimensional) at 100 m on day 595 from the experiment with 10 day boundary condition updates. (middle) The same fields from the reference solution. (bottom) Difference between simulated and reference fields.
Figure 7. Predicted versus reference ocean SLA for (a) 1, (b) 4, and (c) 10 day updating experiments. RMS differences between predicted and reference values are shown in the upper left corner of each plot. Statistics of the least squares fit are shown at the lower right: correlation coefficient r, y intercept a, and slope b.
MCGILLICUDDY AND KOSNYREV: HINDCASTING THE BATS TIME SERIES
16,649
Plate 1. An example snapshot of model output (October 31, 1995) from the central hindcast: (a) predicted SLA, (b) objectively analyzed SLA (white and green lines show T/P and ERS ground tracks, respectively), (c) difference between simulated and observed SLA, and (d) time series of RMS difference between simulated and observed SLA averaged over the model interior (black vertical bar indicates the time of this particular snapshot).
relatively insensitive to the amplitude of the EOF at depth. The central value produces simulations with correlation coefficients and slopes of the least squares fits to the altimetric and hydrographic data that are at or near their maximal values (although the differences between runs are minor in these metrics). Filtering the along-boundary vorticity turns out to be a crucial step in the hindcasting scheme. A time series of the vorticity computed directly from the stream function reveals the noisiness of the field introduced by the spatial derivatives involved in the calculation (Figure 10). Smoothing this time series in the space-time phase plane with a Gaussian filter with half widths of 50 km and 7.5 days reduces this noise considerably. The necessity of this step is borne out by the serious degradation of hindcast skill when the unfiltered vorticity is used (Figure 9). A suite of numerical experiments (not shown) was used to determine the filtering parameters used here. Finally, the sensitivity of the hindcast skill with respect to the nondimensional parameters of the dynamical model is evaluated. The values used in the central run (Table 1) are based on regional estimates of the various physical scales taken from the
literature. Clearly, these scales used to compute the nondimensional parameters are imperfectly known, so it is of interest to verify that the model is properly tuned for use in this region. Figure 11 shows three families of curves within each evaluation metric in which ␣ is systematically varied for different values of . Both parameters clearly affect the solution. The parameter  controls the Rossby wave phase speed and is therefore crucial to attaining proper propagation of mesoscale features. For the central value of ␣ (1.5), increasing or decreasing  from its central value (0.5) degrades the solution accordingly. Nonlinearity of the simulation is controlled by ␣. For the central value of , changing ␣ from its central value also diminishes hindcast skill. The effects of stratification are controlled by ⌫2. Once again, perturbation from the central value significantly reduces the fidelity of the solution (Figure 12). Thus all three effects (nonlinearity, the  effect, and stratification) are important in creating a realistic simulation. This sensitivity analysis demonstrates that the central run results in values of the various hindcast skill metrics that are generally equal to or better than the best achieved in this exploration of parameter space.
16,650
MCGILLICUDDY AND KOSNYREV: HINDCASTING THE BATS TIME SERIES
Figure 8. Evaluation of hindcast skill for the central run. (a) Time series of normalized RMS difference between predicted and objectively analyzed SLA in the interior of the model domain. Mean value for the entire simulation is indicated in the upper left hand corner. Note the time period in 1994 and the beginning of 1995 for which ERS data are not available. (b) Time series of predicted dynamic height anomaly ⌬D versus that inferred from CTD observations at the BATS site. (c) Predicted SLA versus that observed from ERS in the interior of the model domain. The RMS error is indicated in the upper left corner, and the statistics of a least squares fit between these two quantities are shown on the lower right (r is the correlation coefficient, a is the y intercept, and b is the slope). Note that this is an ensemble presentation of what is shown in Figure 8a. (d) Predicted ⌬D versus that inferred from BATS CTD observations. This is an ensemble presentation of the time-domain comparison shown in Figure 8b. Statistics of the comparison are analogous to those in Figure 8c.
MCGILLICUDDY AND KOSNYREV: HINDCASTING THE BATS TIME SERIES
16,651
Figure 9. Sensitivity of the hindcast skill to the EOF amplitude at depth (open squares): (a) normalized RMS difference between predicted SLA and objective analysis of T/P and ERS altimetric observations, (b) RMS difference between predicted SLA and ERS observations in the interior of the model domain, (c) correlation coefficient from the least squares fit of the same, (d) slope of the least squares fit to the same, and (e)–(g) statistics analogous to Figures 9b–9d based on BATS hydrography. In each panel the central run is indicated by a solid square, and the run using unfiltered vorticity is indicated by a triangle. Note that in Figure 9f the triangle is obscured by the solid square.
4.
Discussion
4.1. Idealized Simulations Assimilation experiments using simulated data establish the error characteristics that could be expected in this application under ideal conditions, i.e. what would be achievable if the model physics were perfect, the approximations used in the vertical projection scheme were completely valid, and SLA observations contained no measurement error. Once the model equilibrates from its arbitrary initial condition (after ⬃60 days), it is able to recreate the reference ocean almost perfectly with boundary conditions updated on a daily basis
(Figure 7). Slight errors (RMS SLA ⬍1 cm) in the structure of the mesoscale field crop up intermittently during periods when the interfacial region between interacting eddies coincides with the model boundary. Errors of this type are accentuated as the boundary condition updating interval is lengthened to that characteristic of the T/P repeat cycle (10 days). Moreover, this reduction in updating frequency introduces noticeable smoothing of the simulated fields. Whereas the slope of the least squares fit of the predicted versus reference SLA was not significantly different from 1.0 for 1 day updating, 10 day updating reduces that slope to 0.83 (Figure 7). Nevertheless, 10
16,652
MCGILLICUDDY AND KOSNYREV: HINDCASTING THE BATS TIME SERIES
Figure 10. Time series of along-boundary vorticity at 100 m: (top) unfiltered and (bottom) smoothed with a space-time Gaussian filter (see text). White horizontal lines indicate corners of the model domain.
day updating results in a reconstruction of the reference ocean that is still quite robust both qualitatively and quantitatively, with an RMS SLA difference of only 1.44 cm. 4.2.
Data-Driven Hindcasts
Hindcast simulations driven with real data clearly cannot be expected to reach the error floor identified in the idealized experiments. Errors in the model physics, noise in the data, and limitations of the assimilation procedure all tend to reduce hindcast skill. Nevertheless, the central hindcast comes remarkably close to these benchmarks. The correlation between predicted SLA and ERS measurements in the interior of the model domain is 0.89, with an RMS SLA difference of only 6.5 cm (Plate 1). This latter statistic is particularly noteworthy given measurement error on the order of 3–5 cm [Fu et al., 1994; Tapley et al., 1994; AVISO, 1997]. It is also worth noting that there is no perceptible adjustment to initial conditions in any of the metrics used to assess the skill of the hindcast simulations. The idealized experiments using simulated data demonstrated that the model solution becomes essentially independent of initial conditions after ⬃60 days. Because there is no sign of anomalously high error at the beginning of the hindcast simulation, it appears that the initialization procedure based on objective analysis of SLA is satisfactory. Simulated dynamic height anomaly at the BATS site generally tracks the major features observed during this time period,
with the exception of late 1994 and early 1995. The correlation coefficient between predicted and observed ⌬D is 0.73, somewhat less than that computed for the altimetric comparisons. This is likely related to the fact that the ERS comparisons include an ensemble of measurements that are spread over the model domain, some close to the boundary, where the model is more constrained to be consistent with observations, and others in the interior, where the model evolves more freely. In contrast, the BATS data facilitate a comparison at a single site relatively far away from the model boundary, so a weaker correlation is to be expected. It is worthwhile pointing out that the RMS ⌬D difference at BATS is smaller than the RMS SLA difference averaged over the model domain. This too is not surprising given that (1) the altimetric measurements include a barotropic contribution that is not treated in the dynamic height calculations and (2) BATS observations during this time period may not have adequately sampled extreme events. Despite these differences both the altimetric and hydrographic comparisons reveal smoothing of comparable magnitude. In both cases the slope of the least squares fit to the predicted versus observed mesoscale fluctuations is ⬃0.7 (Figures 8c and 8d). In other words, the amplitude of the predicted anomalies is about 30% less than that of the observed. Results from the idealized experiments using simulated data suggest that a significant portion of this smoothing can be attributed to the frequency at which boundary condition information is pro-
MCGILLICUDDY AND KOSNYREV: HINDCASTING THE BATS TIME SERIES
16,653
Figure 11. Sensitivity of the hindcast skill to variations in nondimensional parameters ␣ and : (a) normalized RMS difference between predicted SLA and objective analysis of T/P and ERS altimetric observations, (b) RMS difference between predicted SLA and ERS observations in the interior of the model domain, (c) correlation coefficient from the least squares fit of the same, (d) slope of the least squares fit to the same, and (e)–(g) statistics analogous to Figures 11b–11d based on BATS hydrography. vided. Updating all four boundaries in synchrony every 10 days led to smoothing of ⬃20% (Figure 7). Although this sampling interval is characteristic of the T/P repeat cycle, it does not reflect temporal offsets in sequence in which the various ground tracks are occupied. Thus the comparison is not a perfect one. Nevertheless, this suggests that approximately two thirds of the smoothing present in the realistic case can be attributed to the interval at which boundary condition updates are available. The remaining one third is presumably due to some combination of the smoothing associated with objective analysis of the observations (Figure 13), filtering of the alongboundary vorticity field, and approximations inherent in the model physics and assimilation procedure.
5.
Conclusions
Satellite altimetry provides an enormously powerful method of observing the ocean. However, competing interests of spa-
tial and temporal resolution make it impractical to resolve mesoscale variability fully. Instruments currently in operation illustrate this tradeoff: the relatively short repeat cycle of T/P necessitates track lines that are far enough apart to accommodate multiple eddies in between them, whereas the relatively fine spacing between ERS tracks makes the repeat cycle longer than the mesoscale decorrelation time. Thus some form of space/time interpolation is needed to produce continuous field estimates. The results presented herein demonstrate the feasibility of using an open boundary model to interpolate dynamically mesoscale variability in between T/P ground tracks. Implementation of the model so that the edges of the domain coincide with T/P lines maximizes the utility of the altimetric information for providing the necessary boundary conditions. Idealized experiments with simulated data showed that the model dynamics were sufficient to predict the evolution of the interior only on the basis of information provided at the boundaries. Clearly,
16,654
MCGILLICUDDY AND KOSNYREV: HINDCASTING THE BATS TIME SERIES
Figure 12. Sensitivity of the hindcast skill to variations in nondimensional parameter ⌫2: (a) normalized RMS difference between predicted SLA and objective analysis of T/P and ERS altimetric observations; (b) RMS difference between predicted SLA and ERS observations in the interior of the model domain, (c) correlation coefficient from the least squares fit of the same, (d) slope of the least squares fit to the same, and (e)–(g) statistics analogous to Figures 12b–12d based on BATS hydrography. this approach would not be tractable for arbitrarily large domains; with more remote boundary forcing, assimilation of data in the interior would be needed to maintain the fidelity of the simulation. However, in the present application, altimetrically derived boundary conditions are sufficient to produce a skillful hindcast. Although the hindcast skill is significant, it is clearly not perfect. Analysis of the idealized experiments indicates that approximately two thirds of the smoothing present in the hindcast is due to the 10 day interval between boundary condition updates. It is possible that this error characteristic could be ameliorated by adopting a more sophisticated approach to data assimilation. For example, the adjoint method could be used to invert for perturbations to the observed boundary
conditions that would minimize some error metric based on ERS altimetry and BATS observations in the model interior. This task is left for future work. Another aspect worthy of additional research is the role of surface forcing. Although the present model can accurately represent the near-surface expressions of eddy motions associated with fluctuations of the main thermocline, phenomena driven by surface fluxes of heat, salt, and momentum are not yet treated explicitly. Future enhancements to this system will include such processes in the context of a coupled surface boundary layer that has been coupled to this very same QG model [Walstad and Robinson, 1993; McGillicuddy and Robinson, 1997b]. This will facilitate study of the complex interaction between surface forcing and the ocean’s interior motions,
MCGILLICUDDY AND KOSNYREV: HINDCASTING THE BATS TIME SERIES
16,655
References
Figure 13. Objectively analyzed versus observed SLA along altimeter ground tracks. The RMS difference is indicated in the upper left corner, and the statistics of a least squares fit between these two quantities are shown on the lower right (r is the correlation coefficient, a is the y intercept, and b is the slope).
which together create the tremendous variability observed in the upper ocean. Nevertheless, success of the present model in hindcasting dynamic height anomaly at BATS suggests it is ready to be used for a retrospective analysis of eddy-driven processes in the time series. A wide range of in situ biogeochemical measurements is available [Michaels, 1995; Michaels and Knap, 1996], in addition to high-resolution moored time series [Dickey et al., 1999] and satellite sea surface temperature and ocean color data (http://www.bbsr.edu/satellite/). Synthesis of all these various data types in the context of numerical models such as that described here represents an important challenge for biogeochemical research [Doney, 1999]. The overall modeling approach used herein is generic and portable. In principle, this system can be implemented anywhere in the world ocean where the model physics are valid (the midlatitude open ocean) and the vertical structure of thermocline fluctuations is dominated by a single mode of variability (which is the case in the midlatitudes [Wunsch, 1997]). Thus it is our hope that this system will prove to be useful in providing a four-dimensional context in which to interpret time series observations in other locations in addition to BATS. Acknowledgments. We gratefully acknowledge the support of JPL, NASA, and NSF. Collaboration with David Siegel contributed a great deal to this effort. We are very thankful for Rod Johnson’s help with the BATS data; the exceptional efforts of the BATS technicians are greatly appreciated. Special thanks to Olga Kosnyreva for her help in data processing and visualization of model output. The comments and suggestions of two anonymous reviewers are greatly appreciated. Satellite SLA products used in this study were supplied by the CLS Space Oceanography Division, Toulouse, France; ERS products were generated as part of the proposal “Joint analysis of ERS-1, ERS-2 and TOPEX/Poseidon altimeter data for oceanic circulation studies” selected in response to the Announcement of Opportunity for ERS-1/2 by the European Space Agency (Proposal code: A02.F105). This is WHOI contribution 10266 and U.S. JGOFS program contribution 567.
Archiving, Validation, and Interpretation of Satellite Oceanographic data, AVISO user handbook for sea level anomaly altimeter products, 2nd ed., Tech. Rep. AVI-NT-011-312-CN, Cent. Natl. d’Etudes Spatiales, Toulouse, France, 1997. Bennett, A., Inverse Methods in Physical Oceanography, Cambridge Univ. Press, New York, 1992. Blayo, E., J. Verron, and J. Molines, Assimilation of TOPEX/Poseidon altimeter data into a circulation model of the North Atlantic, J. Geophys. Res., 99, 24,691–24,705, 1994. Blayo, E., T. Mailly, B. Barnier, P. Brasseur, C. Le Provost, J. Molines, and J. Verron, Complementarity of ERS-1 and TOPEX/Poseidon altimeter data in estimating the ocean circulation: Assimilation into a model of the North Atlantic, J. Geophys. Res., 102, 18,573–18,534, 1997. Brasseur, P., J. Ballabrera, and J. Verron, Assimilation of altimetric data in the midlatitude oceans using the SEEK filter with an eddyresolving, primitive equation model, J. Mar. Syst., 22, 269 –294, 1999. Bretherton, F., and M. Karweit, Mid-ocean mesoscale modeling, in Numerical Models of Ocean Circulation, pp. 237–249, Ocean Affairs Board, Natl. Res. Counc., Natl. Acad. of Sci., Washington, D.C., 1975. Capotondi, A., W. Holland, and P. Malanotte-Rizzoli, Assimilation of altimeter data into a quasigeostrophic model of the Gulf Stream system, part II, Assimilation results, J. Phys. Oceanogr., 25, 1153– 1173, 1995a. Capotondi, A., P. Malanotte-Rizzoli, and W. Holland, Assimilation of altimeter data into a quasigeostrophic model of the Gulf Stream system, part I, Dynamical considerations, J. Phys. Oceanogr., 25, 1130 –1152, 1995b. Carter, E., and A. Robinson, Analysis models for the estimation of oceanic fields, J. Atmos. Oceanic Technol., 4, 49 –74, 1987. Carton, J., How predictable are the geostrophic currents in the recirculation zone of the North Atlantic?, J. Phys. Oceanogr., 17, 751–762, 1987. Charney, J., and G. Flierl, Ocean analogues of large-scale atmospheric motions, in Evolution of Physical Oceanography, edited by B. Warren and C. Wunsch, chap. 5, pp. 140 –183, MIT Press, Cambridge, Mass., 1981. Chen, D., M. Cane, and S. Zebiak, The impact of sea level data assimilation on the Lamont predition of the 1997/98 El Nin ˜o, Geophys. Res. Lett., 25, 2837–2840, 1998. DeMey, P., and A. Robinson, Assimilation of altimeter eddy fields in a limited-area quasigeostrophic model, J. Phys. Oceanogr., 17, 2280 – 2293, 1987. Dickey, T., et al., Initial results from the Bermuda Testbed Mooring program, Deep Sea Res., Part I, 45, 771–794, 1998. Dombrowsky, E., and P. DeMey, Continuous assimilation in an open domain of the northeast Atlantic, 1, Methodology and application to Athen A-88, J. Geophys. Res., 97, 9719 –9731, 1992. Doney, S., A synoptic atmospheric surface forcing data set and physical upper ocean model for the U.S. JGOFS Bermuda Atlantic Time Series (BATS) site, J. Geophys. Res., 101, 25,615–25,634, 1996. Doney, S., Major challenges confronting marine biogeochemical modeling, Global Biogeochem. Cycles, 13, 705–714, 1999. Dougles, B., and R. Cheney, Geosat: Beginning a new era in oceanography, J. Geophys. Res., 95, 2833–2836, 1990. Fu, L., E. Christensen, C. Yamarone, M. Lefebvre, Y. Menard, M. Dorrer, and P. Escudier, TOPEX/Poseidon mission overview, J. Geophys. Res., 99, 24,369 –24,381, 1994. Fukumori, I., and P. Malanotte-Rizzoli, An approximate Kalman filter for ocean data assimilation: An example with an idealized Gulf Stream model, J. Geophys. Res., 100, 6777– 6793, 1995. Fukumori, I., R. Raghunath, L. Fu, and Y. Chao, Assimilation of TOPEX/Poseidon altimeter data into a global ocean circulation model: How good are the results?, J. Geophys. Res., 104, 25,647– 25,665, 1999. Haidvogel, D. B., Periodic and regional models, in Eddies in Marine Science, edited by A. R. Robinson, pp. 404 – 437, Springer-Verlag, New York, 1983. Harrison, D., and R. Heinmiller, Upper ocean variability in the Sargasso Sea July 1977–July 1978: The POLYMODE XBT program, J. Phys. Oceanogr., 13, 859 – 872, 1983. Holland, W., and P. Malanotte-Rizzoli, Assimilation of altimeter data into an ocean circulation model: Space versus time resolution studies, J. Phys. Oceanogr., 19, 1507–1534, 1989.
16,656
MCGILLICUDDY AND KOSNYREV: HINDCASTING THE BATS TIME SERIES
Jenkins, W., The use of anthropogenic tritium and helium-3 to study subtropical gyre ventilation and circulation, Philos. Trans. R. Soc., 325, 43– 61, 1988. Le Traon, P., and F. Ogor, ERS-1/2 orbit improvement using TOPEX/ Poseidon: The 2 cm challenge, J. Geophys. Res., 103, 8045– 8057, 1998. Le Traon, P., P. Gaspar, F. Bouyssel, and H. Makhmara, Using TOPEX/Poseidon data to enhance ERS-1 data, J. Atmos. Oceanic Technol., 12, 161–170, 1995. Malanotte-Rizzoli, P., Modern Approaches to Data Assimilation in Ocean Modeling, Elsevier Oceanogr. Ser., Amsterdam, 61, 455 pp., 1996. McGillicuddy, D., and A. Robinson, Eddy induced nutrient supply and new production in the Sargasso Sea, Deep Sea Res., Part I, 44, 1427–1449, 1997a. McGillicuddy, D., and A. Robinson, Interaction between the oceanic mesoscale and the surface mixed layer, Dyn. Atmos. Oceans, 27, 549 –574, 1997b. McGillicuddy, D., A. Robinson, D. Siegel, H. Jannasch, R. Johnson, T. Dickey, J. McNeil, A. Michaels, and A. Knap, Influence of mesoscale eddies on new production in the Sargasso Sea, Nature, 394, 263–265, 1998. McGillicuddy, D., R. Johnson, D. Siegel, A. Micheals, N. Bates, and A. Knap, Mesoscale variations of biogeochemical properties in the Sargasso Sea, J. Geophys. Res., 104, 13,381–13,394, 1999. McGillicuddy, D., V. Kosnyrev, J. Ryan, and J. Yoder, Covariation of mesoscale ocean color and sea surface temperature patterns in the Sargasso Sea, Deep Sea Res., Part II, 48, 1823–1836, 2001. McNeil, J., H. Jannasch, T. Dickey, D. McGillicuddy, M. Brzezinski, and C. Sakamoto, New chemical, bio-optical, and physical observations of upper ocean response to the passage of a mesoscale eddy off Bermuda, J. Geophys. Res., 104, 15,537–15,548, 1999. McWilliams, J., MODE mean currents and eddy surface intensification, MODE Hotline News, 57, 1– 6, 1974. McWilliams, J., Maps from the Mid Ocean Dynamics Experiment, part II, Potential vorticity and its conservation, J. Phys. Oceanogr., 6, 828 – 846, 1976. McWilliams, J., and G. Flierl, Optimal quasigeostrophic wave analysis of MODE array data, Deep Sea Res. Oceanogr. Abstr., 23, 285–300, 1976. Michaels, A., Ocean time series research near Bermuda: The Hydrostation S time series and the Bermuda Atlantic Time-series Study program, in Ecological Time Series, edited by T. Powell and J. Steele, pp. 181–208, Chapman and Hall, New York, 1995. Michaels, A., and A. Knap, An overview of the U.S. JGOFS Bermuda Atlantic Time-series study and the Hydrostation S program, Deep Sea Res., Part II, 43, 157–198, 1996. Miller, R., and A. Robinson, Dynamical forecast experiments with a baroclinic quasi-geostrophic open ocean model, in Predictability of Fluid Motions, edited by G. Holloway and B. West, pp. 457– 472, Am. Inst. of Phys., New York, 1984. Mitchum, G., On using satellite altimetric heights to provide a spatial context for the Hawaii Ocean Time-series measurements, Deep Sea Res., Part II, 43, 257–280, 1996. Moore, A., Data assimilation in a quasigeostrophic open-ocean model of the Gulf Stream region using the adjoint method, J. Phys. Oceanogr., 21, 398 – 427, 1991. Morrow, R., and P. DeMey, Adjoint assimilation of altimetric, surface
drifter, and hydrographic data in a quasi-geostrophic model of the Azores Current, J. Geophys. Res., 100, 25,007–25,025, 1995. Pinardi, N., and A. Robinson, Dynamics of deep thermocline jets in the POLYMODE region, J. Phys. Oceanogr., 17, 1163–1188, 1987. Richman, J., C. Wunsch, and N. Hogg, Space and time scales of mesoscale motion in the Western North Atlantic, Rev. Geophys., 15, 385– 420, 1977. Robinson, A., and D. Haidvogel, Dynamical forecast experiments with a barotropic ocean model, J. Phys. Oceanogr., 10, 1909 –1928, 1980. Robinson, A., and W. Leslie, Estimation and prediction of oceanic eddy fields, Progr. Oceanogr., 14, 485–510, 1985. Robinson, A., and L. Walstad, The Harvard open ocean model: Calibration and application to dynamical process, forecasting, and data assimilation studies, Appl. Numer. Math., 3, 89 –131, 1987. Schro ¨ter, J., U. Seiler, and M. Wenzel, Variational assimilation of Geosat data into an eddy-resolving model of the Gulf Stream extension area, J. Phys. Oceanogr., 23, 925–953, 1993. Siegel, D., D. McGillicuddy, and E. Fields, Mesoscale eddies, satellite altimetry and new production in the Sargasso Sea, J. Geophys. Res., 104, 13,359 –13,379, 1999. Spall, M., Regional primitive equation modeling and analysis of the POLYMODE data set, Dyn. Atmos. Oceans, 14, 125–174, 1989. Stammer, D., Geosat data assimilation with application to the eastern North Atlantic, J. Phys. Oceanogr., 27, 40 – 61, 1997. Stanley, H., The GEOS-3 project, J. Geophys. Res., 84, 3779 –3783, 1979. Tapley, B., G. Born, and M. Parke, The Seasat altimeter data and its accuracy assessment, J. Geophys. Res., 87, 3179 –3188, 1982. Tapley, B., et al., Precise orbit determination for TOPEX/Poseidon, J. Geophys. Res., 99, 24,383–24,404, 1994. The MODE Group, The Mid-Ocean Dynamics Experiment, Deep Sea Res., 25, 859 –910, 1978. Thiebaux, H., and M. Pedder, Spatial Objective Analysis, Academic, San Diego, Calif., 1987. Verron, J., L. Gourdeau, D. Pham, R. Murtugudde, and A. Busalacchi, An extended kalman filter to assimilate satellite altimeter data into a non-linear model of the tropical Pacific: Method and validation, J. Geophys. Res., 104, 5441–5458, 1999. Vogeler, A., and J. Schro ¨ter, Fitting a regional ocean model with adjustable open boundaries to TOPEX/Poseidon data, J. Geophys. Res., 104, 20,789 –20,799, 1999. Walstad, L., and A. Robinson, Hindcasting and forecasting of the POLYMODE data set with the Harvard open ocean model, J. Phys. Oceanogr., 20, 1682–1702, 1990. Walstad, L., and A. Robinson, A coupled surface boundary layerquasigeostrophic model, Dyn. Atmos. Oceans, 18, 151–207, 1993. Wunsch, C., The Ocean Circulation Inverse Problem, Cambridge Univ. Press, New York, 1996. Wunsch, C., The vertical partition of horizontal kinetic energy, J. Phys. Oceanogr., 27, 1770 –1794, 1997. V. K. Kosnyrev and D. J. McGillicuddy Jr., Department of Applied Ocean Physics, Woods Hole Oceanographic Institution, Woods Hole, MA 02543. (
[email protected]) (Received April 10, 2000; revised December 15, 2000; accepted December 28, 2000.)