Indian Journal of Geo-Marine Sciences Vol. 44(9), September 2015, pp. 1310-1322
Dynamics and quantification of dissolved metals in a highly contaminated river-estuarine system S.C. Asa1, S.N. Bramha2, A.K. Mohanty2, T.K. Bastia1, D. Behera1 & P. Rath1
*
1*
2
School of Applied Sciences, Department of Chemistry, KIIT University, Bhubaneswar, Odisha. Radiological Safety and Environmental Group, Indira Gandhi Centre for Atomic Research (IGCAR), Department of Atomic Energy, Govt. of India, Kalpakkam-603 102, Tamil Nadu, India. *[E-Mail:
[email protected];
[email protected]] Received 04 July 2014; revised 11 September 2014 Dynamics of heavy metals such as Fe, Mn, Co, Ni, Cu, Zn, Cr, Pb and Cd in surface water of Brahmani river-estuarine system were studied taking 25 samples from different sampling locations along the complete stretch. Irrespective of season, Fe was most abundant in both river (avg. 260.15 µg / l ) and estuarine (avg. 119.9µg / l) samples, whereas Cd (avg. 1.59 µg / l) and Co (avg.1.55µg / l) were the lowest in the river and estuarine samples respectively. The average concentrations of all the dissolved metals were much higher than the world river average. The average concentrations Cr and Cd for the river were above the criteria of maximum concentration (CMC) as prescribed by US Environmental Protection Agency. Results of factor analyses revealed that anthropogenic contributions were the source for the increase in dissolved metal concentrations. Canonical discriminate function indicated that it was moderately successful in discriminating the groups as predicted. River Brahmani with an annual discharge of 18.58 x 10 m carries 6.907 x 10 tons of total heavy metals into Bay of Bengal and the calculated rate of erosion in the basin is 176.582 kg km year . [Keywords: Dissolved metals, Enrichment ratio, Metal Pollution Index, Discriminate analysis, Factor analysis]
Introduction Rivers play a major role in assimilating heavy metals from both natural sources through erosion, weathering of source rock and anthropogenic sources such as urban sewage carrying domestic wastes, effluents from different industries, washings from agricultural fields containing fertilizer and pesticides1 and from mining areas through various ways such as mine discharge, run-off, dissolution of rocks and soils, wet and dry fallout of atmospheric particulate matter etc2-4. Metals such as Cu, Zn etc are essentially required by different living species in water bodies. However nutritional requirement of these metals substantially differ from species to species and that is too in a narrow range. Exposure to elevated concentration of metals may result in serious consequences such as death of certain species. High levels of heavy metals also cause metal accumulation by aquatic organisms affecting the species higher up in the food chain. In addition some metals like Cr, Cd, Pb etc are highly toxic even at very low level5. In river water metals exist in two forms i.e. suspended particulate and dissolved forms. During transportation they undergo numerous
changes such as dissolution, precipitation, sorption, complexation etc, which affect their bio-availability6. Though many works have already been reported pertaining to geochemistry, hydro geochemistry and water quality of Brahmani River712 , most of those studies focused on small stretches of the river or some specific areas and in addition concerned with physico-chemical parameter of river water and metal distribution in sediments. No attempt has been made so far regarding dissolved metal distribution along the complete stretch of the river including the estuary and near shore area. In the present study, concentrations of some selective heavy metals (Fe, Mn, Co, Ni, Cu, Zn, Cr, Pb and Cd) in surface water of Brahmani river-estuarine system were measured. A quantitative approach has been made by the use of enrichment ratio, metal pollution index (MPI) and through comparison with standards for surface water quality and levels for the same in other studies of India and World. Individual metal loads were also calculated. Multivariate statistics such as factor analysis was applied for meaningful data reduction and interpretation of results.
1311
ASA et al.: DYNAMICS AND QUANTIFICATION OF DISSOLVED METALS IN A HIGHLY CONTAMINATED RIVER-ESTUARINE SYSTEM
Discriminate analysis was performed for discrimination of sampling sites with respect to the measured parameters. Materials and Methods Brahmani River is the second largest river in Odisha having drainage basin of 39,035 km2 area with total length of 800 km and peak discharge of 22,640 m3 s-1. It mixes with River Baitarani to form Dhamara estuarine system before meeting the Bay of Bengal. Brahmani River receives effluents from most of the major industries of Odisha located in Rourkela, Angul, Talcher and Jajpur Industrial areas, washings from mines located in Angul-Talcher belt and Sukinda, sewage from a number of major townships along with agricultural runoff from its catchment area. As a result, the river water does not represent a healthy aquatic ecosystem. The detailed basin status with respect to source of generation of waste water, volume of waste water generated, water consumption by major industries, important pollutants is summarized in Table 1. The basin lies in an Indian shield that consists of Pre-Cambrian rocks such as granites, gneisses, quartzites, schists of Eastern Ghats, amphibolites, pegmatites, khondalites and charnockites and Gondwana rocks like shale, sandstone and coal11. This basin of Odisha is of high environmental importance due to the presence of mangrove forest ecosystem, Bhitarakanika National Park, a Wild Life Sanctuary which has been listed as a RAMSAR site in 2002, crocodile breeding centre and the Olive Ridley nesting beaches. This basin also has a considerable potential for development of inland fisheries in reservoirs, ponds, tanks and canals. In order to monitor the dissolved metal concentration, water samples from 25 stations were collected along the complete stretch of the river between Feb-May (dry season) and JulyOct (wet season) as shown in Figure 1. Out of these stations 17 are from fresh water zone while
Table 1 Anthropogenic scenario of the basin Industry
Product/s
Agricultural run-off -
Industrial & Urban townships, major urban centers and conglomerates Rourkela Steel Plant [RSP] RSP Fertilizer Corporation of India NALCO [Smelter] NALCO [CPP] ORICHEM Ltd
Talcher Thermal power Talcher Thermal Power Plant, NTPC, Kaniha MESCO Iron Steel Ltd. Bhusan Steel Ltd. Brahmani Steel ORIND Steel Ltd. Neelachal Steel Ltd. Jindal Steel & Power Mines: Coal, iron and chromite mines
-
Iron and Steel
Fertilizer [CAN] Fertilizer [Urea] Aluminium Electric power Na2Cr2O7, Basic Chromium Sulphate, Yellow sodium sulphate Electric power Electric power
Iron and Steel
Water Pollutants Consumption [m3/ day ] Fertilizers, pesticides, - nutrients, SS,TDS, heavy metals Oil, grease, heavy metals, nutrients, SS, TDS 2,65,580 Heavy metals, SS, oil, grease 28,807 Nutrient, Heavy metal 45,883 Heavy metals, SS, oil, grease 5,066
Waste water generated [m3 / day ] 405.6 M m3/year
90,000
1,20,000
7,920 16,608
4,900
1,35,000
90,000
170
10
13,227
6,483
1,37,099
52,080
Heavy metals, SS, 84,840 oil, grease
40,078
Iron and Steel
2,29,200
1,08,274
Iron and Steel
84,840
40,078
Iron and Steel
16,800
7,936
Iron and Steel
1,75,200
82,764
-
-
-
-
Iron, Steel and Electric Power
eight are from saline water zone which includes estuary and coastal sea up to a distance of 3 km from shore. Stations were selected on the basis of location of major industries, municipaltownship discharge points and also on accessibility to the sampling sites. In each station sampling was carried out for five times during the sampling period and average value was taken for evaluation. Surface water samples were collected from the mid stream of the river and at a depth of 20-30 cm from water surface. To minimize the contamination from boat
1312
INDIAN J. MAR. SCI., VOL. 44, NO. 9 SEPTEMBER 2015
Figure 1 Map showing sampling locations wherever used and also from the surface, the samples were collected by travelling in upstream direction. Acid cleaned, dried polythene containers were used for this purpose. After collection pH was measured immediately by a portable battery operated pH meter (Elico- Model No. DI-707). DO was measured by Winkler’s titration method. One liter of river water was filtered through 0.45 mm Millipore cellulose nitrate filter paper using a vacuum pump. The filtered water samples were acidified by concentrated HNO3 to bring down the pH around 2.0, so as to inhibit adsorption of metal ions on to container surface and to prevent metal precipitation. The concentrations of Fe, Mn, Co, Ni, Cu, Zn, Cr, Pb and Cd metal ions in the pre-concentrated solutions were determined with the help of Atomic Absorption Spectrophotometer (AAS) model Perkin Elmer 1025. Pre-concentration was made by nonboiling evaporation13 except for samples taken from saline water zone where chelating solventextraction technique was adopted. The concentrations of metal ions were measured after ammonium pyrolidine dithiocarbamate (APDC)-methyl isobutyl ketone (MIBK) extraction14. Because of the instability of the complexes with metals like Mn, the metals were again back extracted to aqueous medium with HNO315 before analysis. Milli-Q water was used throughout the analysis. The analytical data quality was ensured through careful standardization, procedural blank measurements, spiked and duplicate samples. The precession
and accuracy of the methods were systematically and routinely checked by analyzing standard solutions procured from Merck after desired dilutions. Multivariate statistical analysis was performed through factor and Discriminate analysis techniques16,17. Factor analysis was performed on correlation matrix of rearranged data of the dissolved metal concentrations, pH and DO. The variance and factor loadings of the variables with eigen values were computed. Stepwise Discriminant analysis using Wilks’ method was carried to investigate differences between the groups on the basis of the variables of the cases, indicating which variables contribute most to the group separation and in addition to test the theory whether cases are classified as predicted. Data were processed using routines taken from Statistical Program for Social Sciences (SPSSVersion 20.0) statistical software. Results and Discussion Minimum, maximum, mean and standard deviation for concentrations of the analyzed heavy metal ions along with pH and DO in water samples of Brahmani river-estuarine system are reported in Table 2, while the detail spatial variation is given in Figure 2. The dissolved metal concentrations in Brahmani river estuarine system, other rivers in India/World, World River averages along with drinking water standards and maximum permissible limits prescribed by different agencies are depicted in Table 3.
1313
-
/ / / / /
µ µ µ µ
µ µ µ µ µ
pH
DO Fe Mn Co Ni
Cu Zn Cr Pb Cd
1.40 10.30 9.90 1.28 0.12
7.10 5.84 110.23 5.87 2.18 4.24
Min.
41.00 48.08 165.78 9.87 4.40
8.90 9.44 545.53 27.36 13.56 31.92
Max.
12.25 22.06 43.65 4.75 1.69
7.98 7.80 244.35 11.64 6.23 12.80
Mean
Fresh
11.90 8.64 40.48 2.28 0.95
0.55 1.08 116.23 5.64 3.36 6.79
Std. Dev.
2.75 10.87 5.06 1.15 1.85
7.94 6.08 32.80 1.35 0.73 1.34
Min.
22.70 20.70 35.70 8.80 3.52
8.37 8.14 200.32 9.40 3.50 8.50
Max.
10.56 16.26 15.60 3.80 2.81
8.18 7.40 117.08 5.61 1.63 3.29
Mean
Saline
8.42 3.63 11.01 2.82 0.56
0.14 0.61 70.05 3.53 1.04 2.50
Std. Dev.
1.15 9.40 7.80 1.12 0.10
7.50 7.20 120.50 8.90 2.00 4.10
Min.
38.20 45.65 135.40 8.50 3.98
9.00 10.30 560.32 30.32 10.20 28.45
Max.
11.01 20.08 38.39 4.21 1.48
8.40 8.71 275.94 16.45 5.34 11.30
Mean
Fresh
11.09 8.72 33.51 1.92 0.89
0.44 0.78 119.40 6.45 2.62 6.14
Std. Dev.
2.38 10.20 4.80 0.92 1.63
8.45 7.87 30.70 1.97 0.60 0.96
Min.
Wet Season
18.38 19.33 31.43 7.72 3.87
8.91 8.80 205.78 13.30 3.24 6.35
Max.
9.24 15.58 14.63 3.36 2.90
8.67 8.33 122.72 7.49 1.47 2.79
Mean
Saline
7.28 3.42 9.58 2.47 0.70
0.15 0.38 69.17 4.66 0.99 1.95
Std. Dev.
500 50 -
1,000
300
-
WHO[29]
USEPA, 2009 [30]
CMC, USEPA, 2006 [31]
6.00 300
55.00 1,000
/
World River Avg. BIS, IS: 10500 [28]
Mn 7.72 2.60 3.95 129.00 19.88 11.38 30.72 27.9 14.05
/
48998.00 9.90 7.50 51000.00 226.00 189.38 66.25 30.64 835.00 260.15
Fe
Ganga river Cauvery Godavari Kali River Hindon River Mahanadi River Subarnarekha River Han River, Chaina Tigris River, Iraq Brahmani River
Rivers Co
-
-
-
0.20 -
3.62 1.13 2.24 5.79
0.70
/ Ni
470
-
20
0.30 -
58 38.30 0.14 0.80 24.00 10.19 15.75 1.71 5.11 12.05
/ Cu
13
1,300
2,000
1.00 1,500
36.00 6.00 0.92 1.34 6.60 8.39 15.88 13.35 2.11 11.63
/ Zn
120
5,000
5,000
10.00 15,000
115.00 81.60 0.66 10.03 58.00 29.28 23.00 2.78 21.07
/
Cr
16
100
50
0.50 50
48.80 15.00 3.67 1.13 8.14 3.67 41.02
/
Pb
65
15
10
0.20 50
25.00 1.36 5.60 0.70 37.00 8.04 19.13 9.26 0.48 4.48
/
Cd
2
5
3
0.02* 10
0.14 0.43 0.07 0.13 0.91 2.31 0.02 1.59
/
[27]
[18] [19] [20] [21] [22] [23] [24] [25] [26] This Study
References
Table 3 The dissolved metal concentrations in Brahmani river estuarine system along with other rivers in India/World and the World River average.*Martin and Whitfield, 1983[44].
/ / / / /
Units
Parameter
Dry Season
Table 2 Descriptive statistics of dissolved metal concentrations along with pH and DO in Brahmani river estuarine system during Dry and Wet season.
ASA et al.: DYNAMICS AND QUANTIFICATION OF DISSOLVED METALS IN A HIGHLY CONTAMINATED RIVER-ESTUARINE SYSTEM
Drinking water standard
1314
INDIAN J. MAR. SCI., VOL. 44, NO. 9 SEPTEMBER 2015
Among the heavy metals the most abundant one was Fe in both fresh and saline water zone, whereas, Cd and Co appeared as least abundant at fresh and saline water zone respectively, irrespective of seasons. Mean concentrations of different metals in fresh water and saline water zone followed the order Fe> Cr> Zn> Mn> Ni> Cu> Co> Pb> Cd and Fe> Zn> Cr> Cu> Mn> Pb> Ni> Cd> Co respectively. As expected, the average concentration of metals in estuarine saline water zone was found to be less than that of the river fresh water zone, which could be attributed to different geochemical processes that help in the removal of dissolved metals from water column. Primary processes include flocculation of dissolved organic matter in complexation with dissolved metals at low salinity zone, adsorption onto suspended matter which dominates the processes with increasing pH gradient and adsorption onto freshly precipitated Fe and Mn oxy-hydroxide coatings on mineral grains. It has been observed that organic precipitation and adsorption of heavy metals to fine particles is prominent in estuarine zone, while adsorption onto freshly precipitated Fe and Mn oxy-hydroxide coatings on mineral grains seem to dominate the proceedings in coastal zone7. The role of dilution also can’t be ignored. With respect to temporal variation the average concentration of all metals except Fe and Mn decreased in wet season. This might be due to dilution effect in high flow conditions as it is a monsoon fed river. The detail spatial and seasonal variation of different metals has been discussed as follows. The concentration of iron in Brahmani river water lies within 110.23-545.53 µg/l during summer and 120.50- 560.32 µg/lin rainy seasons with an average of 244.35 and 275.94 µg/l respectively. In saline water zone the concentration ranged from 32.80- 200.32 µg/l with an average 117.08 µg/l during summer and 30.70-205.78 µg/l with an average of 122.72 µg/l during rainy season. In neutral to slightly basic waters of the Brahmani River dissolved Mn mostly remain as Mn (II) which readily react with carbonates and bicarbonates32. Manganese (II) carbonates is expected to play an important role in distribution of dissolved Mn in interstitial waters of river33. Its concentration varies within 5.87-27.36 µg/l with an average of 11.64 µg/l in river and 1.35-9.40 µg/l with an average of 5.61 µg/l in saline water during summer. During rainy season Mn concentration varied from 8.90-
30.32 µg/l in river and 1.97-13.30 µg/l in saline water zone. Higher average of both the metals in rainy season may be attributed to lower pH of rain water as compared to river water average, which might be responsible for weathering of these metals from surface. Lower average concentration observed in saline water than that in fresh water zone could be attributed to precipitation of these metals to their hydroxides under alkaline pH condition of estuary34. The highest value of Fe is reported at BR_7 i.e. D/S of Angul-Talcher industrial complex followed by BR_2 i.e. D/S of Rourkela, irrespective of seasons. This could be attributed to the effluents of metallurgical industries and thermal power plants. For manganese the highest value is reported at BR_2. The complete spatial variation in both seasons is shown in Figure 2. The average concentrations of both the metals are much higher than World River Average 27, however remains well within the limits of drinking water standard prescribed by BIS 199128 and WHO 200429. Co (II) is observed to be the dominant species of cobalt in fresh water. Cobalt concentration in uncontaminated surface water is generally very low, usually < 1 μg/l. The concentration of Co was found to be 2.18-13.56 µg/l with an average of 6.23 µg/l and standard deviation 3.36 in the fresh water area and 0.733.50 µg/l with an average of 1.63 µg/l in saline water zone during dry season. Similarly during wet season it varied in the range 2.0-10.20 µg/l with an average of 5.34 µg/l in fresh water area and 0.60-3.24 µg/l with an average of 1.47 µg/l in the estuary. These values are quite higher than the world river average value (0.2 µg/l). Irrespective of seasons, the highest concentration was reported at BR_2 i.e. D/S of Rourkela which may be attributed to municipal sewage as well as industrial wastes from Rourkela industrial complex that mix-up with main stream of river before this sampling site. The complete spatial variation is shown in Figure 2. Ni (II) is the most stable oxidation state of Ni which is stable over a wide range of pH. As most of the nickel salts are readily soluble, they can easily contribute to water pollution through municipal and industrial waste discharge35. The Ni concentration varied from 4.24-31.92 µg/l with an average of 12.80 µg/l in river and 1.348.50 µg/l with average of 3.29 µg/l in estuary
SR
0
DC…
DC…
DE…
DE…
BR_15
BR_13
BR_11
BR_09
BR_07
BR_05
BR_03
BR_01
Cr (mg/l) 40
30
20 Pb (mg/l)
SR
60
50
10
0 BR_13
BR_13
DC_04
DC_02
DE_04
DE_02
DC_04
DC_02
DE_04
DE_02
BR_15
BR_11
BR_15
BR_09
BR_11
14 12 10 8 6 4 2 0
BR_09
0 BR_07
10
BR_07
20
BR_05
40
BR_05
50 DC_04
DC_02 DC_04
DE_04
BR_11
BR_09
BR_07
BR_05
BR_03
BR_01
DC_02
0
DE_02
10
DE_04
20
DE_02
30
BR_15
40
BR_13
50
BR_15
60
BR_13
BR_11
BR_09
BR_07
BR_05
BR_03
BR_01
0
BR_03
100
BR_03
200
SR
300
Co (mg/l)
Rainy
SR
40 35 30 25 20 15 10 5 0 Zn (mg/l)
DC_04
DC_02
DE_04
DE_02
BR_15
BR_13
BR_11
BR_09
BR_07
BR_05
BR_03
500
BR_01
DC_04
DC_02
DE_04
DE_02
BR_15
BR_13
BR_11
BR_09
BR_07
BR_05
BR_03
SR BR_01
Fe (mg/l)
Summer
BR_01
30
Cd (mg/l)
SR BR_01
Mn (mg/l) 600
SR
DC_04
DC_02
DE_04
DE_02
BR_15
BR_13
BR_11
BR_09
BR_07
BR_05
BR_03
BR_01
Ni (mg/l)
during dry season. Similarly, its concentration
SR
DC_04
DC_02
DE_04
DE_02
BR_15
BR_13
BR_11
BR_09
BR_07
BR_05
BR_03
BR_01
SR
Cu (mg/l
ASA et al.: DYNAMICS AND QUANTIFICATION OF DISSOLVED METALS IN A HIGHLY CONTAMINATED RIVER-ESTUARINE SYSTEM
ranged from 4.10-28.45 µg/l with an average of 25
400 20
15
10 5
0
8 7 6 5 4 3 2 1 0
200
150
100
50
Figure 2 Spatial variations of dissolved metals along Brahmani river-estuarine system.
1315
1316
INDIAN J. MAR. SCI., VOL. 44, NO. 9 SEPTEMBER 2015
11.30 µg/l in river and 0.96-6.35 µg/l with average of 2.79 µg/l in estuary during wet season. Irrespective of seasons, the highest value was observed at BR_2, the D/S of Rourkela. High values are also reported at D/S of industrial conglomerates and major towns which may be attributed to the urban waste water, smelting and burning of fossil fuel particularly coal in thermal power plants. The mean concentrations of Ni in Brahmani River as well as in estuary region were observed to be much higher than world river average (0.3 µg/l) and other Indian rivers. However it is within the criteria of maximum concentration (CMC) as prescribed by USEPA, 200631 limit (470 µg/l) and WHO limit (20 µg/l ). However the concentration at some stations like BR_2 and BR_7 is higher than WHO standard. Copper occurs in water in different forms like Cu-humic acid complex36. Concentration of Cu in river Brahmani varied within 1.40-41.00 µg/l in dry and 1.15-38.20 µg/l in wet seasons. In saline water zone it varied within 2.75-22.70 µg/l and 2.38-18.38 µg/l during dry and wet seasons respectively. The concentration of Cu was much higher than world river average and other Indian rivers. In many stations the values were also above the drinking water CMC31 but within the limit of BIS28 and WHO29. Irrespective of season the highest value was reported at BR_11 i.e. D/S of Jajpur industrial conglomerate. In general the high values were recorded in coastal plain stations. High level of Cu in the study area could be the contribution of Municipal effluents and leachates from solid waste of Rourkela, Angul-Talcher, Sukinda industrial and mining areas. In addition high dissolved Cu in coastal plain sediments may be attributed to extensive use of fertilizers and fungicides in agriculture. The same is well reflected in the spatial variations (Figure 2). Though the mean concentration in estuary is less than the river, still some mobilization is marked during initial mixing of fresh and saline waters. Several workers such as Vazquez et al.37, Muller et al.38 have also reported the same observations. As per Muller et al.38 it may be due to formation of organo-copper complexes in saline water. The Zn concentration in Brahmani River was 10.30-48.08 µg/l and 9.40-45.65 µg/l during dry and wet seasons respectively. Irrespective of seasons, the Zn concentration at all sampling sites were above world river average of 10 µg/l27. Zn content in Brahmani
river estuarine system is well within the prescribed limits of CMC31, drinking water standard by BIS28 and WHO29. Irrespective of seasons, the highest value is reported at BR_2 followed by BR_7. This may attributed to the processing ferrous ores, municipal sewage and seepage from municipal dumping in up-stream areas of these locations. Due to basic conditions in Brahmani river and estuary (average pH is ~ 8 or more), Zn remained effectively immobilized in all redox conditions39. This fact is well reflected in the spatial variation. Chromium concentration in natural water is usually very small, however high concentration can result from industrial and mining process40. Enrichment of Cr particularly at stations BR_9 and BR_10, the D/S stations of Sukinda, which is one of the largest chromite reservoirs of the country, was observed in the present study. The mine drainage of the area is discharging through Damsala Nala which is a tributary of Brahmani River near Bhuban. In Brahmani River, concentration of Cr varied from 9.90-165.78 µg/l with an average of 43.65 µg/l during summer and 7.80-135.40 µg/l with an average of 38.39 µg/l during rainy season. The mean concentrations were much higher than world river average (0.5 µg/l27, and CMC limits 16 µg/l31). The concentration of dissolved Cr decreased towards sea, which could be due to the increase in distance from source, dilution of fresh water with sea water41 in addition to the other geo-chemical processes as mentioned above. The concentration of Pb varied within 1.289.87 µg/l and 1.15-8.80 µg/l in river and estuary during dry season while 1.12-8.50 µg/l and 0.92-7.72 µg/l in river and estuary during rainy season. The highest value of Pb (9.87 µg/ l) was reported at Kamalanga the D/S of AngulTalcher industrial and coal mining area. This might be through atmospheric deposition of aerosols containing Pb from coal mining sites. Lead is also contributed through discharge of solid wastes such as Pb batteries, PVC plastics, paints, alloys etc by the urban setups in and around the study area. In dry season the second highest concentration is noticed at D/S of Sukinda which is again an extensive mining site. In addition thousands of trucks are utilized here for transportation of ore which is the only conveyance. The Pb concentration in river Brahmani is within the limits of CMC31; drinking water IS: 10500, by BIS28 and WHO29.
ASA et al.: DYNAMICS AND QUANTIFICATION OF DISSOLVED METALS IN A HIGHLY CONTAMINATED RIVER-ESTUARINE SYSTEM
Metal enrichment ratio Metal enrichment as a result of contamination can be estimated in a number of methods. Different authors have compared their data pertaining to a particular environment with that of similar environment in other places of the country/world. In the present study, a method called enrichment ratio (ER) analysis has been used to quantify the enrichment of heavy metals of the study area. Here comparison has been made with respect to global background values. World river average of dissolved metals is used as global background concentration27. ER > 1 is termed as enrichment while ER < 1 represents depletion with respect to Global background. The ER for the dissolved metals (average concentration of both dry and wet season) in the study area has been presented in box-whisker plot (Figure 3). The small box inside corresponds to the mean value while the line in the box corresponds to the median i.e. 50% of
the sampling sites are having values corresponding to this value of ER for a specific metal. The ‘whiskers’ above and below the box show the locations of the minimum and maximum values of ER. Outliers are noticed for Ni and Cr in the upper side. The outlier in case of Ni is due to abnormally high ER at site BR_2, D/S of Rourkela sector while the same for Cr is due to abnormally high ER at site BR_9, BR_10 and BR_11 the D/S stations of Sukinda. Outliers are presented as asterisks and are greater than 1.5 times of interquartile distance from each quartile. ER values in different sampling sites ranges from 0.6 to 1.1 for Fe, 0.3- 4.8 for Mn, 3.3-59.4 for Co, 3.8-100.6 for Ni, 1.3-39.6 for Cu, 1.0-4.7 for Zn, 9.9-301.2 for Cr and 5.2-45.9 for Pb. The above result showed enrichment of all the metals in the study area, which is mainly due to the mining and industrial activities. 350 300 250 200 Range
However, it is above the world river average value of 0.20 µg/l27. Cd enters into the natural hydrological system through aerosol deposition, agricultural field washings as well as through dumping of untreated effluents by industries42. The dissolved Cd concentration in fresh and saline water zones was reported as 0.12-4.40 µg/l and 1.85-3.52 µg/l during dry and 0.10-3.98 µg/l and 1.633.87 µg/l during wet season. The temporal variation of Cd among sampling sites was insignificant. Relatively high values of dissolved Cd were observed at Rourkela D/S (BR_2) and Kamalanga, D/S of Angul-Talcher industrial zone (BR_7), irrespective of seasons, which could be attributed to the direct input from metallurgical, fertilizer industries and urban sewage of the industrial townships. The high value of Cd in some coastal stations may be due to the extensive use of phosphatic fertilizers in agriculture which are reported to contain Cd43. The observed values are well above the world river average of 0.02 µg/l44. The average concentration of Cd in saline water is more than CMC as prescribed by USEPA31 in both dry and wet seasons. Except BR_2 and some coastal stations the values are within the limit as prescribed by WHO29 for drinking water. Some mobilization in distribution of Cd is observed in estuarine region. It may be due to chloride and sulphate complexation in addition to ionic strength effects resulting in Cd desorption from sediments45.
1317
150 100 50 0 -50 Fe
Mn
Co
Ni
Cu
Zn
Cr
Pb
Cd
Figure 3 Box–whisker plots showing enrichment factors for dissolved metals in the study area Metal Pollution index Metal Pollution index (MPI) represents the composite influence of all metals on the river water quality46. The MPI represents the sum of the ratio between the concentration of analyzed metal and their corresponding maximum allowable concentrations (MAC). The drinking water standards of India28are used as MAC for the metals, with the exception of Co and Ni for which BIS28 does not provide a standard. Instead, the New York State Department of Environmental Conservation (NYSDEC) water quality standard for Co (5 µ / ) was used and for Ni, CMC as prescribed by USEPA31 was used. MPI = ∑ (
)
Where, C = Concentration of ‘ith’ metal. MAC = Maximum allowable concentrations.
INDIAN J. MAR. SCI., VOL. 44, NO. 9 SEPTEMBER 2015
1318
A six category ranking system is used to express the degree of anthropogenic influence of metals on the water quality and to classify water quality at different sampling stations47. A MPI of < 0.3 represents very pure (Class I), 0.3 - 1.0 poor (Class II), 1.0 - 2.0 slightly affected (Class III), 2.0 - 4.0 moderately affected (Class IV), 4.0 - 6.0 strongly affected (Class V) and a MPI of > 6.0 represents seriously affected (Class VI). The MPI values for different sampling stations are presented in Figure 4. The maximum MPI is ror bars. The values show denoted by vertical error that among river stations, the station from Sankh river remains in class I along with coastal
stations. The water from stations BR_2, Br_9 and BR_10 remains in class V i.e. strongly affected category. BR_2 is the D/S station of Rourkela urkela that receives effluents of Rourkela Steel Plant and other small scale industries in the Rourkela sector along with the urban sewage of the steel city while BR_9 and BR_10 are the downstream stations of Sukinda which is one of servoirs of the country. the largest chromite reservoirs These stations mainly receive the mine washings along with dry and wet fall out of atmospheric particulate matters. The other river stations along with the stations from estuary remain in
5.0 4.0 3.0 2.0
DC…
DC…
DE…
DC…
DE…
DE…
DE…
BR…
BR…
BR…
BR…
BR…
BR…
BR…
BR…
BR…
BR…
BR…
BR…
BR…
BR…
BR…
KR
0.0
BR…
1.0
SR
Metal Pollution Index
6.0
Locations Figure 4 Metal Pollution Index at different sampling sites slightly to moderately affected category as far as dissolved heavy metals are concerned. Factor analysis R-mode mode factor analysis was carried out to clarify relation among the dissolved metal, pH and dissolved oxygen DO for 25 locations. A varimax rotation of principal components or factors was used to clarify the picture for simpler and more meaningful representation represe of underlying factors as it lowers the contribution to factors of variables with minor significance and increase the more significant one. Three factors with eigen value greater than unity explaining 82.99 % of the variance or information contained in the original data set was retained.. The results of three factors with loadings greater than 0.40 for individual parameters, considering their significant influence towards the hydro-geochemical hydro processes, are presented in Table 4. During interpretation the factor loadings are classified
as ‘strong’, ‘moderate’ and ‘weak’ corresponding to absolute loading values of > Table 4 Factor analysis (All samples as a single group) Rotated Component Matrix Parameter F1 0.937 .937 0.983 .983 0.888 .888 0.948 .948
Fe Mn Co Ni Cu 0.917 .917 Zn 0.451 .451 Cr 0.604 .604 Pb Cd pH DO 5.023 Eigen Value 45.781 % Variance Cumulative Variance 45.781
Component F2
F3
0.780 0.627 0.681
0.441 -0.844
0.795 2.344 21.313 67.095
0.866 1.749 15.899 82.994
ASA et al.: DYNAMICS AND QUANTIFICATION OF DISSOLVED METALS IN A HIGHLY CONTAMINATED RIVER-ESTUARINE SYSTEM
0.70, 0.70–0.50 and 0.50–0.40, respectively48,49. Three factors have been isolated which together explains 82.99 % of the total variance. Varifactor 1 represented 45.78% of the total variance and was found to have strong positive loading of metals like Mn, Ni, Fe, Zn & Co and moderate positive loading of Pb. This indicates that Fe and Mn are effective scavengers of heavy metals in water column. The strong loading of metals mentioned reflects their common source of origin which may be the effluents of metallurgical industries and mining activities in the basin. Moderate loading of Pb Table 5 Summary of canonical discriminate functions Discriminate functions F1 F2 Eigen Function % of Variance Cumulative % Canonical correlation Wilks’ lambda Chi square Significance Variables Co Ni Pb Cd
5.057 97.9 97.9
0.110 2.1 100
0.914
0.315
0.149 86.727 8 0.000 Standard coefficients -0.763 -1.414 1.131 1.305
0.900 4.769 3 0.190 -0.726 0.207 1.219 -0.217
shows its independency within the group. The Varifactor 2 represents 21.31% of the total variance and is strongly loaded with Cu and pH. Moderate loading of Pb and Cr in this fraction indicates their common source of origin. This may be through wet and dry fallout of atmospheric particulate matter at mining areas particularly at Sukinda valley, which is considered as one of the major chromite deposits in the country, and coal mines in Talcher belt. The fuel burnt by thousands of trucks utilized here for transportation of ore could also be the source of these metals. Varifactor 3 which accounted for 15.90 % of the variation was found to have strong positive loading of DO and negative loading of Cd. The trend may be attributed to the fact that in oxic condition Cd remain primarily scavenged by non-detrital carbonate minerals which limits its solubility as Cd 50.
Discriminate analysis
1319
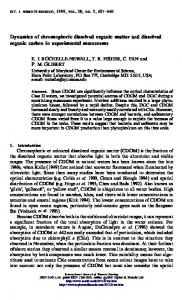
Stepwise discriminate analysis using Wilks’ method was carried out by entering sampling sites as grouping variables and the metal concentrations as independent variables. The module was executed by entering the most correlated variable in the beginning and then the second and so on until an additional variable brings no significant change. The summary of canonical discriminate functions is presented in Table 5. Here, first canonical discriminate function accounts for 97.9 % while second function accounts only for 2.1 % of the discriminating ability of the variables. The standardized canonical coefficients indicate that ‘Cd’ and ‘Pb’ largely contributed to the first discriminate function while ‘Pb’ to the second discriminating functions. A very high canonical correlation is observed for first discriminating function. A small Wilks’ lambda (0.149) for the first discriminating function indicates that it is moderately successful in discriminating the groups. The plot of first and second canonical discriminate functions demonstrates the distinctive groupings (Figure 5). The cross validated classification results reveal that 88.0% of cases were classified correctly into river, estuary and coastal groups. River group was classified with absolute accuracy of 100 %, then coast with 66.7% accuracy and estuary with the least accuracy of 60 %.
Figure 5 Plot of first and second canonical discriminant functions Metal load in the Basin The annual metal load and erosion rate in the Brahmani river basin was calculated using average metal content of the nine metals
INDIAN J. MAR. SCI., VOL. 44, NO. 9 SEPTEMBER 2015
1320
considered in this study, the annual water discharge and drainage area12,51. River Brahmani with an annual discharge of 18.58 x 10 carries 6.907 x 10 of total heavy metals into Bay of Bengal and the calculated rate of erosion in the basin is 176.582 . The Table 6 shows the contribution of individual metals in this respect.
and the calculated rate of erosion in the basin is . 176.582 Acknowledgement Authors are thankful to Late Unmesh Chandra Panda without whose contribution; it would not have been possible to do this work. References Nouri J, Mahvi AH, Jahed GR, Babei AA. Regional distribution pattern of ground water heavy metals resulting from agricultural activities. Environ. Geol. 2008; 55 (6): 1337-1343. 2 Singh AK, Mondal GC, Kumar S, Singh TB, Tiwary BK, Sinha A. Major ion chemistry, weathering processes and water quality assessment in upper catchment of Damodar River basin, India. Environ. Geo. 2008; 54 (4): 745-758. 3 Cravotta AC. Dissolved metals and associated constituents in abandoned coal-mine discharges, Pennsylvania, USA. Part 1: Constituent quantities and correlations. Appl. Geochem, 2008, 23 (2), 166-202. 4 Venugopal T, Giridharan L, Jayaprakash M. Characterization and risk assessment studies of bed sediments of River Adyar-An application of speciation study. International Journal of Environmental Resources. 2009; 3(4): 581-598. 5 Nicolau R, Galera-Cunha A, Lucas Y. Transfer of nutrients and labile metals from the continent to the sea by a small Mediterranean river. Chemosphere. 2006; 63: 469–476. 6 Akcay H, Oguz A, Karapire C. Study of heavy metal pollution and speciation in Buyak Menderes and Gediz river sediments. Water Research. 2003; 37: 813–822. 7 Asa SC, Rath P, Panda UC, Parhi PK, Bramha S. Application of sequential leaching, risk indices and multivariate statistics to evaluate heavy metal contamination of estuarine sediments: Dhamara Estuary, East Coast of India. Environ Monit Assess. 2013; 185(8): 6719-6737. 8 Sundaray SK. Application of multivariate statistical techniques in hydrogeochemical studies—A case study: Brahmani–Koel River (India). Environ Monit Assess. 2010; 164: 297–310. 9 Rath P; Bhatta D, Sahoo BN, Panda UC. Multivariate statistical approach to study physiochemical characteristics in Nandira–Brahmani River. Pollution Research. 2000; 19(4): 701–710. 10 Rath P, Panda UC, Bhatta D, Sahoo BN. Environmental quantification of heavy metals in the sediments of Brahmani and Nandira rivers Orissa, India. Journal of Geological Society of India. 2005; 65: 487–492. 11 Rath P, Panda UC, Bhatta D, Sahu KC. Use of sequential leaching, mineralogy, orphology and multivariate statistical technique for quantifying metal pollution in highly polluted aquatic sediments—a case study: Brahmani Nandira rivers, India. Journal of Hazardous Materials. 2009; 16: 632–644. 12 Konhauser KO, Powel MA, Fyfe WS, Longstaffle FJ, Tripathy S. Trace element geochemistry of river sediment, Orissa state, India. J. Hydrology. 1997; 193: 258-268.
Table 6 Heavy metal load with rate of erosion in the 1 Brahmani River basin. Metal Fe Mn Co Ni Cu Zn Cr Pb Cd Total load
T Load [ Yea ] 4.833 0.261 0.107 0.224 0.216 0.391 0.762 0.083 0.029 6.907
Rate of erosion [kg ] 123.550 6.671 2.747 5.723 5.524 10.007 19.480 2.126 0.754 176.582
Conclusion The mean concentrations of different metals in fresh water and saline water zone follow the order Fe> Cr> Zn> Mn> Ni> Cu> Co> Pb> Cd and Fe> Zn> Cr> Cu> Mn> Pb> Ni> Cd> Co respectively. The average concentration of metals in estuarine saline water zone was found to be less than that of the river fresh water zone. Average concentrations of all the dissolved metals in both river and estuary were much higher than the world river average. With respect to Cr and Cd the river average was above criteria of maximum concentration (CMC) as prescribed by US Environmental Protection Agency, 2006. Except Fe and Mn in some coastal stations, enrichment of all metals was observed at all the stations. MPI values showed that the water from stations BR_2, Br_9 and BR_10 remained in class V i.e. strongly affected category as far as metal contamination is concerned. Three principal components have been isolated which explained 82.99 % of the total variance. The cross validated classification results of discriminate reveal that 88.0% of cases were classified correctly into river, estuary and coastal groups. River Brahmani with an annual discharge of 18.58 x 10 carries 6.907 x 10 of total heavy metals into Bay of Bengal
ASA et al.: DYNAMICS AND QUANTIFICATION OF DISSOLVED METALS IN A HIGHLY CONTAMINATED RIVER-ESTUARINE 1321 SYSTEM 13 Gorlach U, Boutron C. Preconcentration of lead, 30 National Primary Drinking Water Regulations. United cadmium, copper and zinc in water at the pg g−1 level States Environmental Protection Agency (USEPA). by non-boiling evaporation. Analytica Chimica Acta. 816-F-09-004; 2009. 1990; 236: 391–396. 14 Brewer PG, Spencer DW, Smith CL. In: ASTM STP443. Atomic absorption spectroscopy, American 31 National Recommended Water Quality Criteria. Society for testing and materials; pp. 70. 1969. United States Environmental Protection Agency 15 APHA. Standard Methods for the Examination of (USEPA). Office of Water, Office of Science and Water and Wastewater (1995) 19th edn, American Technology; 2006. Public Health Association /American Water Works 32 Trivedi RK, Goel PK. Chemical and biological Association/Water Environment Federation: methods for water pollution studies. Karad, Washington DC; USA. 1995. Environmental Publications, [India]: 1984. 16 Simeonov V, Stratis JA, Samara C, Zachariadis G, 33 Smith KA. Heavy metals in soils. In Alloway BJ Voutsa D, Anthemidis A, Sofoniou M, Kouimtzis TH. (Ed.), Blackie and son, [London], 1990; 197–221. Assessment of surface water quality in northern 34 Stumm W, Morgan JJ. Aquatic chemistry. Wiley Greece. Water Research. 2003; 37: 4119–4124. [New York:]: pp. 583; 1970. 17 Singh KP, Malik A, Mohan D, Sinha S. Multivariate 35 Louies K. Aspects of river pollution. Butterworth: statistical techniques for the evaluation of spatial and [London]; 1957. temporal variation in water quality of Gomati river 36 Nriagu JO, Pacyana JM. Quantitative assessment' of (India)—a case study. Water Research 2004; 38: world-wide contamination of air, water and soils by 3980–3992. trace metals. Nature. 1988; 333: 134 – 139. 18 Mukherjee DP. Global perspective of monitoring 37 Cabaniss SE, Shuman MS. Copper binding by metal ions in Ganges river- A case study. Archives of dissolved organic matter: 1. Suwannee River fulvic Applied Science Research. 2012; 4 (2): 1007-1021. acid equilibria. Geochim. Cosmochim. Acta. 1988; 52: 19 Jameel AA. A study on the distribution of organic 185-193. matter and toxic metals in sediments of river Cauvery 38 Vazquez GF, Sharma VK. Magallanes VR, Marmolejo at Tiruchirapalli. Indian Journal of Environmental AJ. Marine Pollution Bulletin 1999; 38: 479 – 485. Protection, 2001, 21(4), 302–304. 39 Gambrell RP, Wiesepape JB, Patrick WH Jr, Duff 20 Patil PR, Shrivastava VS. Metallic status of river MC. The effects of pH, redox, and salinity on metal Godavari—A statistical approach. Indian Journal of release from a contaminated sediment. Water, Air, and Environmental Protection. 2003; 23(6): 650–653. Soil Pollution. 1991; 57-58: 359-367. 21 Manjunatha BR, Balkrishna K, Shankar R, 40 Datar A, Vashishtha RP. Investigation of heavy metals Mahalingam TR. Geochemistry and assessment of in water and silt sediments of Bitwa river. Indian metal pollution in soils and river components of a Journal of Environmental Protection. 1990; 10(9): 66– monsoon dominated environment near Karwar, 672. Southwest coast of India. Environmental Geology. 41 Paucot H, Wollast R. Transport and transformation of 2001; 40: 1462–1470. trace metals in the Scheldt estuary. Marine Chemistry. 22 Jain CK, Sharma MK. Heavy metal transport in the 1997; 58: 229–244. Hindon river basin, India. Environmental Monitoring 42 Umar A, Umar R, Ahmad MS. Hydrogeological and and Assessment. 2006; 112: 255–270. hydrochemical frameworks of regional aquifer system 23 Sundaray SK, Nayak BB, Lin S, Kanungo TK, Bhatta in Kali-Ganga sub-basin, India. Environmental D. Dynamics and quantification of dissolved heavy Geology 2001; 40(4–5): 602–611. metals in the Mahanadi river estuarine system, India. 43 Alan W. Soil and environment. Cambridge University Environ Monit. Assess. 2011; 184(2): 1157-1179. Press, [Cambridge]: pp. 287; 1996. 24 Senapati NK, Sahu KC. Heavy metal distribution in 44 Martin JM, Whitfield M. The significance of the river Subarnarekha river east coast of India. Indian Journal input of chemical elements to the ocean. In Wong CS, of Marine Sciences. 1996; 25: 109–114. Boyle EA, Bruland KW, Burton JD, Goldberg ED 25 Li S, Zhang Q. Spatial characterization of dissolved (Eds.), Tracemetals in sea water, Plenum [New York]: trace elements and heavy metals in the upper Han pp. 265–296; 1983. River (China) using multivariate statistical techniques. 45 Comans RNJ, Van Dijk CPJ. Role of complexation Journal of Hazardous Materials. 2010; 176: 579–588. processes in Cd mobilization during estuarine mixing. 26 Hamad SH, Schauer JJ, Shafer M, et al., The Nature. 1988; 336: 151–154. Distribution between the Dissolved and the Particulate 46 Tamasi G, Cini R. Heavy metals in drinking waters Forms of 49 Metals across the Tigris River, Baghdad, from Mount Amia ta. Possible risks from arsenic for Iraq. The Scientific World Journal. 2012; DOI: public health in the province of Siena, Science of the 10.1100/2012/246059. Total Environment. 2004; 327: 41-51. 27 Salomons W, Forstner U. Metals in the hydrocycle. 47 Caerio S, Costa MH, Ramos TB, Fernandes F, Silveira Springer, [Berlin]: pp. 349; 1984. N, Coimbra A, Painho M. Assessing heavy metal 28 BIS. Drinking water specification IS: 10500. Bureau contamination in Sado Estuary sediment: An index of Indian Standards, [New Delhi]: 1991. analysis approach. Ecological Indicators. 2005; 5: 29 WHO, Guidelines for Drinking Water Quality, 3rd 155-169. edition. World Health Organization. [Geneva]: 2004.
1322 48
49
INDIAN J. MAR. SCI., VOL. 44, NO. 9 SEPTEMBER 2015
Liu CW, Lin KH, Kuo KM. Application of factor analysis in the assessment of ground water quality in a blackfoot disease area in Taiwan. Science of the Total Environment. 2003; 313: 77–89. Panda UC, Sundaray SK, Rath P, Nayak BB, Bhatta D. Application of factor and cluster analysis for characterization of river and esturine water system-A case study: Mahanadi River (India). J. Hydro. 2006; 331 (3-4): 434-445.
50
51
Kersten M. Geochemistry of priority pollutants in anoxic sludges: Cadmium, arsenic, methyl mercury and chlorinated organics, in Salomons W. and Forstner U., Eds., Chemistry and biology of solid waste: Springer-Verlag,[Berlin]: pp. 170-213; 1988. International Commission on Irrigation and Drainage (ICID). Water Resources Assessment of Brahmani River Basin, India, A document to analyse the future scenarios of a relatively water-rich basin as support to country water policies, [New Delhi]; 2005.