Articles in PresS. J Neurophysiol (January 21, 2015). doi:10.1152/jn.00810.2014
1
Dynamics of 3d view invariance in monkey inferotemporal cortex
2
3
N. Apurva Ratan Murty and Sripati P. Arun*
4
Centre for Neuroscience, Indian Institute of Science, Bangalore, India
5
* To whom correspondence should be addressed (
[email protected])
6
Abbreviated Title
: Dynamics of view invariance in monkey IT
7
Number of Figures
: 9
8
Number of Tables
: 0
9
Number of pages
: 49
10 11
Page 1 of 50
Copyright © 2015 by the American Physiological Society.
12
Abstract
13
Rotations in depth are challenging for object vision because features can appear,
14
disappear, be stretched or compressed. Yet we easily recognize objects across views. Are the
15
underlying representations view invariant or dependent? This question has been intensely
16
debated in human vision, but the neuronal representations remain poorly understood. Here, we
17
show that for naturalistic objects, neurons in the monkey inferotemporal (IT) cortex undergo a
18
dynamic transition in time whereby they are initially sensitive to viewpoint, and later encode
19
view-invariant object identity. This transition depended on two aspects of object structure: it was
20
strongest when objects foreshortened strongly across views and were similar to each other. View
21
invariance in IT neurons was present even when objects were reduced to silhouettes, suggesting
22
that it can arise through similarity between external contours of objects across views. Our results
23
elucidate the viewpoint debate by showing that view invariance arises dynamically in IT neurons
24
out of a representation that is initially view dependent.
25 26
Page 2 of 50
INTRODUCTION
27 28
Object vision is challenging because images of an object vary widely with the viewing
29
conditions (Tanaka, 1996, Logothetis and Sheinberg, 1996, Pinto et al., 2008, Dicarlo et al.,
30
2012, Poggio and Ullman, 2013). Rotations in depth can pose a particular challenge because
31
features can appear, disappear, be stretched or compressed. Yet we easily recognize most natural
32
objects across rotations in depth. Is the underlying object representation view dependent or
33
invariant? This question has been extensively debated in human vision. While judging whether
34
two images belong to the same object, humans take longer to respond to disparate views. This
35
has been taken as evidence for viewpoint dependence (Tarr, 1995, Tarr and Buelthoff, 1995,
36
Hayward and Tarr, 1997, Tarr et al., 1997, Tarr et al., 1998, Gauthier et al., 2002, Fang and He,
37
2005, Andresen et al., 2009). However, these effects are mitigated or even absent for dissimilar
38
objects (Edelman, 1995, Newell, 1998, Foster and Gilson, 2002, Wilson and Farah, 2003,
39
Lawson and Buelthoff, 2006, Lawson and Buelthoff, 2008). Biederman and colleagues have
40
argued that objects that differ in non-accidental properties exhibit viewpoint invariance whereas
41
objects differ in metric properties exhibit viewpoint dependence (Biederman and Cooper, 1991,
42
Biederman and Gerhardstein, 1993, Biederman and Gerhardstein, 1995). These findings suggest
43
that view dependence and invariance depend on object structure and may even co-exist (Foster
44
and Gilson, 2002, Stankiewicz, 2002, Lawson and Buelthoff, 2006, Lawson and Buelthoff,
45
2008). However, precisely which image properties determine view dependence and invariance
46
remain unclear.
47
Despite these insights from human studies, the underlying neuronal representations have
48
received relatively little attention. A natural locus for view invariant representations is the
49
monkey inferotemporal (IT) cortex, whose neurons are invariant to attributes such as size,
Page 3 of 50
50
position and clutter (Dicarlo et al., 2012, Tanaka, 1996). However there are mixed reports of
51
view invariance in IT neurons. On the one hand, IT neurons respond to some but not all views of
52
artificial objects in naïve animals (Yamane et al., 2008). View-specific responses have also been
53
observed for wireframe objects despite extensive training on view-invariant recognition
54
(Logothetis and Pauls, 1995, Logothetis et al., 1994, Logothetis et al., 1995). Such responses can
55
delay the process of matching the views of an object, and can give rise to view dependence in
56
behavior (Perrett et al., 1998). On the other hand, IT neurons respond in a view invariant manner
57
to familiarized natural objects (Booth and Rolls, 1998) and faces (Perrett et al., 1991, Eifuku
58
et al., 2004, Freiwald and Tsao, 2010, Eifuku et al., 2011). These disparate findings can be
59
reconciled by the fact that the first set of studies used artificial objects such as wireframes whose
60
images vary drastically with viewpoint, whereas the second set of studies used natural objects
61
whose images do not vary greatly with viewpoint. Therefore it is not clear whether IT neurons
62
are view invariant for naturalistic objects in general. To elucidate this issue, we systematically
63
tested IT neurons using naturalistic objects in monkeys with no prior training on these objects.
64
We performed a total of three experiments. In Experiment 1, we recorded neuronal
65
responses to a diverse set of objects in two views each. Here, we observed a dramatic transition
66
wherein neurons were initially strongly modulated by view and subsequently were modulated by
67
object identity. This transition was strongly dependent on object structure: it was strongest when
68
objects foreshortened strongly across views, and were similar to each other at the pixel level. In
69
Experiment 2, we confirmed that this transition was present even for objects across multiple
70
views. In Experiment 3, we compared view invariance for objects and their silhouettes. Here,
71
view invariance was still present, suggesting that invariance can arise through similarity between
72
external contours across views. Finally we tested a number of computational models for their
Page 4 of 50
73
ability to predict the view invariance observed in our data. The early sensitivity to view in IT was
74
explained by low-level pixel differences, whereas the later view invariance was partly explained
75
by affine matching operations between object views. Our results suggest a coarse-to-fine
76
processing scheme in IT wherein neurons are initially sensitive to coarse, low-level differences
77
between views and only later become invariant to object identity independent of view.
Page 5 of 50
METHODS
78 79
All experiments were performed according to a protocol approved by the Institutional
80
Animal Ethics Committee of the Indian Institute of Science, Bangalore and the Committee for
81
the Purpose of Control and Supervision of Experiments of Animals, Government of India. These
82
procedures also conform to the APS Guiding Principles in the Care and Use of Vertebrate
83
Animals in Research.
84
Neurophysiology: Two adult male monkeys (Macaca radiata, laboratory designations Ro and
85
Xa, both aged 14 years, colony-born) were used in the study. Prior to recording, each monkey
86
was surgically implanted with a titanium head-post and a Cilux recording chamber (Crist
87
Instruments, USA). The recording chamber was guided through structural MRI to be centered on
88
the anterior half of IT i.e. lateral to the anterior medial temporal sulcus on the ventral bank of the
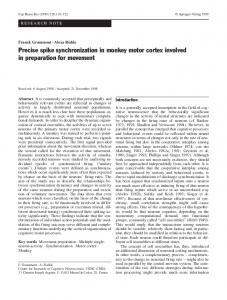
89
superior temporal sulcus (Figure 1A). The center of the recording chamber was placed at a
90
location which corresponded to 18 mm anterior to the interaural plane in a standard rhesus
91
monkey anatomical atlas (Saleem and Logothetis, 2007) – this corresponded to anterior 14 mm
92
& lateral 19 mm in Monkey Ro and anterior 18 mm & lateral 18 mm in Monkey Xa (Figure
93
1A). This was subsequently verified in the latter using post-mortem histology. Eye position was
94
monitored using an infra-red eye tracker system (ISCAN Inc). On each day of recording, a
95
tungsten microelectrode with an initial impedance of about 1 MΩ at 1 kHz (FHC Inc.) was
96
inserted using a square grid with 1-mm spacing through a transdural guide tube and advanced to
97
~10 mm above IT. The electrode was then lowered using a micromanipulator (Narishige Inc.)
98
until phasic visual responses were observed. Action potentials were isolated from the multi-unit
99
trace after high-pass filtering (4-pole Butterworth filter, cutoff frequency 75 Hz) using a
100
commercial spike sorting system (Plexon Inc.) and these waveforms were sorted into individual
101
units afterwards based on cluster and waveform analysis (Offline Sorter, Plexon Inc.). Stimulus Page 6 of 50
102
presentation, reward and eye position were under control of a computer running Cortex software
103
(NIMH DOS Cortex; 120-Hz Viewsonic monitor).
104
Behavioral task: Neuronal activity was recorded during passive fixation. The monkey was seated
105
at a distance of 50 cm from a computer monitor (Viewsonic VX2268wm, 120-Hz refresh rate).
106
On each trial, a red fixation cross (measuring 0.6°) appeared at the beginning, and the animal
107
was required to maintain its gaze within a 3° rectangular window centered on the cross. About
108
200 ms after attaining fixation, eight images appeared for 200 ms each with an inter-stimulus
109
interval of 200 ms. The monkey received a juice reward for successfully maintaining fixation
110
throughout the trial. Although the fixation window was large, post-hoc analyses of the monkeys’
111
eye movements revealed that gaze remained closely centered on the cross throughout the trial
112
(average standard deviations: 0.33° along horizontal, 0.24° along the vertical).
113 114
Experiment 1 (objects at two views)
115
A total of 90 grayscale images were used in the main experiment. We avoided showing
116
full-color objects to preclude finding an artefactual view invariance arising from neuronal
117
selectivity for color. We used a total of 45 naturalistic objects: 15 animals (including four-legged
118
animals, birds and insects) and 30 inanimate manmade objects chosen from Hemera Photo
119
Objects and the Amsterdam Library of Object Images (Geusebroek et al., 2005). We selected
120
images corresponding to 2 views: a profile view (defined as the view in which the object was
121
elongated) and an oblique view that corresponded to roughly 45-degree rotation in depth out of
122
the image plane. Profile views were scaled uniformly such that the longer dimension subtended a
123
visual angle of 5.5°. Each oblique view was scaled such that its height matched the height of the
Page 7 of 50
124
profile view, with the result that it appeared to be a plausible depth-rotated version of the profile
125
view.
126
Trial design: Stimuli were separated into two groups of 24 each, one containing 17 animals and
127
7 things and the other containing 24 things. Three objects (2 animals, 1 thing) were subsequently
128
discarded because their views were erroneously selected from different objects. Each trial
129
consisted of eight stimuli presented for 200 ms with a 200 ms inter-stimulus interval. Stimuli
130
were presented in random order. On a given trial, stimuli alternated between the two groups
131
(with either group appearing first) and between profile and oblique views with the constraint that
132
the two views of the same object never occur in a single trial. Each stimulus was repeated a total
133
of 8 times. A total of 111 visually responsive neurons (n = 85 from monkey Ro, n = 26 from
134
monkey Xa) were recorded from 58 sites in this experiment.
135 136
Experiment 2 (multiple views)
137
A total of 6 objects were used in this experiment (dog, elephant, fish, gun, motorbike,
138
trumpet). Each object was presented in 7 views. For each object we took the profile view (i.e. the
139
view at which its image was the most elongated, scaled to 5.5° as before) to be 0 degrees, and the
140
six views corresponded to rotations of 30, 60, 75, 90, 105, 120 and 150 degrees in depth. Each
141
trial consisted of 7 stimuli presented for 200 ms each with a 200 ms blank interval. Stimuli were
142
presented in random order, with the constraint that all stimuli presented in each trial belonged to
143
distinct objects. For the purposes of this study, we removed the 90-degree view from all analyses
144
because it severely obscured object identity. Each stimulus was repeated a total of 8 times across
145
trials. A total of 23 visually responsive neurons (n = 16 from monkey Ro, n = 7 from monkey
146
Xa) were recorded from 16 sites in this experiment. Page 8 of 50
147
Experiment 3 (silhouettes)
148
The stimuli in this experiment consisted of 24 objects (12 animals and 12 things) chosen
149
from the objects in Experiment 1 (Figure 7A). The two views of each object were shown in
150
natural and silhouette forms. The two versions were run in separate blocks, with block order
151
chosen at random for each session. Other details such as repetitions and stimulus order in a trial
152
were as in Experiment 1. A total of 61 visually responsive neurons (n = 27 from monkey Ro, n =
153
34 from monkey Xa) from 38 sites were recorded in this experiment.
154 155
Data Analyses
156
Analysis of variance: The stimuli in Experiment 1 consisted of 45 objects presented in 2 views
157
each. To assess the degree to which each neuron was modulated by object identity or by view,
158
we analyzed neuronal responses to 2 objects at 2 views each so that object and view effects could
159
be compared in an unbiased manner. For neuron and object pair (A,B), we performed an
160
ANOVA on the firing rates with view (profile/oblique) and object (A/B) as factors. To measure
161
the effect strength, we calculated the difference between the response to the preferred and non-
162
preferred conditions. For instance, the object main effect strength is the difference between the
163
responses to the preferred and non-preferred objects. Likewise, the view main effect strength is
164
the response difference between the preferred and non-preferred views.
165
A direct measure of object effect strength would be the difference between responses to
166
preferred and non-preferred objects. However, this measure is biased because it will always yield
167
a positive difference even for random noise. To overcome this limitation, we used a split-half
168
approach. Using the odd-numbered trials, we identified the preferred object (across views) and
Page 9 of 50
169
then used the even-numbered trials to calculate the difference between the responses to the
170
preferred and non-preferred objects. This process was repeated by identifying the preferred
171
object using the even-numbered trials and calculating the response difference using the odd-
172
numbered trials. These two estimates were averaged together to yield an unbiased estimate of the
173
effect strength. This method ensures that the average effect strength is zero for random noise. We
174
used the same approach to calculated unbiased estimates of view and interaction effect strengths.
175 176
Baseline View invariance index: To assess the baseline level of view invariance present in the
177
image, we calculated a modulation index of the form (O-V)/(O+V) where O is the object
178
modulation – calculated as the summed absolute difference in pixel intensities between the two
179
objects averaged across views, and V is the view modulation – calculated as the summed
180
absolute difference in pixel intensities between two views, averaged across objects. A baseline
181
view invariance of 1 would indicate strong object modulation and weak view modulation, as may
182
be expected from two objects such as a wine glass and a sphere that are symmetric about
183
rotations in depth. A baseline view invariance of -1 would indicate strong view modulation and
184
weak object modulation, as may be expected for highly similar objects that foreshorten greatly
185
across views. To compare this with the view invariance in IT, we calculated an analogous view
186
invariance index for each object pair using the peak object effect strength and the peak view
187
effect strength (averaged across neurons).
188 189
Population decoding: For each trial of every image and in each time bin, we calculated a
190
population response vector containing the firing rates evoked by all neurons. This analysis
191
assumes that neuronal responses were recorded simultaneously whereas they were in fact Page 10 of 50
192
recorded on separate sessions. The resulting estimate of decoding accuracy is a lower bound on
193
the information present in the population (Hung et al., 2005). We projected the entire set of
194
response vectors along their principal components in order to retain 80% of the total variance.
195
This step was necessary particularly for the initial time bins when many neurons produce a zero
196
response and consequently infinitely many solutions for the best hyperplane separating the
197
classes. Varying the fraction of retained variance did not qualitatively change any of the results.
198
We then trained multi-class linear classifiers (classify function in Matlab) on the response vector
199
and the associated label (for the view decoder, a binary vector representing the profile or oblique
200
view; for the object decoders, a vector of integers representing object identity). We evaluated the
201
performance of the view decoder using a leave-one-out procedure: for each trial, we trained the
202
decoder on the remaining trials and predicted its view label. On repeating this for all trials we
203
obtained a percent-correct measure that indicates how well view identity could be decoded using
204
the population responses in that trial. We used an analogous procedure for the view-specific
205
object decoder: we used a leave-one-out process to obtain the predicted object label at each view,
206
and averaged the performance across views. To evaluate the view-invariant object decoder, we
207
trained the decoder only on one view (e.g. profile) and tested it on trials in which the other view
208
was shown (e.g. oblique). This was done with both views as the training data and the resulting
209
performance was averaged to obtain an estimate of view-invariant object decoding.
210
In Experiment 3 (multiple views), we used a similar approach. For the view decoder, we
211
used a leave-one-out procedure to obtain a predicted view label for each trial. For the view-
212
specific object decoder, we trained a multi-class object classifier at each view, evaluated it using
213
a leave-one-out procedure, and averaged the performance across views to get an estimate of
214
view-specific object decoding. For the view-invariant object decoder, we trained a multi-class
Page 11 of 50
215
object classifier on all trials regardless of view, and evaluated it using a leave-one-out procedure.
216
We obtained qualitatively similar results on evaluating all three decoders using pairs of views
217
instead of all views at once and observed no systematic variations in our results with differences
218
in view angle.
219 220
Multidimensional Scaling. To visualize similarity relations between objects across the neuronal
221
population, we used multidimensional scaling. We calculated the similarity in neuronal activity
222
elicited for every pair of images as the average absolute difference in firing rate elicited by these
223
images across neurons (other measures of distance – such as correlation or Euclidean metrics
224
yielded similar results). This method finds the coordinates of each image in a two-dimensional
225
space such that the distances between images best matches the pairwise neuronal distances. This
226
was implemented using standard functions (mdscale, MATLAB). To assess the degree of match
227
between the two-dimensional embedding and the actual neuronal distances, we calculated the
228
correlation between them. This correlation coefficient is shown in each multidimensional scaling
229
plot and was generally high, indicating that the multidimensional scaling plots are a reasonable
230
approximation to the observed similarity relations.
231 232
Computational models
233
V1 model. To investigate whether the observed similarity data could arise from neural activity in
234
V1, we set up a standard V1 model consisting of Gabor filters (Pinto et al., 2008). For every
235
image, the V1 model produces the responses of a population of putative V1 neurons using a bank
236
of Gabor filters with lateral interactions that implement divisive normalization. In the V1 model,
Page 12 of 50
237
we used a scaling factor of 1 dva = 18 pixels based on published observations regarding the sizes
238
of V1 receptive fields. Our V1 model was identical to a previously published model (Pinto et al.,
239
2008). The output of the V1 model consisted of the activity of 96 model units in response to an
240
image, which was concatenated to create a feature vector.
241 242
HMAX model: We evaluated a model of high-level visual cortex (without training on our
243
stimuli), for its ability to match the observed view dependence and invariance in IT. The model
244
has several layers of units (S1, C1, S2 & C2), which alternate between summing and winner-
245
take-all (MAX) computations. We used an implementation of the HMAX model from a previous
246
study
247
http://riesenhuberlab.neuro.georgetown.edu/hmax/code.html), with parameters based on a recent
248
report from the same group (Serre and Riesenhuber, 2004). In the implementation, the first layer
249
(S1) can be chosen to have orientation tuning with Gaussian, Gabor or Difference-of-Gaussian
250
functions. Among the three filters, the Gaussian filter yielded the best fits which are what we
251
report here. We chose the C2 responses because they are the most complex and therefore most
252
likely to show view invariance. For each image, the model returns the response of 256 C2 units,
253
which we took as the feature vector.
(Riesenhuber
and
Poggio,
2000;
downloaded
254
Page 13 of 50
in
October
2013
from
RESULTS
255 256
We performed three experiments to investigate the dynamics of view invariance in IT
257
neurons. In all experiments, monkeys were trained to fixate a series of images presented at the
258
fovea and had no prior visual experience or training on these images.
259
Following previous studies, we measured view invariance by comparing the modulation
260
across views of an object with the modulation across object identity. However, it is important to
261
compare the view invariance measured in IT neurons with that expected from the image itself.
262
As an extreme example, consider a wine glass and a sphere. Both objects produce the same
263
image when rotated in depth, resulting trivially in complete view invariance. To establish a
264
baseline level of invariance, we compared the average change in pixels across views with the
265
average change in pixels across objects. In general, a horizontally elongated planar object (e.g.
266
motorbike) will produce greater image changes across views than a round non-planar object (e.g.
267
kettle) because it foreshortens strongly. Thus the baseline level of view invariance will be small
268
for objects that foreshorten strongly across views. We selected a diverse set of objects to
269
investigate the specific image properties that influence view invariance and its dynamics.
270 271
Experiment 1: Objects in two views
272
Here, we recorded the activity of 111 neurons from the left anterior IT cortex of two
273
monkeys (Figure 1A). We chose a large number of objects at the expense of views to activate a
274
broad range of neurons. In all there were 45 objects (15 animate and 30 inanimate objects), each
275
presented in two views. For each object, the view in which it was most elongated was defined as
276
the profile view. The other view, defined as the oblique view, corresponded to a 45-degree
Page 14 of 50
277
rotation in depth about the vertical axis from the profile view. We chose 45-degree rotations as a
278
reasonable compromise between smaller rotations that produce highly similar images and larger
279
rotations that potentially obscure object identity (Blanz et al., 1999, Gomez et al., 2008) or lead
280
to mirror confusion (Rollenhagen and Olson, 2000).
281
Figure 1B shows the responses of a single IT neuron to a subset of the objects at both
282
views. Its responses were invariant across views, as evidenced by a high correlation between the
283
firing rates evoked during the image presentation period (0-200 ms) across all 45 objects (r =
284
0.79, p < 0.0005; Figure 1C). This view invariance was extremely widespread across the
285
population: 84 of the 111 neurons (76%) exhibited a significant response correlation (p < 0.05)
286
between the two views (average correlation: r = 0.42 ± 0.18; average significant correlation: r =
287
0.50 ± 0.13; Figure 1D).
288
We observed no significant differences in this correlation between subgroups of objects
289
(r = 0.28 for animates, r = 0.32 for inanimates; p = 0.24, Wilcoxon signed rank test). There was
290
also no significant tendency for view invariant neurons to be located at more anterior or lateral
291
recording sites (response correlation versus recording location: along the anterior-posterior axis:
292
r = -0.15, p = 0.13; along the medial-lateral axis: r = -0.06, p = 0.54). To assess whether
293
invariant neurons have longer response latencies, we investigated the relationship between the
294
response latency (measured as the time at which the average firing rate attained its peak) for each
295
neuron and its response correlation across views. We found no significant tendency for view
296
invariant neurons to have delayed responses (i.e. there was no relationship between profile-
297
oblique correlation and peak response latency across neurons: r = 0.06, p = 0.42; average peak
298
latency: 109 ms).
299 Page 15 of 50
300
Object and view modulation in IT neurons
301
To investigate view invariance in greater detail, we characterized the degree to which
302
object identity and view modulated the neuronal response. A neuron that is view invariant would
303
be strongly modulated by object identity and less so by view, whereas a neuron than is view
304
dependent would show the opposite pattern. Although in principle we could have performed an
305
ANOVA with object identity (45 objects) and view (2 views) as factors, the larger number of
306
objects compared to views could potentially overestimate object identity effects compared to
307
view effects simply because of wider sampling. To avoid this problem, we performed ANOVAs
308
on pairs of objects with two views each. This allowed us to compare in an unbiased manner the
309
strength and incidence of view and object identity effects across neurons and objects. Of
310
particular interest to us was the incidence of main effects of object identity that occurred without
311
a significant view or interaction effect, indicative of view invariance.
312
We performed an ANOVA on the firing rates of each cell (during 0-200 ms after image
313
onset) to pairs of objects (A, B) in both views, with view (profile/oblique) and object identity
314
(A/B) as factors. Across all 111 cells and all 990 pairs of objects (45C2), we observed 1.6 times as
315
many main effects of object identity (25% of cases) as for view (15% of cases) (Figure 2A).
316
Importantly, among the cases with an object main effect, 68% of them had no other significant
317
view or interaction effect, indicating view invariance (Figure 2A). To investigate whether view
318
and object identity modulation co-occurred across neurons, we compared the number of
319
significant view effects against the number of significant object identity effects for each neuron.
320
We found a significant correlation between these two measures (r = 0.6, p < 0.00005). Thus,
321
neurons that show strong object identity modulation also show strong view modulation.
Page 16 of 50
322
To investigate the temporal evolution of these signals, we obtained unbiased estimates of
323
the object identity, view and interaction effect strengths in 20 ms time bins across the entire
324
visual response (see Methods). Across all cells and object pairs, object identity signals were
325
consistently twice as large in magnitude compared to view signals (Figure 2B). Thus, IT neurons
326
are modulated more by object identity than by view.
327 328
Dynamics of object and view signals depend on object structure
329
We then asked whether the dynamics of view and object identity vary with object
330
structure. We tested two specific predictions: (1) objects that foreshorten strongly with rotation
331
exhibit greater image changes across views, and should therefore elicit stronger view
332
modulation; and (2) objects that are dissimilar should have greater object modulation since their
333
images are more distinct at the pixel level.
334
To measure the foreshortening experienced by each object with changes in view, we
335
calculated the decrease in its width across views relative to its width in the profile view. In
336
general this measure will be small for non-planar objects in which new surfaces become visible
337
with rotation in depth, and large for planar objects which foreshorten strongly upon rotation.
338
Among the many possibilities we tested, this measure of foreshortening was best able to explain
339
the observed view modulation in IT neurons. For instance, other measures of low-level
340
differences – such as the summed pixel-wise difference between the two views – did not account
341
as well for the observed view modulation in IT neurons.
342
To investigate how foreshortening affects view and object modulation in IT, we sorted
343
object pairs in descending order of average foreshortening and plotted the time course of the
Page 17 of 50
344
object identity, view and interaction effects as a colormap (Figure 3A-C). We found a striking
345
difference in dynamics: for objects with high foreshortening, such as the deer & motorbike
346
(Figure 3D, inset), view modulation was strong and peaked before object identity modulation
347
(Figure 3D). Thus there is a transition in the neuronal response from a representation dominated
348
by early viewpoint dependence (i.e. modulation across views) to a representation dominated by
349
viewpoint invariance (i.e. modulation by object identity) for high foreshortening objects. These
350
dynamics were different for objects with low foreshortening such as the pepper & chair (Figure
351
3E, inset). Here, we observed an early and strong object identity modulation that persisted
352
throughout the visual response (Figure 3E). To investigate how view modulation is influenced by
353
foreshortening, we calculated the correlation between the peak view modulation and the average
354
foreshortening across object pairs. This yielded a significant positive correlation (r = 0.52, p