particles that hop with site-dependent rates and whose steady state shows a condensation ... the steady state of this model can be found exactly [1]. ... ZRP has been devoted to studying dynamical properties ... pears in front of the slowest car, corresponding to the ... Bose gas or in a system of noninteracting bosons in a.
Dynamics of a Disordered, Driven Zero-Range Process in One Dimension Kavita Jain and Mustansir Barma
arXiv:cond-mat/0305098v2 [cond-mat.stat-mech] 21 Sep 2003
Department of Theoretical Physics, Tata Institute of Fundamental Research, Homi Bhabha Road, Mumbai 400 005, India. We study a disordered, driven zero range process which models a closed system of attractive particles that hop with site-dependent rates and whose steady state shows a condensation transition with increasing density. We characterise the dynamical properties of the mass fluctuations in the steady state in one dimension both analytically and numerically and show that there is a dynamic phase transition in the density-disorder plane. We also determine the form of the scaling function which describes the growth of the condensate as a function of time, starting from a uniform density distribution. PACS numbers: 64.60.-i, 05.60.-k, 61.43.Hv
Since the state of a system with an ordered phase in the infinite time limit is typically very different from that far from the steady state, different processes and time scales may govern the dynamics in the steady state and the relaxation towards it. Quenched disorder can strongly affect the dynamical properties in both situations; in particular, it may give rise to new dynamic universality classes. In the absence of a general framework for analyzing nonequilibrium, disordered systems, it is evidently of interest to develop a detailed understanding of these changes using simple models. We address the above issues in a disordered, driven zero range process (ZRP) which is a stochastic lattice model of interacting particles. In this process, a site can be occupied by an arbitrary number of unit-mass particles. Interparticle interactions are modeled by allowing the hop-out rate of a particle to depend on the mass at the site it leaves; in general, these rates may even be site dependent. Remarkably, for any choice of rates, the steady state of this model can be found exactly [1]. There has been a surge in interest in the ZRP following the finding that this model can show a condensation transition in which at high densities, a finite fraction of particles condense onto a single site. This transition occurs in the steady state of the conserved mass model for a wide choice of hopping rates [2]. Recent work on the ZRP has been devoted to studying dynamical properties [3, 4, 5] and using it to develop a general understanding of nonequilibrium steady states [6, 7], besides modeling various physical systems [2, 8]. Here we consider a disordered, driven ZRP in one dimension in which a particle hops forward at a rate which is independent of the mass. Quenched disorder is modeled by choosing site-dependent hopping rates drawn from a distribution. The steady state of such a ZRP has been shown to exhibit a phase transition, from a low density, homogeneous phase to a high density phase with a condensate at the site with the lowest hopping rate [3, 9]. Interestingly, by regarding sites as particles and masses as hole clusters, this model maps exactly onto a simple traffic model of cars (particles) with different preferred speeds on a single-lane highway, with no possibility of
overtaking. At low densities, an infinite headway appears in front of the slowest car, corresponding to the condensate in the ZRP [3, 9]. Our results pertain both to the dynamical properties in the steady state and to the manner in which the system relaxes to it. While the former concerns the motion and the decay of the density fluctuations about the mean in the bulk of the system, the latter involves the transfer of a macroscopic amount of mass from the bulk of the system to the globally slowest site. We find that different time scales govern these two processes. Our main results are summarized below. Steady state dynamics: We calculate the speed of density fluctuations in the steady state and identify the regimes in the density-disorder plane in which this speed vanishes, signalling a dynamic phase transition. Our Monte Carlo simulations show that when this speed is nonzero, the dynamic behavior remains the same as that of a pure system, while it changes if the speed vanishes. Relaxation to the steady state: We give an analytical argument for the form of the scaling function which describes the temporal growth of the condensate starting from a uniform density distribution, and present numerical evidence to support our results. The dynamic exponent is deduced from the growth law via a scaling argument and agrees with earlier results based on a deterministic traffic model [3, 10, 11]. The ZRP involves M particles on a ring of size L with an arbitrary number of particles allowed at any site. A particle hops out of a randomly selected site k to site k + 1 with quenched rate wj (k) where the subscript j is the index which ranks the rates in ascending order, with j = 1 labeling the lowest rate. The rate w(k) is chosen to be independent of the mass at site k so that the system has on-site attractive interactions [12]. These site-dependent hopping rates are chosen independently from a common distribution � � n f (w) = (n + 1)/(1 − c)n+1 (w − c) , w ∈ [c, 1] ,
(1) with c, n > 0. For this process, the probability of a configuration C ≡ {m(1), ..., m(L)} in the steady state is
2 given by [3, 9] P (C) =
�m(k) L � 1 Y v , Z w(k)
(2)
k=1
P with the constraint k m(k) = M . Here Z is the partition function, m(k) is the mass at site k and v is the fugacity. The preceding equation gives the average mass µj = v/(wj − v) at the site with hopping rate wj . Since the total number of particles is conserved, we have Z 1 v 1 v ρ= + dw f (w) , (3) L w1 − v w − v c where ρ = M/L is the density. The above equation implies that in the thermodynamic limit, there exists a finite critical density ρc below which the fugacity increases with density and above which v gets pinned to the lowest hopping rate c. Thus, there is a phase transition from the low density phase with mass of order unity at each site to a high density phase with infinite mass at the site with the lowest hopping rate [3, 9]. The critical point, given by ρc = c (n + 1)/n(1 − c), is obtained from Eq.(3) on setting v equal to c in the integral. This transition is analogous to Bose-Einstein condensation in the ideal Bose gas or in a system of noninteracting bosons in a random repulsive potential [13]. We begin with a discussion of the steady state dynamics, in particular, the study of the statistical fluctuations of the density about its average. In a steady state carrying a uniform current J, these fluctuations are carried as kinematic waves whose speed vkin is known to be given by vkin = ∂J/∂ρ from a general hydrodynamic argument [14]. This speed plays an important role in determining whether the quenched disorder changes the dynamic universality class [15]. If vkin is nonzero, each density fluctuation encounters a particular patch of disorder essentially only once in an infinite system, as the probability of returning is exponentially small. Thus, the noise arising from the different patches of disorder is essentially uncorrelated in time, and we would then expect the kinematic wave to decay with the Kardar-Parisi-Zhang (KPZ) exponent [16]. However, if vkin vanishes, then this argument fails and we would expect disorder to change the dynamic universality class. In order to determine the kinematic wave speed, we use J=v and Eq.(3) to obtain Z 1 w1 w2 1 w f (w) 1 −1 + + dw , vkin = L (w1 − v)2 L (w2 − v)2 (w − v)2 c (4) where we have separated out the contributions from the −1 two slowest sites. The above expression for vkin involves 2 essentially the sum of the mass variances σj at sites with rate wj where σj2 = v wj /(wj − v)2 is obtained for all j and ρ using Eq.(2). (However, this expression for variance is invalid at the slowest site for ρ > ρc , as explained
below.) For a given set {w} and fixed density, we solved Eq.(3) numerically to determine the fugacity v which is used to find µj and σj2 . The L dependence of the mass and the variance was then found by averaging over a large number (∼ 106 ) of disorder configurations. Our findings for the mean mass µj and the fluctuations σj are summarized below. For ρ < ρc , each site supports mass of order unity with fluctuations of the same order. For ρ = ρc , both µj and σj at a site with ordering index j grow as (L/j)1/(n+1) . This can be seen by using v(ρc ) ≃ c and changing w to a uniformly distributed variable u defined by w − c = (1 − c) u1/(n+1) . For ρ > ρc , the behavior of µj and σj in a typical disorder configuration remains the same as that at the critical point for j ≥ 2. However, the disorder-averaged variance σj2 for j = 2 grows with L at the same rate as that for j = 1, and is larger than at any other site in the rest of the system, even though the second slowest site does not support a condensate. To understand this surprising feature, we numerically studied the distribution P (xj ≡ wj − v, L) for various j and L. For the slowest site, this distribution approaches a delta function centered about 1/L. Thus the expression for σj2 quoted above breaks down for j = 1 since it predicts macroscopic fluctuations at this site, implying the invalidity of the grand canonical ensemble. To determine PL the variance at this site, we use the sum rule σ12 = j=2 σj2 which follows from mass conservation and the product measure form of the steady state. Our numerical data shows that for j > 1 and large L, the distribution P (xj , L) is of the form i h P (xj , L) ≈ L1/(n+1) Xj (xj − ǫj ) L1/(n+1) Θ(xj − ǫj ) ,
(5) where Θ is the Heaviside step function, ǫj is of order 1/L and Xj is the scaling function appearing in the distribution P(wj − w1 , L) of variable wj − w1 in L trials. This distribution can be calculated and is of the same scaling form as Eq.(5) with ǫj = 0; the scaling function Xj (x) is found to grow as xj−2 for x ≪ 1 and decays as (1 − x)n as x → 1. Note that Xj (x) approaches a nonzero value as x → 0 for j = 2. Using this scaling function in Eq.(5), we find that σj2 ∼ (L/j)2/(n+1) for j > 2, while for j = 2 it is of the order L(n+2)/(n+1) . Since the contribution of σ22 dominates the rest in the sum rule, we find σ12 ∼ σ22 ∼ L(n+2)/(n+1) .
(6)
The anomalously large value of σ22 is a consequence of the nonzero probability for a near-vanishing difference between the two lowest rates. We now return to Eq.(4) and determine vkin using the results obtained above. For ρ < ρc , the first two terms in Eq.(4) are negligible in the thermodynamic limit, while the integral is of order
3
3000 n=2 2500
C(k, t)
2000 1500 n=1/2 1000 500 0 0
20000
40000
60000
t
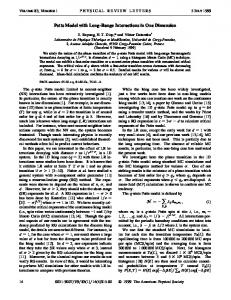
FIG. 1: Plot of the tagged particle correlation C(k, t) vs. t at the critical point showing the existence of kinematic waves for n > 1. For n = 2, the solid curve passing through the minima is a power law with exponent 2/3 and the initial tangential straight line has a slope equal to c = 1/2. For n = 1/2, the y-axis has been scaled down by a factor of 15. The data have been averaged over all k for both values of n.
unity so that vkin is nonzero. Because of the argument above, we expect that the kinematic waves decay with the KPZ exponent in this phase. For ρ = ρc , there is a transition in the behavior of ∂ρ/∂v as n crosses one [3]. Integrating σj2 over j, we find that � L(1−n)/(1+n) ,n 1 , which indicates a dynamic phase transition at n = 1 in the thermodynamic limit. For n > 1, the kinematic wave speed is nonzero and we expect the universality class to be the same as for ρ < ρc . For n ≤ 1, this speed is zero implying that the transport of density fluctuations is anomalously slow. Thus, for n ≤ 1, disorder is expected to be relevant in changing the dynamical behavior from the KPZ universality class. For ρ > ρc , due to the condensate at the slowest site, the first term in Eq.(4) diverges giving vkin = 0 for all n. ′ We consider the speed vkin in the system excluding this ′ behaves site. In a typical disorder configuration, vkin as at the critical point and there is a transition in the dynamical behavior at n = 1. However, the disorder ′−1 diverges for all n, as average of the inverse speed vkin can be seen using Eq.(6) in Eq.(4). We verified the above predictions by monitoring 2 C(k, t) = hH 2 (k, t)i − hH(k, t)i where H(k, t) is the number of particles that hop past site k in a time interval t. In the traffic model, C(k, t) gives the tagged particle correlation which measures the mean squared displacement of a tagged particle k around its mean position at
time t. In an infinite system, C(k, t) increases linearly with time and the slope gives the tagged diffusion constant. In a finite system with periodic boundary conditions, if kinematic waves are present, C(k, t) oscillates with time period L/vkin and its values at the minima are a measure of the decay of the wave. We measured C(k, t) using Monte Carlo simulations in both the phases and at the critical point. Except at very short times, C(k, t) is found to be independent of k, as explained below. In Fig. 1, we show C(k, t) as a function of time at the critical point for two values of n. For n = 2, it is found to oscillate, with the values at minima growing as a power law in time with exponent 2βKP Z = 2/3; at short times, it increases linearly with slope equal to c. For n = 1/2, there are no oscillations and C(k, t) continues to increase linearly with slope equal to c. The tagged diffusion constant is the same for all k and is equal to that of the slowest particle for ρ ≥ ρc , due to the no-overtaking constraint in the traffic model. Since the slowest particle behaves as a free, biased random walker due to the infinite headway in front of it, its diffusion constant equals c for all n. A different sort of kinetics governs the approach to the steady state in the condensate phase in which, starting from a uniform density distribution, the mass profile develops a singularity at the site with the globally minimum hopping rate. In the initial stage, the particles hop out of relatively fast sites quickly and get trapped temporarily at locally slow sites. At moderately large times, one finds a finite density of large aggregates at these slow sites, which relax by releasing their excess mass to yet slower sites on their right. Thus, the masses at slow sites first grow and then decay to their respective steady state values, except at the slowest site where the mass monotonically increases and then saturates [4]. For an analytical description of the above growth mechanism, it is useful to consider a sequence of slowly relaxing sites on the right of the slowest site. By a sequentially increasing label ℓ = 1, 2, ..., we mark the set of sites which satisfy τℓ > τℓ−1 where τℓ is the relaxation time of ℓth such site. Denote its position by Rℓ ; it is evident that Rℓ is a random variable which grows rapidly with ℓ. Now τℓ can be estimated by observing the following: (i) the mass at site ℓ grows as tβ till time scales of order τℓ−1 , accumulating mass ∆m(Rℓ ) ≃ ∆ρ Rℓ where ∆ρ ≡ (ρ − ρc ), and (ii) when the excess mass has reached the site ℓ, the region to its left has relaxed to the true steady state. At this point, the mass at site ℓ begins to decrease since the out current Jout ≈ w(Rℓ ) exceeds the in current Jin = c leading to τℓ ≈ ∆m(Rℓ )/(w(Rℓ ) − c). The growth of mass at site ℓ can be described by considering the distribution of mass ∆m(Rℓ ) at location Rℓ ′ such that τℓ > t and τℓ′ < t with Q ℓ < ℓ. The probability of this event is g((∆ρ Rℓ )/t) Rℓ′ 1, while a complete characterisation of the new universality class for n < 1 remains an interesting open question. We thank D. Dhar for useful comments on the manuscript. K.J. acknowledges partial support from the Kanwal Rekhi scholarship administered by the TIFR Endowment Fund.
[1] [2] [3] [4]
1
(8)
100
100
1000
10000 100000 t
0.1 0
2
4
6
8
10
∆ mn+2/tn+1 1
1-F (∆ m, t)
F (∆m, t) ≈ 1 − exp(−bn y n+2 ) ,
(b) n=5/4, ρ=4
0.1
0
0.2
0.4
0.6 ∆m
0.8
1
1.2
1.4
n+2 n+1
/t
FIG. 2: Scaling collapse of the cumulative distribution in Eq.(8) for (a) n=1/3 (b) n=5/4 at t=104 (△), 2 × 10⁴ (�), 4 × 10⁴ (+) and 8 × 10⁴ (×) in the condensate phase. The data are obtained from the two slowest sites in 150 disorder configurations, using c = 1/2. The broken line is a guide to the eye. The inset shows the temporal growth of average mass as a power law with exponent β given in the text.
[5] C. Godr`eche, cond-mat/0301156; S. Großkinsky, G. M. Sch¨ utz and H. Spohn, cond-mat/0302079. [6] L. Bertini et al., J. Stat. Phys. 107, 635 (2002). [7] Y. Kafri et al., Phys. Rev. Lett. 89, 035702 (2002). [8] E. K. O. Hell´en and J. Krug, Phys. Rev. E 66, 011304 (2002). [9] M. R. Evans, Europhys. Lett. 36, 13 (1996). [10] G. F. Newell, Opns. Res. 7, 589 (1959). [11] J. Krug, Brazilian J. Phys. 30, 97 (2000) and references therein. [12] This choice of rates implies an attractive on-site interaction since particle hopout rates are lower than those for noninteracting particles. [13] J. M. Luttinger and H. K. Sy, Phys. Rev. A 7, 701 (1973). [14] M. J. Lighthill and G. B. Whitham, Proc. Roy. Soc. A 229, 281 (1955). [15] G. Tripathy and M. Barma, Phys. Rev. Lett. 78, 3039 (1997).
5 [16] M. Kardar, G. Parisi, and Y.-C. Zhang, Phys. Rev. Lett. 56, 889 (1986).