JOURNAL OF GEOPHYSICAL
RESEARCH, VOL. 105, NO. C4, PAGES 8629-8646, APRIL 15, 2000
Dynamics of mixed bottom boundary layers and its implications for diapycnal transport in a stratified, natural
water
basin
M. Gloor,1 A. Wiiest, and D. M. Imboden SwissFederalInstitute for EnvironmentalScienceand Technology(EAWAG), Dfibendorf
Abstract.
Here we report on two field experimentsfrom Lake Alpnach (surface
area: 4.8 km2;maximumdepth:34 m) that weredesigned to studythe process of boundary mixing and to estimate its efficiency,the ratio between the turbulent kinetic energyconvertedinto potential energyand dissipatedinto heat, for diapycnal tracer transport. Lake Alpnach is particularly suited for this purpose becauseit is knownfrom earlier experimentsthat (1) its currentsfollow a regular oscillatory pattern, associatedwith basin-widestandinginternal waves(seiches,period •0.5
daysand I day,respectively),and (2) diapycnaltracer transportis mainly causedby boundary mixing. During one of the experimentsreported here, strong seicheswere excited regularly and damped on a timescaleof the order of 3 days; during the other experiment seichingmotion was comparablyweak. If seichingis excited regularly, we find a persistent well-mixed bottom layer of 4-5 m height at the deepestpart of the lake. In the absenceof regular seichingthe layer disappearswithin 10-20 days. On the slopingbottom boundariesthe well-mixed layers (1) are of much
moretransientnature, (2)exhibit differentthermalstructure,and (3) decreasein thicknesstoward shallower'•depth inverselyproportionallyto the stability at the same depth in the lake interior. Their reduced thickness is possibly the result of repeatedly occurringintrusionsof boundary mixed water massesthat are observed to extend horizontally •0100-200 m into the lake interior. As a consequenceof repeated generationof intrusions,mixing on the slopingboundariesis expectedto be considerablymore efficient comparedto mixing over fiat bottom boundaries. The observedmixing efficiency,the ratio of the rate of changeof potential energy below depth z causedby turbulence to the energy loss by bottom friction below depth z, increasesindeed from 0.01 q- 0.01 in the deepest well-mixed layers to 0.15 q- 0.04 in the upper pycnocline.
1.
et al., 1994; Sherman and Davis, 1995; Ledwell et al.,
Introduction
1993] and (2) indirect, global methodsbasedon the In stratified, natural water bodies the magnitude of penetrationof anthropogenic tracerslike •4C into the
vertical transport of quantities like heat, dissolvedinorganic carbon, and nutrients is critical for an understandingof the system. Two types of methodsusedin the past to determine the vertical diffusivity of stratified
oceans and on simulations
with ocean circulation
mod-
els[e.g., Toggweiler et al., 1989;ShafferandSarmiento, 1995].The verticaldiffusivities of the oceandetermined by these two methods, however,differ by approximately
water bodiesmay be distinguished:(1) directmethods, an order of magnitude. This discrepancyis not yet fully based either on measurements
of turbulence
with small-
understood.
scaleresolvingshear or temperature probesor the close
Mixing at the bottom boundaries of the ocean has
monitoringof locally releasedtracerslike SF6 [Toole been postulated by several authors to be the expla-
nation for this discrepancy. Consequently,in the past many theoretical and experimental studies of natural, •Now at Max-Planck Institut fiir Biogeochemie, Jena, stratified water bodies have concentrated on the nearGermany. bottomoceanicregions[Broeckeret al., 1968; Wirebush Copyright2000 by theAmericanGeophysical union. Papernumber1999JC900303. 0148-0227/00/1999JC900303509.00
and Munk, 1970; Sarmiento et al., 1976; Heathershaw, 1976; Caldwell, 1978; Weatherly and Wirebush, 1980; Lueck et al., 1983; Gust and Sourhard, 1983; Elliott, 1984; Dewey and Crawford,1988; Lentz and Trowbridge, 8629
8630
GLOOR ET AL.: BOUNDARY
LAYER DYNAMICS
AND DIAPYCNAL
TRANSPORT
1991]. Armi [1978],for example,foundsteplikestruc- lake's pycnocline. Gradient Richardsonnumbersfor se-
tures with fairly homogeneous temperatureof •0 50 m iche oscillationsof the observedintensity are too small vertical extent near seamounts. He interpreted these to permit the occurrence of Kelvin-Helmholtz instabil-
ities [Miinnichet al., 1992]. Furthermore,the summer slopingbottomboundariesand subsequently weread- resonancephenomenon described below insures seiche structures as water masses that first had been mixed at
vected into the oceaninterior. He proposeda model for oscillationsstay in phase with the diurnal wind forcing vertical diffusion in the ocean based on this mechanism. and thus largely prevents the generationof turbulence This model,however,was disputedby Garrett [1979], by out of phase wind forcing. The regular excitation of the 1H2V mode with a pewho arguedthat boundarymixingtakesplacein wellmixed water and therefore is inefficient. His argument riod of the order of a day was first observedand anis based on observationsof the density structure in the alyzedin great detail by Miinnich et al. [1992]. A deepoceanovera fiat (i.e., horizontal)bottom bound- schematicof this oscillatory mode is displayedin Figure ary that almostalwaysshowa well-mixedbottomlayer 1. Its regular excitation is due to a resonant interplay with respectto temperatureand salinity, with typical of the diurnal wind forcing, the lake geometry, and the mean summer stratification. The most notable feature heights of 50-100 m. Temperatureprofilesmeasuredover slopingbottom of this mode is the 180ø phase difference between the boundaries [ Wunsch, 1972;Caldwell,1978;Armi, 1978; vertical motion of the isopycnalsurface that separates water from intermediate water and Thorpe,1987, 1990]revealadditionallythat the mixed above-thermocline layersthere are muchthinnerthan thoseobservedover the isopycnalsurface that separatesintermediate water
fiat bottoms and that they exhibit much more spatially from bottom water. This oscillatory motion contrasts, variable and temporally intermittent structures;well- for example, with the more familiar first horizontal first mixed bottom layersare found next to well-stratifiedverticalseichemode 1HIV (Figure 1). The importance of boundary mixing for diapycnal bottom zones. These measurements, however, lack enoughadditional information, such as bottom cur- transport in Lake Alpnach was observedwith two methrents, to establishconclusive relationshipsbetweenob- ods: First, three tracer studies from three different servedmixedlayerdynamicsand large-scalefeaturesof years[Goudsmitet al., 1997]wereusedto distinguish the flow. Furthermore, they are insufficientto prove betweendiapycnalmixing of the interior (excludingthe the hypothesisthat boundarymixing contributessig- near bottom boundaryregion)and mixingof the entire water body. Goudsmit et al. monitored carefully the nificantly to vertical transport in the oceaninterior. Microstructureprofilesover a slopingbottom in the vertical and horizontal spread of a pointlike injection of oceanare rare, and the resultsare controversial.Over uranin in (1) the stratified deepwatersof the lake and a seamount in the northeast Pacific, temperature and (2) the boundary layer of the lake. The experiments shear microstructure data measured by Toole et al.
[1994]showdissipation ratesthat areenhanced relative to the oceaninterior. In contrast,Luecket al. [1983] did not find higherenergydissipationoverthe continental slopeoffVancouverIsland. The process of mixingat a slopingbottomboundaryis not yet well understood, and consequently, its contributionto vertical mixing in the permanentlystratifiedoceaninterior is unclear. Comparedto the ocean,enclosedwater bodieslike lakes allow the study of the phenomenology and dynamicsof mixed layerson a fiat as well as on a sloping bottom boundaryunder much more controlledconditions. It is, in particular, much easierto balancequantities like heat. For this reasonseveralexperimentshave been undertaken since 1989 in Lake Alpnach to study the role of boundary mixing in overall vertical trans-
nion
•,
•
•
;•
_/' Metalimnion
•
Hypolimnion
b)
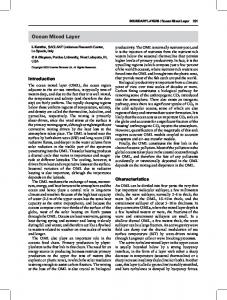
port [Miinnichet al., 1992;Glooret al., 1994; Wiiest et al., 1996;Goudsmitet al., 1997].Theseexperiments revealed two further characteristics of Lake Alpnach Figure 1. (a) First horizontalfirst verticalseichemode that are favorable for the purpose of studying bound- (1HIV). The arrowsindicatethe directionof flow. Durary mixing.First, LakeAlpnachsustainsmarkedlyreg- ing summerin Lake Alpnachthe period of this mode is
ularinternalbasin-wide oscillations (internalseiches); typically-•8-12hours.(b) Firsthorizontal second ver-
typically theso-called second vertical firsthorizontal tical seiche mode (1H2V). Anintermediate layer outof three layers is squeezedback and forth. During summer (1H2V) modeis excited. Second,boundarymixingis the period of this mode (which is persistentlypresent knownto be the main agentfor diapycnaltransportand during summer) is typically -•1 day. Adapted from
thedissipation of turbulent kinetic energy below the Miinnich etal. [1992].
GLOOR ET AL.: BOUNDARY 46059 '
,
:•
46o58 '
;
area
4.80 km2
Total volume
0.10 km3
Maximum depth
34.0 m
Mean depth
21.6m
:
...... '"
'
,'
..... ..,.
•M1
400
!•;i' :" ::
ß /
;
ß ; " ,'
/
,,"
;'
'" ß,/ ,,''"
,-"'" Chli
Schliere
8o17 '
.-";
*672 &A94,,"...... ..
,...• ,;
,,"" ,..,,'"Melbach /
......
;....--/
•/,,J'
46o57 '
o ,, ,,,,
M3
B94 -•Aln u
.,'
keAlpnach
M2 O
,øø'
1003'
434
-
:
I
:
--,.,..,,.'" ""\
""" 'ø""" ø"
8631
,." B•rgenstock..--""
Lake Lucern
... '"
TRANSPORT
/
""
,,;, i; ",,, , ., ', ,;
AND DIAPYCNAL
I
Lake Alpnach Surface
LAYER DYNAMICS
,,.'" --
.Sarner Aa '"ø' 8ø18'
I
,"' /
,'" i 8ø19'
/
•I 1I
8020 '
.0.6 [m2s2/5 o] 8o21 ,
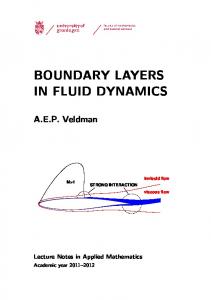
Longitude Figure 2. Map of LakeAlpnach,a basinof Lake Lucerne(Central Switzerland). Depth contours, lake height, and the height of the shelteringmountainsare given in meters abovesea level. The inset showsthe cumulateddistributionof wind velocitysquared(proportionalto surfacestress) and wind direction (wind flowing to) near A94 measuredin July 1989. The position of the thermistor string mooringsare indicatedwith A93 and B93 (1993) and A94 and B94 (1994). During both campaignsa current meter was installed abovethe lake bottom at A93 and A94. M1-M4 indicate the fixed positions of measurementof profiles of temperature microstructure.
Adaptedfrom Miinnichet al. [1992].
showan increaseof the horizontallyaveragedvertical lossdue to dissipativeprocesses, is unknown. (We call rate of spreadof the tracer patch by about an order of the potential energyof the water body "static potenmagnitudeafter contactingthe slopingbottom bound- tial energy" in the followingto distinguishit from the ary, if the original releasewas into the stratified deep available potential energy stored in displacedisopycnal waters. If the tracer was releasedwithin the boundary surfacesfrom the equilibrium position that is associated layer, the opposite tendency was observed:the horizon- with seichemotion.) In order to addressthese questionswe performed two tally averagedvertical spreadwaslarge in the beginning
and sloweddownlater on (this last experimentwasper- further experimentsin Lake Alpnach(Figure2) during formedduring the samemeasurementperiod in summer autumn 1993 and summer 1994. The strategy of these 1994 that we discussin this paper). Second,temper- experimentswasto measureboth globalquantities(like ature microstructure measurementsfrom yet another the potential energy of seichesor the heat budget of the
experimentin Lake Alpnachduring1989 [WEestet al., basin)and local quantities(like the structureand dy1996]revealeddrasticallyenhancedturbulencenext to namicsof mixedlayers)and, subsequently, combinethe the bottom boundary.
observationsin order to obtain a consistentview of the
Both types of experiment demonstratevery clearly effectof bottom boundarymixingfor basin-widediapycthat diapycnaltransportof heat or dissolvedsubstances nal transport. Specificissuesthat we addressare (1) the in the stratifiedwater body of Lake Alpnachis primar- determinationof the seicheenergybudget,the rate of ily causedby boundarymixing. Nevertheless, the exact changeof the static potentialenergyof the water body,
mechanism of boundarymixingand its communicationand the mixingefficiencyof boundarymixing;(2) the to the lakeinterioris unclear.Also,the efficiency of this quantification of the temporaland spatialstructureand process, the ratio betweenthe rate of increase of the po- dynamicsof mixed layerson a slopingand a fiat bottentialenergyof the waterbodyandthe seiche energy tom boundary; and (3) the connection of the dynamics
8632
GLOOR ET AL.: BOUNDARY
LAYER DYNAMICS
of mixed layers on sloping bottom boundarieswith the basin-wide diapycnal transport rate.
AND DIAPYCNAL
TRANSPORT
where B - -g(•-oø))(mS--1)isthebuoyancy accel•o
erationand A(z) is the cross-sectional area of the lake
During one of the measurementperiods(the exper- at depth z. We disregardedhorizontal advectionin esiment of summer 1994) the highfrequencypart of the tablishingthe secondequality becausewe consideronly temperature microstructure was distorted. For this rea- the potential energy changeof the water body averaged son the discussionof this period in this paper is to a certain extent based on the premise that boundary mixing was the main dissipationmechanismfor seiches as in all earlier experiments. We, nevertheless,verify
over severalseicheperiods. We also restrict ourselvesto depthswhere heating by the absorptionof sunlight can oB + Ow,B, be neglected.In this case•o• = 0 holdsß The
of a seichedamping model that is exclusivelybased on boundary friction.
is knownto be --•0.1W m-2). The firsttermin (2) ac-
last equalityin (2) followsfrom an integrationby parts this premisewith (1) a roughseicheenergybalanceand and the assumptionthat mass flux through the sedi(2) the comparisonof observations with the predictions ment boundaryis negligible(the geothermalheat flux countsfor changesin static potential energycausedby
a massflux into or out of the volumeV(z) throughthe
1.1. Seiche Energy, Buoyancy Flux, and Static Potential Energy
upper boundary. The secondterm accountsfor changes causedby internal redistribution of massby turbulence Seiches are characterized by the periodic displace- and is independentof the referencelevel. For a comparment of isopycnal surfacesfrom their equilibrium po- ison of the conversionof turbulent kinetic energy into sition because of the internal redistribution of water heat versus potential energy this secondterm is relemassesby oscillatingcurrents(Figure 1). These dis- vant. Using the eddy flux parameterization placed isopycnalsstore potential energy analogouslyto OB the availablepotential energy stored by a baroclinically stratified atmosphere. Similarly to the atmosphere,this
w'B'- -K••zz(Wkg-1),
(3)
seichepotentialenergyis approximatelygivenby [e.g., for the vertical buoyancyflux due to turbulence,we may Oort et al., 1989] write the rate of changeof static potential energyof the water column due to turbulence
pOSC _
dt - •o/v w'B'dv - /v COoK•N• 2dv (W). ;7stat (•) (•)
'•pot
(1)
where V is the lake volume, • is the actual density, z
is the verticalcoordinate(positiveupward),• = •(z)
isthereference density profile, N• - -(•o)( o•) isthe
as
•
(4) An area-averagededdy diffusivity Kz for massand heat at z in a closed water basin in turn can be determined
stability of the water body associatedwith the refer- from a heat balanceof the water massbelowz [Powell ence density profile, •0 is a fixed density value, dv is and Jassby,1974]by an infinitesimal volume element, and 5z is the displacement of an isopycnalfrom its equilibrium depth and is K•(z)- _a atfv(•)cpcoTdv ß approximately given by (s)
-A(z)cpe
V(z) belowz and with respectto the referencelevelz•
It is again assumedthat heat fluxes through the lake bottom boundary are negligible and that there are no interior sourcesof heat. Note that the levelsof dissipation in lakes are so small that they need not be taken into account.Accordingto (4) the rate of changeof the static potential energy of the water body due to turbulence within the water body is equal to the volume integral of the buoyancyflux. The area-averagedbuoyancy flux (equation (3)) in turn is accessible via the heat budgetof the lake (equation(5)) and the stability
is
of the water
[o(x, u, Currents
(m).
associated with internal
seiches lead to shear
in the interior of the water body as well as at the sediment boundary. Such shear flow may become unstable and turbulent. •rbulent kinetic energy in turn is partially dissipated into heat and partially converted into static potential energy of the water body. The rate of changeof static potential energywithin the lake volume
-afv(•) dt
-
-
fv(•)
OB(2)
column.
1.2. A Seiche Damping Model We formulate next a seichedamping model that as-
=cOo fv(z)(z-zr) Ow'B' Ozdv (w), (•)
sumes(1) that seichekinetic energyper bottom area ½kinis lost exclusivelyby dissipative processesnext to
the bottom boundaryof the lake (we designatequantities expressedper area by small letters throughoutthis paper) and (2) that theselossesmay be parameterized
GLOOR ET AL'
BOUNDARY
LAYER DYNAMICS
AND DIAPYCNAL
TRANSPORT
8633
roughly via a bottom friction coefficientch and the absolute value of the current
u at a distance
bottom boundary dakin dt
=-clu(h)l
seichesare equal when averagedover a large number of seicheperiods. Under this assumptionthe time average of the kinetic energy integrated over the box's depth is equal to the time averageof the seichepotential energy (6) integrated over the box's depth, and hence
h from the
(Wm-2).
_ D_føD
For a bottom friction coefficientwe use a recently mea-
suredvaluefromLakeBaikalof Clm=2.3•:0.3'10-s (T.
uh,t)
Ravenset al., submittedmanuscript,1999). This value
'
o
•
uh,t)
(m).
(S)
is based on a 2 year near-bottom velocity record and is Combiningequations(7) and (8), our model predicts the only value in the literature measured in lakes known a near-bottom velocity decline after a sudden windto us.
induced seicheexcitation according to
For the horizontalcurrentsu(x,z,t) we use the internal seichesolution for a two-dimensionalrectangular box multiplied by a time-dependent amplitude
I - u(h,O) I = 3• 8(• )t(ms-) 1--1 u(h,t)sin(wt) . (9) Here t =
X)sin(wt) (ms- 1), u(x,z,t) --u(z,t)sin(7r• where x is the coordinate in the horizontal direction, L is the length of the box, and cois the angular frequency
of the seicheoscillation(the waveequationin stratified fluidsis discussed by Gill [1982]). Neglectingthe slope of the bottom boundary for Lake Alpnach is justified becausethe sedimentboundaryslopesvery gently (see section3). Under our assumptionsthe rate of change of kinetic energy per unit width of the lake is
0 is taken
as the time
of occurrence
of the
first maximal displacement of the isopycnalsafter the excitation of the seiche. We may hence read off the basin average drag coefficient from the slope of a plot of the horizontal velocity after a strongseicheexcitation against time. Besidesan estimate of a drag coefficient per se this analysis provides us with a consistencytest of our assumption that energy lossesnext to the bottom boundary are mainly responsiblefor the damping of seiches.A drag coefficientof much larger magnitude
than is usuallyobserved (Clm • 2- 3 x 10-s) would indicate that other mechanisms
than near-bottom
tur-
bulenceare dominating the seichedamping process. d-• d//foL1 O •Pu2(z' t)sina(•r•)sina(wt)dxdz x -
-c••0 L•u•(h,t)sin•(•)sin X 3(•t)dx(Wm-1),
1.3. Mixed Layer Theories
1.3.1. Dynamic model for mixed layer height whereu(h, t) is the absolutevalueof the horizontalbot- over a fiat bottom. We now develop a model for tom current measured within a distance h from the botgrowth and decay of mixed layers over a fiat bottom, tom boundaryat a fixed site (e.g., near the deepestpart similarto thoseof Lentzand Trowbridge [1991]or Polof the lake (A93 and A94, Figure 2)). lard et al. [1973]. The potentialenergydifferencefor Using the identity mixing a stratified fluid up to height hmix-]-dhmixcompared to height hmix is
foLsin s(• •)dx 8 fo sin
1
depot --- ]-•oN2[(hmix -]-dhmix) s__hmix] s
we may rearrange the model equation to
--•[sin2 (wt)f_ø Du•(z,t)dz)] dt
sin•(•t)u•(h,t)
=
16 3•
•hmixdhmix • •__ •I •oN! (Jm-•), (7)
where½pot ispotentialenergyperunitareaoftheentire
water column, 9 is density, hmixthe long-term mixed Equation (7) would be readily integrableif we could boundary layer height. We assumethat the sole enreplace føDu•(z,t)dz with•u2(z,h),where • isan ergysourcefor mixedlayergrowthis the kineticenergy equivalentdepth that takes the variation of the mag- lossof the adjacentcurrent by bottom friction. Asnitude of the horizontal velocity over the vertical wa- sumingthat a fraction ffmixof the energylossis conter columninto account(because(7) then would be verted to potential energy,the gain of potential energy
s. In addition,we assume that the decay oftheform•3ax2- -2a(1/x) - const withthesolu-is "/mixch•lul dt
tion
--
dt
of the mixed layer is due to vertical diffusion:that is, 1 1 -ß(t) •(o) ---const t). Tocalculate D properly,
we would have to solve the wave equation for internal wavesfor the specificlake geometry of Lake Alpnach.
dhmix Kz,I (ms-l). dt hmix
Guided by the data that are availableto us (this concernscontinuouslymonitored temperature profilesand Combiningthese two processesof growth and decay near bottom currents) we pursuehere a different ap- leads to the followingmodel equation for the mixed proach. We assumethat potential and kinetic energyof layer over a fiat bottom'
8634
GLOOR
ET AL.:
BOUNDARY
LAYER
DYNAMICS
both
AND
river
DIAPYCNAL
and Lake
TRANSPORT
Lucerne
water
masses.
The
bot-
dhmix __47mixCalUl • Kz,• (ms_•) (10)tom slope increasessteadily along the main lake axis dt • x ' N I• hmi hmix
from ~0 ø at station M1 to ~1.5 ø at station M4 (Figure 2). From numerousdiveswe knowthat the bottom
1.3.2.
Intrusion
theory.
Finally, we introduce
boundary of the lake is covered with sediment and is smooth.
part of Barenblatt's[1978]theoryon collapsing instabil-
The directionof external wind forcingis stronglyinfluencedby the surroundingmountains. A plot of the body and a locally isolated mixing event leading to a wind stressdistribution measuredduring a previousexlenslikestructureof homogenizeddensityand thickness perimentin July 1989 (Figure 2) indicatesthat the pre•(x,y,t). The lens is assumedto be symmetricwith vailingwindsare from east/northeast.The wind shows respectto a horizontal plane. The homogenizeddensity a remarkably regular diurnal pattern due to mountain profile within the lens is accompanied by a horizontal and valley breezes. As a result of this diurnal forcing pressureexcesswith respect to the adjacent stratified during summer, the first horizontal secondvertical inwater of ternal seicheoscillation 1H2V, whose period for a typical summer stratification is ,,1 day, is often excited ities in a stratified
fluid.
We consider a stratified
water
1 • 2- z2] (Nm p- •N2[(•) -2),
[Miinnichet al., 1992].
where z is the distance from the symmetry plane of the lens. The pressureexcessis largest at the center of the
The measurementsduring autumn 1993 and summer 1994 consistedof the following.
lens(z -0) and vanishesat its upperand loweredges.
Temperatureprofiles(Aanderaathermistorchains, samplinginterval 5 min) werecontinuously recorded near the deepestpart of the lake (A93 and A94, Figure 2) in order to determinethe vertical diffusivityfor heat accordingto the heat budget method[Powelland Jassby,1974](equation(5)) and the height of the benthic mixed layer near the deepestpart of the lake and in betweenthe deepestpart of the lakeand the upperwest/southwest endof LakeAlpnach(B93 and B94, Figure2) in
The pressuregradient force acting on a vertical cross
section of the lenseis V(p() (N m-•). Thedeformation of the lense due to this pressuregradient force eventually equilibrates with the shear stressexerted by the surroundingfluid on its boundary,whichby dimensional
analysis,is proportionalto yule, whereu is the intrusion velocity of the lense. For flow betweentwo parallel planes the constant of proportionality is 12. Equating the pressuregradient force and the shearstressexerted on the lens by the ambient fluid yields the following expressionfor the intrusion velocity
u- •(
-1). )•'aV•' (ms
(11)
order to calculate the available potential energy stored in seiches. o
2. Lake Alpnach and Experimental Setup The two experimentsin Lake Alpnach that we analyze in this paper were performed from October 10 until November 10, 1993, and from May 26 until July 21, 1994. Lake Alpnach is situated in central Switzerland and is the smallestbasin of Lake Lucerne (Figure 2). It is approximatelybox-shaped,with ~5 km
Currents(Neil Brown EG&G acousticcurrentmeter) near the bottom boundary at the deepest part of the lake (A93 and A94, Figure2, distance to sediment3.9 (1993) and 1.4 m (1994),respectively; samplinginterval 5 min) werecontinuously recorded in order to record the absolute value and
oscillation of the current due to seiches and to de-
termine the loss of kinetic energy of the current due to bottom ,
friction.
lengthand~ 1.5km width(surface area4.76km•'), and
Measurements were made of ~300 temperature microstructure profiles(SeabirdSBE-9) during each experimentparalleledby locally recorded
has a maximum depth of ~34 m. The density strat-
current
measurements
moored
next
to the mi-
ification is strong during summer(maximum stability
crostructure temperature measuring sites. The
N • ~ 3 x 10⁻³ s-•) and only weaklyaffectedby dis-
profilerwasequippedwith an FP07 fastresponse
solved solids(gfias< 8 x 10⁻⁶ s-• where$ is salinity
thermistorwith a nominalresponsetime of 7 x 10- 3
1a_a[(gkg-•)-•]). Themajorriver (g kg-•) andfi- •as
s anda resolution of 10-4 K. Beforethe temper-
input (SarnerAa, Figure2) duringsummerconsistsof
ature signalwas digitalized,the high frequencies
warm epilimnetic water from another lake, and consequently, the river water mergesinto the surface layer
were approximately linearly preemphasized.This
have negligibledischargesexcept during occasionalrain events. Since Lake Alpnach is separatedby a 3 m deep sill from the rest of Lake Lucerne, the density-stratified
methodallowsus to suppress largelynoiseintroducedby digitizationat the high-frequency end of the spectrum.It effectivelyenhances the spatial resolutionof the sondeif thereare highfrequenciescontainedin the signal. For a more de-
part (hypolimnion)of Lake Alpnachis decoupledfrom
tailed discussion of the characteristics of the tem-
(epilimnion)of Lake Alpnach. Two minor tributaries
GLOOR
ET AL.'
BOUNDARY
LAYER
DYNAMICS
AND
[2000].Forprofilingthe sondewasreleased slightly from where it was allowed
to sink freely down to a distance of 8 cm from the sediment. The sinking speed was adjusted to -•0.1 m s-• with fioatation attached to the sonde.
About 10 profiles were measuredfor each station
that wasvisitedalongthe main lakeaxis(with the exceptionof October 14, 1993, when all profiles weremeasurednear the deepestpart of the lake). In autumn 1993, measurementstations along the main lake axis were chosenarbitrarily; in summer
1994 the locationsof four stationsM1-M4 (Figure 2) were fixed. To fix the stationswe moored a buoy, and to locate our ship we used a Global
TRANSPORT
8635
could use the profilesfrom 1994 only for the first purpose. The high-frequencyportion of the profilesfrom the year 1993 were uncontaminated,but sinceseicheswere only weakly excited during this period, the distribution of turbulence with depth is unrepresentativefor the period of 1994 during which seichingmotion was strongand on which we base most of our analysis. We hence decided not to present any profilesof dissipationof turbulent kinetic energy, even though the profiles of 1993 were in good agreementwith the findingsduring earlier experiments that turbulence is confined to the bottom boundary zone.
perature microstructure sonde, see Kocsis et al. above the thermocline
DIAPYCNAL
3.
Observations
PositioningSystem(GPS) and radar. We intended to use the highly resolvedtempera-
3.1.
Seiche
Excitation
We first look at the near-bottom current along the ture profilesto (1) resolvethe near-bottomtemperaturestructurein sufficientdetail and (2) esti- main lake axis at the deepestpart of the lake (A93 and mate dissipationrates of turbulent kinetic energy A94, Figure 2) and the displacements of two isotherms by fitting Batchelor's[1959]model spectrumto from their meandepth(Figure3 and Figure4). The disspectraof turbulent patches[Grant et al., 1968]. placementsof isothermswere determined from linearly Becausethe high-frequencypart of turbulent do- interpolated,detrendedthermistor chain temper_ature
mains was contaminated with the frequency of
profiles bylinearization 5z -[T(z, t)- •(z , t)]/oT •zz (see
the power systemof the measurementship, we section2.1). These clearly confirm earlier observations
a 5
E • oE
O'--'
Oct 10
Oct 20
Oct 30
Nov 11
Nov 21
_
Oct 10
Oct 20
Oct 30
Date
Nov 11
Nov 21
1993
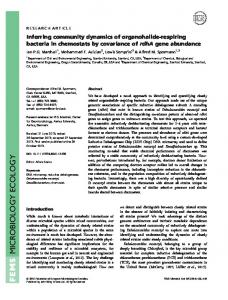
Figure 3. (a) Componentof currentalongthe main lake axisduringautumn 1993,3.9 m above the bottom boundaryat A93, next to the deepestpart of the lake (Figure 2). Flow directedto east/northeastis positive.The dayson whichmicrostructure profilesweremeasuredare shaded. (b) Displacement of isotherms fromtwoselected depths(17.5(left scale)and25.5m (rightscale)) determinedfrom thermistordata at station A93 (Figure 2) duringautumn 1993.
8636
GLOOR
•
ET AL.-
BOUNDARY
LAYER
DYNAMICS
AND
DIAPYCNAL
TRANSPORT
5
0
-5
May 26
June 15
June 5
I
June 25
I
July 5
i
I
July 15
July 25
i
1
ß
o -1
o
-2[
, 19.3m ,
May 26
June5
,
June 15
july 5
June 25
July 15
july 25
Date 1994
Figure 4. As in Figure 3 but for the experimentin summer1994 (site A94, Figure 2).
The
current is measured at 1.4 m above the bottom boundary.
that the motion of hypolimnetic water massesare dominated by the excitation of internal seiches.Comparing isotherm motion and bottom velocity during both periods of measurement, it is evident that the internal seiche excitation was generally stronger in summer 1994. During summer 1994 the secondvertical seichemode, characterizedby upper and lower isothermsoscillating out of phase, was almost always excited, and the corre-
the vertically integrated buoyancy flux per area below
11, 13, and 15 m depth at A94 (equation2). The
most
notable
feature
of these data
records
is
We next considerthe observationsof the energy content in seiches,the rate of changeof the static potential energy of the water body, and the energy loss by dissipation processesnext to the bottom boundary as
the bunchesof strong seicheexcitation of severaldays length. The decay scale of these strong seicheexcitations is of the order of -•2-3 days and is paralleled by periodsof strongincreaseof the static potentialenergy of the water body. The phasesof strong seichemotion are most likely causedby comparablystrongwind forcing. Another striking feature of the data recordsin Figure 5 is the very good correlation betweenthe rate of changeof the static potential energyof the water column causedby turbulenceand the lossof seicheenergy by bottom friction. The partitioning betweenthe gain of static potential energyand seicheenergydissipation is hence always approximately constant over the entire
introduced
measurement period.
lation
between
isotherm
motion
and the bottom
current
was almost perfect. On the other hand, during autumn 1993, there is no clear seichemode characterizing the internal
wave field.
in section 2. Note that
our observations
are
In summary, the observations indicate that whereas point measurementsor profiles. We hencedisplay these recordsor quantities derived from them by area. Fig- the diurnal rhythm of the wind is responsiblefor the ure 5a showsthe availablepotential energystored in the regular, dayly excitation of the second vertical seiche displacementof isopycnalsfrom their equilibrium posi- mode, strong excitations on a synoptic timescale are tion becauseof seichingmotion (1); Figure5b showsthe likely causedby stronger wind events or particularly smoothedlossof mechanicalenergyper area due to bot- favorableresonanceconditions. Strong oscillationsare tom friction losses determined from the near-bottom ve- damped over a timescale of a few days by loss of enlocity at A94 (Figure 2, using(6)) and Figure5c shows ergy either due to bottom friction or dissipationwithin
GLOOR
ET AL.-
BOUNDARY
LAYER
DYNAMICS
AND
DIAPYCNAL
TRANSPORT
8637
30
0
c o
o
0.18
i
I
E
o
03
0
x
._.:•o.o5 c
i
I
i
i
o
rn
0
May 26
June 5
June 15
June 25 Date 1994
July7
July 15
July 25
Figure 5. (a) Availablepotential energyof seichingduring summer1994 determinedfrom the thermistordata at site B94 (Figure 2). (b) Smoothedenergylossdue to bottom friction near the deepestpart of the lake determinedfrom currentvelocitymeasuredat A94 (Figure 2) 1.4 m abovethe bottom. (c) Rate of changeof the static potentialenergy(integratedbuoyancyflux) below 11 (upper curve), 13, and 15 m (lowercurve) depth determinedfrom thermistordata at A94 (Figure 2).
the lake interior. The resulting turbulent mixing causes similar bunchesof rates of changeof the static potential energy of the water body and diapycnal fluxes of physical quantities like heat that are nonuniformly dis-
rate of turbulentkineticenergy[Batchelor,1959]). The
bottom row showsthe temperature gradient, which is a measure of the activity of turbulence because overturning eddiescausetemperature gradient signalsthat tributed over the water column. are symmetrical with respect to zero. Unsymmetrical temperature gradient signals,in contrast, merely indicate changesin the slope of temperature profiles. We 3.2. Mixed Layer generally display one temperature profile at a time in 3.2.1. Flat bottom near the deepest part of Figure 6 with the exceptionof October 14, 1993, where the lake. Depending on the strength of seiches,the we display four temperature profiles, offset by 0.07 K, near-bottom temperature structure next to the deep- that were collected within 7 hours. est part of the lake varies strongly. These variations The profiles on October 14, 1993, were measured are exemplifiedin Figure 6 for two completely differ- shortlyafter a strongseicheexcitation(Figure 3). Subent regimes: (1) mixed layer decayduring a phaseof sequently, the bottom boundary layers were relatively weak turbulence(left and middle) and (2) mixed layer wellmixed over a height of severalmeters (Figure 6 buildup as a result of intensebottom boundary mixing (left)). The temperaturegradientsignal (bottom) is (right). The temperatureprofilesare presentedin three comparably small, suggestingthat there is almost no differentways. The top row showsthe contrastbetween active turbulence. The thickness of the well-mixed the temperaturestructure next to the bottom boundary layers at October 14 is varying within a few hours and the overlying water body. The middle row shows solelybecauseof the (reversible)redistributionof wathe degreeof temperature homogenizationwithin the ter massesby internal seichingmotion. During the folbottom boundary layer and the smallest length scales lowing weeks, internal seicheoscillation almost ceased of temperature variations. The smallest length scales (Figure 3) and the well-mixedlayersfaded away. This are a measure of the intensity of turbulence because is well documentedin the profilefrom November5 (Figthey scalein inverseproportion to a fourth of the dis- ure 6 (middle)). The observedtimescaleof the decay sipationrate of turbulent kinetic energy(the Batchelor of the well-mixed layers at the deepestpart of the lake scale ls - (W-) yn•1/4, wherey is the molecularviscosity, accordinglyis 10-20 days (time duration from October n is the molecular diffusivity of heat, e is the dissipation 14 to November5). Note the asymmetricsignatureof
8638
GLOOR ET AL.: BOUNDARY LAYER DYNAMICS AND DIAPYCNAL TRANSPORT
Oct. 14, 1993
Nov. 5, 1993
June 2, 1994
•' 26
26
26
• 30
30
3O
5.6
r[øC]
6.2
5.6
T[oC] 6.o 5.6 r[oC]
•,28
28
28
• 30
3O
3O
32
32
32 5.71
r[øC]
5.74
5.6
T[øC]
5.9 5.658 r[oC]
,•28 E
28
28
*' 30
3O
3O
32
-1
32
dT/dz[øC m -•
1
-1
6.0
5.662
32
dT/dz[øC m -•]
1
-1
dT/dz[øC m -]
1
Figure 6. Temperature (top),temperature microstructure (middle)andtemperature gradient profiles (bottom)nearthe deepest partof the lakefrom3 daysof themeasurement campaign duringautumn1993(weakforcing)andI dayof measurement duringsummer1994(strong
forcing).
the temperature gradient signal with respect to zero, 3.2.2. Sloping bottom boundary. To document confirming that there is no turbulence. On June 2, the near-bottom temperature structure of temperature 1994, in sharp contrast to the profiles from autumn profilesovera slopingbottom boundary,we displaypro1993, there is a well-establishednear-bottom current, files from 4 days of measurementduring summer1994 and there is strongturbulence(Figure6 (bottom)). In (Figure 8). Note that the profilesare displayedoffthis casethere is a well-mixedboundarylayer with very set from each other in the same chronologicalorder small internal temperature differencesof the order of as they were observedand that the profiles displayed AT10-3 øC. were measured within a period of 1-2 hours from an Accordingto theseobservations,bottom currentsare anchored ship. For this reason we are sure that the clearlymechanicallyforcingthe build up of mixed layers spatial distance between subsequentprofiles does not near the deepestpart of the lake, whereastheir decay exceedseveraltenths of meters. The temperature prois attributable to vertical diffusion. A rough estimate files near to the lake slopegenerallyexhibit muchmore • x/2K• of a mixedlayerwith internal structurethan thoseobservednext to the deepfor the decaytime t ,, hmi height hmix "" 4 m due to a vertical diffusivity Kz est part of the lake (Figure 6). Furthermore,there are 3 x 10⁻⁶ m2s-z (Figure12) yieldst ,, 30 days,in good comparably thick mixed layers next to small ones. On June 23, 1994, for example, the first profile reveals a agreement with the observations. The long-term trend of the mixed layer thicknessde- well-mixed layer of 2 m height, while the secondproterminedfrom the thermistorchainrecordat A94 (Fig- file almostlacksa mixed layer. Well-mixedlayersover ure 1) and its time derivative(the growthrate) shows a slopingbottom boundary hence occur spatially and that periods of growth are correlated with severalday temporally much more intermittently than the quasilong periodsof enhancedbottom currentsand large en- stationary mixed layer next to the deepestpart of the ergy loss due to bottom friction. Short-term fluctua- lake. Histogramsof the thicknessof mixedlayers(Figure9) tions of bottom friction during summer 1994, reflecting the seichingmotion, do not alter the mixed layer height indicate clearly that the layers becomethinner with decreasingdepth. Furthermore, the sample distributions (Figure 7a).
GLOOR
ET AL-
BOUNDARY
LAYER
DYNAMICS
AND
DIAPYCNAL
TRANSPORT
8639
0.2 -0.2
o
May 26
June 5
June 15
June 25 Date 1994
July 5
July 15
July 25
Figure 7. Dynamicsof the mixed layer near the deepestpart of Lake Alpnachduringsummer 1994. (a) Observedmixedlayerheight(fastlyvaryingcurve)and a two-parameter fitted curve of the mixedlayer growthmodelof (10) (slowlyvaryingcurve). (b) Time derivativeof the long
termtrendof the observed mixedlayerheight.(c) Energylossdueto bottomfrictionch•lul3 determinedfrom velocitymeasurements 1.4 m abovethe lake bottom at A94 (Figure 1) based on a frictioncoefficient of c•m = 2.3 x 10⁻³. For smoothingwe generallyuseda second-order Butterworth filter with a cutoff period of 5 days.
at small depth are skewedto small values, while those over the fiat bottom boundary at the deepest part of the lake are more or lessnormal. Skewed,lognormalas opposedto normal, sample distributions are characteristic for turbulent mixing events in the stratified water
mixed steplike structuresof •-1 m height in temperature profilesnearby to the slopingbottom boundary that extendedinto the lake interior. As an example of this phenomenon,temperature profiles that have been measuredwithin •-2 hours at a fixed position over the columnof the openocean[Gregg,1987]. The differentslopingbottom are shownin Figure 11. A steplikestrucsample distributions of mixed layer thicknessesfor fiat ture at •-20 m depth may be distinguished. To test if and sloping bottom boundariesmay be a reflection of this structure belongsto a singlewater mass,the prothe quasi-stationary versusintermittent nature of these files are overlaidin Figures 11c and 11d. The agreelayers. mentfor the first three profiles(Figure11c) is excellent From the distributions of the six depth bins we de- and still reasonablygoodfor all profilestogether(Figtermined average layer thicknessesand plotted them ure 11d). A characteristicof these steplikestructures against the inverse of the mean stability of the lake is the strong temperature gradient signalsjust at their within the respectivedepth bin. Mean heightsof mixed upper and lower edgesand the absenceof strong gralayers increaselinearly with the inverseof the horizon- dients within the well-mixedzone (Figure 11d). It is tal averagestabilityof the lake (Figure 10) with the ex- hence tempting to interprete these steps as intrusions ceptionof the two shallowest positions(smallest1/N 2 into the lake interior of originallywell-mixedboundary values)in autumn 1993. Sinceduringautumn 1993the layer water, the strongtemperaturegradient signalsat seichemotion is generally weak, at shallow depth the the edgesbeing causedby the shearingmotion between relatively large stability is probably strong enough to the intrusion and the surroundinglake water. Note also suppressthe establishmentof mixed layers altogether. the absenceof large gradientsinside the mixed layers, Besideswell-mixedbottom layers directly over the which indicate the absence of turbulence there. Such slopingbottomboundarywe regularlyobserved well- steplike structuresare confinedto the near-slopezone:
8640
GLOOR
ET AL.'
BOUNDARY
LAYER
DYNAMICS
AND
,•
TRANSPORT
June 23, 1994, M3
June 15, 1994, M3 20
DIAPYCNAL
18
,
2O
22
22
24
26
28
i
6
i
6
6.5
' 6
June 27, 1994, M3
' 6.5
' 7
July 4, 1994, M4 13
16
14
18
15
E 20
16
• 22
17
24
18 19
26 6
6.5
7
7.5
Temperature [øC]
' 7
' 8
' 9
Temperature [øC]
Figure8. Mixedlayerovera sloping bottom boundary: Temperature microstrucure profiles measured on June15, 23, and27 andJuly4, 1994,at stations M3 andM4, respectively. The
temperature profiles fromJune15and23areoffset against each otherby0.7øC,andthose from June27andJuly4 areoffsetby 0.4øC.Thehorizontal distance between neighboring profiles is smaller than several tenths of meters.
deep within the hypolimnionof the lake, they are never which is similar in magnitude to the estimate basedon the thermistor chain record at B94, from the velocity measurementsalong the lake slope that paralleled the 4. Results measurementof the microstructure temperature profiles observed.
with mean horizontal velocities of 2.2 and 2.3 cm s-1 at
4.1.
Energy Considerations
M3 and M4 (compared to 2.7 cm s-1 at M1; the mean
Our data indicate that the decreaseof seichepotential of the bottom current recorded by the sondeanchored energyafter a strongseicheexcitation is approximately at A94 during the entire measurementperiod is 2.0 cm
balancedby the energylossdue to bottom friction. For s-1), from earliermeasurements documented in Gloor example for the period from June 3 to June 6, 1994, et al. [1994],and from model simulations[Miinnich, the differencein the peak values of available potential 1996]. Applyingthe seichedampingmodel (9) to the obserenergyis -•20 J m-2 and the entireenergylossdueto /,June6 bottom friction(JJune3 Cl.4'"t)lu(t)[ 3dt)is -•23Jm-2, vations, we arrive at a similar conclusion. According while for the period from June 25 to June 28 the dif- to this model the inverse of the velocity maxima after ferencein seichepotentialenergyis -•27 J m-2 and a strong, isolated seicheexcitation increaseslinearly in the energylossdueto bottomfrictionis -•25 J m-•. time, and the slope is determined by the bottom drag We assumehere again that seichepotential and seiche coefficientand the length scaleD - 22 m (determined kinetic energy share the total seicheenergy to equal from (8) using the velocity record and the thermistor parts and extrapolate c• from 1 to 1.4 m assuminga data at the site B94). For the only isolated excitaconstant stresslayer extending up to 1.4 m from the tion event during both experiments, which occurredat bottom boundary. We also assumethat we may extrap- the beginning of the measurementperiod in autumn olate the locally measuredvalues over the entire lake. 1993 (Figure 3), the inverseof the velocitymaxima inSupport for this assumptioncomesfor the seichepo- creasedlinearly (not shown),and a straight line fitted tential energyfrom the thermistorchainrecordat A94, to the record results in a bottom drag coefficientof
8641
GLOOR ET AL ß BOUNDARY LAYER DYNAMICS AND DIAPYCNAL TRANSPORT
Autumn
1993
8
30
,
2.5
72
N=22
0
1
2.5
- 2.5
2 0
i
N:85
0
2 0
N=82
0
1
2 0
1
0
2 0
N-35
N=25
1
2
2
N:34
o
5
o
5
0
N=65
N=19
N-33
0
5
0
2 0
,,
2
o
1
N=24
1994
Summer
o
2.5
18-21 rnI 21-24m 24-27m 27-30m 30-33m
15-18m
o
5
5
Figure9. Histograms ofmixed layer thickness withincreasing depth fromleft(15-18 m)to right(30-33 m)forautumn 1993 andsummer 1994 (thedepth increment is3m;N isnumber of profiles). From theprofiles ofautumn 1993 those ofOctober 14have been excluded since they fallintoa period ofmuch stronger seiche excitation compared totherestoftheprofiles ofthis year;fromthoseofsummer 1994all profiles havebeenused.
i
!
i
i
,
_
'*
o
o
1993
*
1994
I
CO
1
2 1/N2 [104S 2]
3
4
Figure10.Mean thickness ofmixed layers determined fromthe12ensembles inFigure 9versus the inverseof the meanstabilityN 2 at the respective depth.
8642
GLOOR
ET AL.'
BOUNDARY
LAYER
DYNAMICS
AND DIAPYCNAL
TRANSPORT
5
20 25
6
8
10
12
14
16
-3 0 -3 0 -3 0 -3 0 -3 0
dT/dz [øCm"]
T[øC]
lO
15 2o 25
6
8
lO
12
14
16
6
8
lO
T[øC]
12
14
16
T[øC]
Figure 11. (a) Temperatureprofilesmeasured at stationM3 on June6, 1994,offsetby IøC. (b) Gradientof temperature profilesfromFigure11a,offsetby 10øCm -1. (c) Firstthreetemperature profilesfrom Figure 11a overlaid. (d) All temperatureprofilesfrom Figure 11a overlaid.
½3.9m"'" 3.0 x 10⁻³. This is in fair agreementwith the measurement periodof the stabilityN2(z) andthe the drag coefficient½1rn • 2.3 :• 0.3 measuredin Lake verticalturbulent diffusivityKz(z). Thesewe derived Baikal given the approximate nature of our model and from the thermistorchainrecordsat A94 (Figure2). the larger distance of the velocity sondeof 3.9 m from The verticalprofileof the fractionf(z), displayedin the bottom boundary during the measurementperiod Figure 12, increasesfrom small values of the order of in 1993. If we assumed a constant stress bottom bound0.01 + 0.01 up to 0.15 + 0.04 at 16 m depth, which is as ary layer, for example,we would have to multiply c3.9m largeas valuesfoundin the laboratoryfor mixingin the by approximately a factor 0.8 to obtain Clm- The de- interiorof a stratifiedmedium[IveyandNokes,1989]. creaseof seicheenergyin time after a strongexcitation The valuesare considerablylarger than expectedfrom and the realistic value of the bottom drag coefficient Garrett's[1979]argumentthat mixingof alreadywellare hence consistent with the hypothesis that bottom mixed layers is very inefficient. The low value near the friction lossis its main energy sink. deepestpart of the lake,on the otherhand, is consistent Our observationsbrought together showthat seiches with his argument. are the mediator from wind energy to dissipativeprocessesnext to the lake bottom boundary, which in turn, 4.2. Mixed Bottom Boundary Layers causediapycnal transport in the deep part of Lake Alp4.2.1. Flat bottom boundary. We apply now nach. These conditionspermit us to determine the frac- the model for growth and decayof well-mixedlayers tion f of seicheenergy convertedinto static potential overthe fiat bottom boundary(10) to the data record energy to the energy dissipatedinto heat by the bound- measurednear the deepestpart of the lake duringsumary mixing process: mer 1994 (Figure 7). A least squaresfit with respect d ]•,•stat
f(z)-
•pot
,•, (z)
fA(z) c•øuad. f
ß
4•mixCl 4m
to thetwofreeparameters ofthismodel, N2' and ß
(12)Kz,/is
,
I
shownin Figure 7a. The low-pass-filterednear-
bottomvelocities(Figure4b) measuredat A94 (Figure 2) wereusedasthe forcingcurrent.The modelcaptures where df = d•dy is an infinitesimal surfaceelement. To the time dependence of the mixed layer height fairly 2.6 determinef(z), we use (4) and •he mean profilesover well, andthetwofitted parameters are4•mixCl.4m N• ____
GLOOR ET AL ß BOUNDARY LAYER DYNAMICS AND DIAPYCNAL TRANSPORT
0 15
0.1
K_ [cm2s-] (o) Z
,
II
,
,
0.3 ,
8643
0.4 ,
I / /
./
I
20 I I
,•
I
t-
I
/ /
/ ß
.I:
25
30
0
0.05
0.1
0.15
0.2
(dE/dt) Pøt/ (dE/dt)botfric [-] (x) star Figure 12. Vertical diffusivity (upperscale)andratiobetween seiche energy converted into staticpotential energy of the water column and seiche energy dissipated into heat by bottom • •,stat
friction processes, '----to, (lower scale) ofdepth(timemeans dt (z)/fA(z) cnolul3df ' asa function overthe entireperiodin 1994).
s2 andKz,I -- 0.15cm2s -1. For a typicalstabil- theory. For Kz = 3 x 10⁻⁶ m2S--1 (Figure12) and ity of the watercolumnjust abovethe mixedlayer • = 1 m we arriveat a decaytime of t -• 0.5 days(the heat that has to be transported into the step at its upN• - 4 x 10⁻⁵ s-2 (seeFigure7) theresulting mixr•/2 OTzdz-- gcp 1 •OT•2, ing efficiency is ?mix•- 0.01,in verygoodagreementper edge is U -- jo cp•-• anu -_, • the resulting and the heat flux is Q -cpcoKz•-, hence with the previously estimatedratio betweenthe rate 1•2/K z (Cpis heatcapacity, ( is ist -• • -• õ of change of the staticpotentialenergyto the seiche timescale energydissipated intoheatby bottomfriction.
stepheight,and• isdensity)).We chose thevalueofthe
4.2.2. Sloping bottom boundaries. Next we verticaldiffusivitythat is derivedfrom the heat balance want to checkif the frequentlyobservedmixed layers and that is abovethe level of pure moleculardiffusion thetemperature gradiextending horizontally fromthe bottomboundaryinto (n -• 1.4x 10-* m2S--1)because
the lakeinterior(Figure11) arecompatible with their entsat the upper and loweredgesof the layer in Figure interpretation asintrusions dueto gravitational collapse11b indicate that the flow there is not fully laminar. is of the orderof halfthe period of intermittentlymixedboundarywater. We first esti- The resultingtimescale of the second vertical seiche mode. For V• - 0.1-0.01, matethe decaytime of suchstructuresand then coman eddy viscosity v •_ Kz = 3 x 10⁻⁶ m2S--1(itsvalue parethehorizontal extension ofthemwiththedistance is expected to be of approximately thesamemagnitude traveled by intrusions according to Barenblatt's [1978]
8644
GLOOR
ET AL.'
BOUNDARY
LAYER
DYNAMICS
as the eddy diffusivity of heat for not completely lam-
inar flow),and N • - 0.5 x 10⁻⁴ s-•' (meanvalueat 22m depth)theintrusion velocities are-•0.2-2cms-1. For an intermediate value of -•1 cm s-1 these intrusions would reach within 0.5 days a distance of -•300
m. This length scaleagreeswell with the observations' The profilesin Figure 12 weremeasuredwithin a radius •_75 m, and in one of the profilesthe steplikestructure is situated directly at the bottom boundary.
Barenblatt's[1978]theory (equation11) predictsan increase of the intrusion velocity proportional to the stability in the interior of the stratified water body, whereasit is inverselyproportional to the eddy viscosity. In this picture the stability plays a twofold role. First, a larger stability suppressesthe growth of the mixed layer. Second,once a mixed layer has been established, a larger stability causesit to intrude faster into the interior.
Finally, we estimate the build up time of mixed layers on a slopingbottom boundary in order to test if periodic buildup and subsequentintrusion during half a seicheperiodis possible.Integrating(10) by neglect-
ing the diffusive term, for N •' -• 5 x 10⁻⁴ S-2, u -• 3 cm S-1, "Ymix -- 0.1 (fromFigure12), and hmix-- i m,
AND
DIAPYCNAL
TRANSPORT
5. Summary and Conclusions We discussedin this paper two experiments that at.tempted to characterizethe processof boundary mixing on a fiat and a sloping bottom boundary in a natural, stratified water body, to relate the observedmixedlayer dynamics to global budgets of heat and energy, and to estimate the efficiency of the processof boundary mixing. During the two experimentspresentedhere the intensityof seichemotion differsstrongly. There is comparably weak seichemotion during autumn 1993, while there are strong pulsesof seicheexcitation during summer 1994. These strong seicheexcitations decay on a timescale of -•2-3 days. The decay of the seiche energy after strong excitations correlates very well with episodesof large diapycnal heat fluxes and strong increaserates of static potential energy of the water body in the deep parts of the lake. A seicheenergybalance and the agreementof the predictionsof a seichedamping model that is based solely on bottom friction losses with observations,furthermore, are consistentwith the findings of earlier experiments that identified the bottom boundary as main sink of seicheenergy. We may hence estimate the ratio between seicheenergy convertedinto static potential energy of the water body below depth z and the seicheenergy that is converted into heat by bottom friction below depth z by the boundary mixing process.We find a strongincrease of this ratio with increasingheight from the maximum lake depth from -•0.01 4- 0.01 next to the deepest part of the lake to -•0.15 •- 0.04 just below the thermocline. We next observethat the characteristicsof mixed layers over a fiat bottom boundary next to the deepest part of the lake are very different from those over a sloping bottom boundary. If seichemotion is strongly excited, then next to the deepest part of the lake, a
we arrive at a timescale of t -• 3 hours, which indeed is smaller than half a period of the secondvertical seiche mode. The build up timescalesfor the observationsof this processagreefairly well with this estimate. The agreementof these qualitative argumentswith the observationsindicate that the dynamics of mixed layersovera slopingbottom boundaryare very different from those over the fiat bottom near the deepestpart of the lake. Accordingto this interpretation, mixed layers are built up intermittently during acceleratingphases of seiche oscillations. This claim is supported by the skewedsample distributions of well-mixed layer thick- quasi-stationary well-mixed layer(AT .• 10-• øC)with nessesover a slopingbottom (Figure 9), the spatially 4-5 m height is gradually built up. The height of the strongly variable occurrenceof well-mixed layers, and mixed layer increasesif there is sufficientlystrong forcthe build up time for typical mixed layers(usuallyless ing by near-bottom currents and decaysotherwiseover than a quarter of the period of the seicheoscillations). a timescaleof 10-20 days. A simple model based on an During the subsequentdeceleratingphase of the se- energy balance captures the observedtime dependence iche motion suchwell-mixed layers collapsegravitation- of the mixed layer height near the deepestpart of the ally and are thereby squeezedout into the lake interior lake fairly well and predictsa very low mixingefficiency and finally decaydiffusivelybeforethe next accelerating of -•0.01 there, in goodagreementwith the valuedeterphase of seiche oscillation. Support for this proposed mined from the ratio of the rate of changeof the static mechanism comes from the steps in the temperature potential energy of the water body to the lossof seiche profilesnear the slopingbottom boundary and their ab- potential energy by bottom friction losses. sencein the interior of the hypolimnion, in agreement The observedmean height of mixed layersover the with
the estimate
of the diffusive time
and horizon-
tal length scaleof intrusionsaccordingto Barenblatt's [1978]theory;the identicaltemperatureof suchstepsin profilesmeasurednear each other, which suggeststhat thesestepsbelongto sheets;the large temperature gradients at the upper and lower edgesof suchsheetsand the small temperature gradientswithin them; and the inverseproportionality of the mean bottom boundary mixedlayerheightto the ambientstability(Figure10).
lake'sslope,on the other hand, decreases stronglywith increasingheight above maximum lake depth. Furthermore the appearanceand disappearanceof mixed layers overthe lake slopesare of a distinctlydifferent,strongly intermittent nature. An estimate of the build up time of such layers of the order of 1-3 hours is also consistent
with theseobservations.In additionnext to the sloping bottom boundary,we repeatedlyfind mixed layersthat extend horizontally severaltenths to a few hundredsof
GLOOR
ET AL.: BOUNDARY
LAYER
DYNAMICS
AND DIAPYCNAL
TRANSPORT
8645
meters into the lake interior. A comparisonof the pre- Gregg,M. C., Diapycnalmixingin the thermocline: A review, J. Geophys. Res., 92, 5249-5286,1987. dictionof the intrusiontheoryof Barenblatt[1978]with observationssuggeststhat these layers might be intru- Gust, G., and J. B. Southard, Effects of weak bed load on the universal law of the wall, J. Geophys. Res., 88, sions of intermittently mixed boundary layer water. 5939-5952, 1983. The differentdynamicsof mixed layersover the deep- Heathershaw, A. D.• Measurements of turbulence in the est part of the lake and the lake slopeis consistentwith Irish Sea benthic boundary layer, in The Benthic Boundthe observedincreaseof the ratio betweenseicheenergy ary, edited by I. N. McCave, Plenum, New York, 1976. convertedinto static potential energy and the dissipa- Ivey, G. N., and R. I. Nokes, Vertical mixing due to the breaking of critical internal waveson slopingboundaries, tion of seicheenergyinto heat by the boundary mixing J. Fluid Mech., 20,{, 479-500, 1989. process. Mixing next to the deepest part of the lake, Kocsis,O. H., H. Prandke, A. Stips, and A. Wiiest, Comparwhere a quasi-stationary mixed layer persists, is ineifiison of dissipationof turbulent kinetic energy determined cient, while periodic generationof well-mixed layers on from shear and temperature microstructure, Journal of Marine Systems, 2000. the lake slope and their subsequentintrusion into the lake interior are much more eificient becauserepeat- Ledwell, J. R., A. J. Watson, and C. S. Law, Evidence for slow mixing acrossthe pycnoclinefrom an open-ocean edly restratifiedwater is mixed. Sincethe temperature tracer-releaseexperiment, Nature, $6,{, 701-703, 1993. structure on the ocean slopes are similar to the ones Lentz, S. J., and J. H. Trowbridge, The bottom boundobservedin Lake Alpnach, this processmight be of relary layer over the Northern California Shelf, J. Phys. evance for the oceans as well.
Oceanogr.,21, 1186-1201, 1991. Lueck, R. G., W. R. Crawford, and T. R. Osborn, Turbulent dissipationover the continental slopeoff vancouverisland, Acknowledgments. We thank M. Schurter, A. Lueck, J. Phys. Oceanogr.,13, 1809-1818, 1983. S. Bollhalder, M. Hofer, F. Peeters and M. Mfinnich for their gear help in the field and G. Piepke, P. Perisset, G. Mfinnich, M., The influenceof bottom topographyon internal seichesin stratified media, Dyn. Atmos. Oceans,23, Mohler, R. Berger, and R. StSckli for their excellent techni257-266, 1996. cal support. The commentsfrom two anonymousreviewers helped to improvethe manuscript. This work was supported Mfinnich, M., A. Wfiest, and D. M. Imboden, Observation of the second vertical mode of the internal seiche in an by Swiss National Foundation grants 20-32700.91 and 2036364.92. alpine lake, Limnol. Oceanogr., 37, 1705-1719, 1992. Oort, A. H., S.C. Ascher, S. Levitus, and J.P. Peixoto, New estimates of the available potential energy in the world References ocean, J. Geophys.Res., 9,{, 3187-3200, 1989. Armi, L., Someevidencefor boundarymixing in the deep Pollard, R. T., P. B. Rhines, and R. O. Thompson, The deepening of the wind-mixed layer, Geophys. Fluid ocean, J. Geophys.Res., 83, 1971-1979, 1978. Dyn., 13, 381-404, 1973. Barenblatt, G.I., Dynamics of turbulent spots and intrusionsin a stably stratified fluid, Izvestiya, Arm. Oceanogr. Powell, T., and A. Jassby, The estimation of vertical diffusivities below the thermocline in lakes, Water Resour. Phys., 1•, 139-145, 1978. Res., 10, 191-198, 1974. Batchelor,G. K., Small-scalevariation of convectedquantities like temperature in turbulent fluid, J. Fluid Mech., 5, Sarmiento, J. L., H. W. Feely, W. S. Moore, A. E. Bainbridge, and W. S. Broecker, The relationship between 113-133, 1959. vertical eddy diffusionand buoyancy gradient in the deep Broecker,W. S., J. Cromwell, and Y. H. Li, Rates of vertisea, Earth Planet. Sci. Left., 32, 357-370, 1976. cal eddy diffusion near the ocean floor based on measurements of the distribution of excessRn-222, Earth Planet. Shaffer, G., and J. L. Sarmiento, Biogeochemicalcycling in the global ocean, 1, A new, analytical model with conSci. Left., 5, 101-105, 1968. tinuous vertical resolution and high-latitude dynamics, J. Caldwell,D. R., Variability of the bottom mixed layer on Geophys. Res., 100, 2659-2672, 1995. the Oregonshelf, Deep Sea Res., 25, 1235-1243, 1978. Dewey, R. K., and W. R. Crawford, Bottom stressestimates Sherman, J. T., and R. E. Davis, Observations of temperature microstructure in NATRE, J. Phys. Oceanogr.,25, from vertical dissipation rate profiles on the continental 1913-1929, 1995. shelf, J. Phys. Oceanogr.,18, 1167-1177, 1988. Elliott, A. J., Measurements of the turbulencein an abyssal Thorpe, S. A., Current and temperature variability on the continental slope, Philos. Trans. R. Soc. London, Set. boundarylayer, J. Phys. Oceanogr.,1,{, 1779-1786, 1984. B, 323, 471-517, 1987. Garrett, C., Comment on "Some evidencefor boundary mixing in the deepocean" by LaurenceArmi, J. Geophys. Toggweiler, J. R., K. Dixon, and K. Bryan, Simulations of Radiocarbon in a Coarse-ResolutionWorld Ocean Model, Res., 8,{, 5095, 1979. 2, Distribution of bomb-producedcarbon 14, J. Geophys. Gill, A. E., Atmosphere-OceanDynamics, Academic, San Res., 9,{, 8243-8264, 1989. Diego, Calif.,, 1982. Gloor, M., A. Wfiest, and M. Mfinnich, Benthic bound- Toole, J. M., K. L. Polzin, and R. W. Schmitt, Estimates of diapycnal mixing in the abyssal ocean, Science, ary mixing and resuspensioninducedby internal seiches, 1120-1123, 1994. Hydrobiologia,28,{, 59-68, 1994. Goudsmit,G., F. Peeters,M. Gloor, and A. Wiiest, Bound- Weatherly, G. L., and W. Wimbush, Near-bottom speed and temperature observationson the Blake-Bahama outer ary versusinternal diapycnal mixing in stratified natural ridge, J. Geophys.Res., 85, 3971-3981, 1980. waters, J. Geophys.Res., 102, 27,903-27,914, 1997. Grant, H. L., B. A. Hughes,W. M. Vogel, and A. Moilliet, Wimbush, M., and W. Munk, The benthic boundary layer, in The Sea, edited by C. Maxwell, pp. 731-758, WileyThe spectrum of temperature fluctuations in turbulent Interscience, New York, 1970. flow, J. Fluid Mech., $,{, 423-442, 1968.
8646
GLOOR ET AL.: BOUNDARY LAYER DYNAMICS AND DIAPYCNAL TRANSPORT
Wfiest, A., D.C. van Senden,J. Iraberger,G. Piepke,and
D.M.
Imboden and A. Wfiest, Swiss Federal Insti-
M. Gloor,Comparison of diapycnal diffusivity measuredtute forEnvironmental Science andTechnology (EAWAG),
bytracer andmicrostructure techniques, Dyn.Atmos. •eberlandstr. 133,CH-8600 Dfibendorf, Switzerland (iraOceans, 2d,350-367, 1996.
[email protected];
[email protected].)
Wunsch, C., Temperature microstructure on the Bermuda
slopewith applicationto the meanflow, Tellus,•, 350367, 1972.
M. Gloor, Max-Planck-Institutfiir Biogeochemie, Post-
fach100164,D-07701Jena,Germany.(manuel.gloor@bgc(Received May13,1998; revised October 29,1999; jena.mpg.de.)
accepted November1O, 1999.)