IEEE TRANSACTIONS ON EDUCATION, VOL. 49, NO. 4, NOVEMBER 2006
451
e-Learning in Project Management Using Simulation Models: A Case Study Based on the Replication of an Experiment Daniel Rodríguez, Member, IEEE, Miguel Ángel Sicilia, Juan José Cuadrado-Gallego, and Dietmar Pfahl
Abstract—Current e-learning systems are increasing their importance in higher education. However, the state of the art of e-learning applications, besides the state of the practice, does not achieve the level of interactivity that current learning theories advocate. In this paper, the possibility of enhancing e-learning systems to achieve deep learning has been studied by replicating an experiment in which students had to learn basic software engineering principles. One group learned these principles using a static approach, while the other group learned the same principles using a system-dynamics-based approach, which provided interactivity and feedback. The results show that, quantitatively, the latter group achieved a better understanding of the principles; furthermore, qualitatively, they enjoyed the learning experience. Index Terms—Management education, simulation software, software engineering education, student experiments, system dynamics.
I. INTRODUCTION
E
-LEARNING systems have not only become the backbone in distance education but also are also at the heart of traditional university teaching. An ad hoc survey of reputable universities’ websites shows that all have online systems to support teaching activities. Initially, the Web was used as a repository to provide students with handouts, papers, etc., supporting one-way communication. Presently, e-learning systems have been extended with a series of general utilities, such as calendars, reminders, mailing lists, forums, homework drop-boxes, and even quizzes, to support continuous evaluation and facilitate asynchronous communication between students and between students and instructors. However, many current e-learning systems lack tools to provide synchronous feedback about the decisions that students take in the active process of learning, as required by modern learning theories. This paper presents and analyzes the results of the replication of a controlled experiment involving an e-learning system that uses system-dynamics-based (SD) simulation capabilities to facilitate a dialogue between the student and the computer. Bidirectional exchange is not achieved with most current e-learning Manuscript received April 13, 2005; revised June 26, 2006. The research was supported by the University of Reading and the Spanish Research Agency (CICYT TIN 2004-06689-C03—The INGESOFT Project). D. Rodríguez, M. Á. Sicilia, and J. J. Cuadrado-Gallego are with the Department of Computer Science, University of Alcalá, 28871 Alcalá de Henares, Madrid, Spain (e-mail:
[email protected];
[email protected];
[email protected]). D. Pfahl is with the University of Calgary, Schulich School of Engineering, Calgary, AB T2N 1N4, Canada. Color versions of Figs. 1–4 are available online at http://ieeexplore.ieee.org. Digital Object Identifier 10.1109/TE.2006.882367
systems. In the e-learning application under study, simulation capabilities are applied to learn certain software project management techniques. Project managers make decisions in complex work contexts, where many cause–effect relationships have to be taken into account. Therefore, future project managers should be trained so that they learn to exercise sufficient control over the development process to deliver products in time, within budget, and with the required quality. Although the potential of simulation models for the training of managers has long been recognized [1], very few experimental studies for software-project-management (PM) education have been performed. Pfahl et al. [2] performed a series of studies involving controlled experiments to evaluate the learning effectiveness of using a simulation model for educating computer science students in project management. The original study has been replicated at the University of Reading, Reading, U.K., as part of a software engineering course. In particular, the experiment fits as part of the Project Management section in the IEEE/ACM Computing Curriculum [3]. External replication of experiments is an important means to both verify and generalize original results. Furthermore, in this paper, the results and the design of the externally replicated experiment are discussed from the perspective of learning theory. The organization of the paper is as follows. Section II presents related work about learning theories, and the application of SD in the context of software engineering. Section III provides a discussion of the experimental design. Section IV presents the data analysis. Section V provides a discussion on possible threats to validity. Section VI provides a discussion of the results from a learning perspective. Finally, Section VII concludes the paper and outlines future research. II. RELATED WORK A. Current Learning Theories At present, available e-learning systems lack capabilities to create a dialogue between the students and the e-learning systems, i.e., immediate feedback about the decisions that students take in the active process of learning required by modern learning theories. E-learning systems have been used primarily to provide students with handouts or submission of practical work, achieving only a one way communication. This model of education, which considers the student as a passive receptacle of teaching, has its origins in the classical Greek philosophers Plato and Aristotle. Plato’s Theory of Forms [4] advocated that education should be reserved for the most capable. The ideal society would be divided into three classes: 1) the merchant
0018-9359/$20.00 © 2006 IEEE
452
class in charge of the economy, 2) the military class in charge of public security, and 3) philosopher-kings in charge of political leadership. A particular person’s class is determined by an educational process. Only those who complete the entire educational process become philosopher-kings and are able to grasp the Forms [4] and make the wisest decisions. Plato’s ideal educational system was primarily structured to produce philosopher-kings. Modern theories in higher education take under consideration that students have a clear opinion about their learning goals and, therefore, advocate that teaching should follow a student-centered approach [5]. In a student-centered approach, the teacher becomes a facilitator of learning instead of a dispenser of knowledge, and the students take responsibility for their own learning. In this way the teaching becomes more dynamic, following a trial-and-error approach—learning-by-doing. The benefit of this approach is that students can gain a deep approach to learning, enabling students to develop critical understanding [6] and active learning. In a deep approach to learning [7], the students understand the subject in a personally meaningful way, engaging their own experience and their previous knowledge in an interactive process with the relevant context, logic, and existing evidence of the subject. The Conversational Framework approach introduced by Laurillard advocates a dialogue between students and teachers to connect theory with practice [8]. A strong link between theory and practice facilitates deep learning. According to Laurillard, e-learning can support interaction by a) providing a presentation narrative when teaching conceptions are made; b) providing feedback to students; c) adapting information to the specific context of the teaching process; d) supporting learning processes so that students can discuss and reflect about their learning in a group setting; and e) providing learning media, where both teacher and student agree in developing presentations, etc. Mayes [9] classifies the degree of interactivity of online courses into three levels: 1) courseware that is used only to convey information, such as course handouts or reading lists; 2) systems that question students and encourage them to reflect on their learning (achieved by online quizzes, etc.); and 3) systems that establish a dialogue through online discussions or simulations. Kolb’s model of the Learning Cycle [10], [11] refers to the process by which individuals reflect upon their experience and, consequently, modify their behavior. The process consists of four stages: 1) experiencing consists of carrying out a task assigned, usually without reflecting on the task; 2) reflection consists on reviewing what has been done and experienced (personal paradigms and vocabulary influence how individuals attend and note differences); 3) conceptualization involves interpreting the events and understanding the relationships among them; and 4) planning allows for new understanding and making predictions about what can happen next or which actions should be taken to refine the way the task is handled. The logic of the Learning Cycle [10], [11] is to make incremental and continual improvements. However, a second-order change also exits. When assumptions and beliefs are outdated, the model itself should be questioned, looking for exceptions to the rule and challenging the dominant paradigm.
IEEE TRANSACTIONS ON EDUCATION, VOL. 49, NO. 4, NOVEMBER 2006
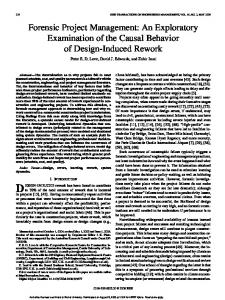
In this paper, an e-learning system is presented and analyzed that integrates simulation as a facilitator for achieving an interactive (“deep”) learning experience on a selected topic in software project management. B. System Dynamics in Software Engineering SD [12] is an approach to the modeling and simulation of systems. SD has been successfully applied in social, biological, and economical domains and, more recently, to the domain of software engineering (SE) [13]. SD uses causal loop structures to represent dynamic relationships between system parameters and emulates the effect of system structure on process behavior over time. The application of SD to the field of software development is based on the premise that many interacting factors throughout the software life cycle can have impact on the cost and schedule of a project and the quality of the product. To monitor and control software development projects, management experience and knowledge on how to balance the various influential factors are required. In educational applications, the complexity of SD models can be adequately hidden using ad hoc graphical interfaces similar to those used in the experiment presented below. For example, Fig. 1 shows how a student can put in software project requirements in the background. Then, based on these requirements, the SD simulator generates a dynamic project performance profile—work distribution over the different project phases in the foreground. In the context of SE education, apart from the SD-based Project Simulator mentioned above, only a few simulation-based, e-learning applications exist. Drappa and Ludewig [14] developed a simulation system, called SESAM. The behavior of the underlying simulation model is demonstrated by investigating and comparing different strategies for software development. Drappa and Ludewig also performed an experiment measuring the knowledge acquired during a training session by comparing a pretest completed before the treatment and a posttest after the treatment. Navarro and van der Hoek [15] argue that SE education typically lacks practical experience with software development processes. Students are presented with relevant process theory in lectures but have limited opportunity to put such concepts into practice in an associated large-scale class project. To resolve this problem, Navarro and van der Hoek developed SimSE, an educational, interactive, fully graphical computer game that simulates software engineering processes. SimSE has been designed specifically to train students in situations that require an understanding and handling of software process issues. III. DESCRIPTION OF THE EXPERIMENT The aim of the experiment presented in the following is to analyze whether a Web-based system, which uses SD-based software process simulation models at its core, can facilitate effective learning of selected software project, management topics for computer science students. The goal of the learning task is to understand the effects on project performance when applying some principles of software development, as stated by Boehm [16], [17]. Although most of such principles are gross generalizations, they adequately describe some fundamental
RODRÍGUEZ et al.: E-LEARNING IN PROJECT MANAGEMENT USING SIMULATION MODELS
453
Fig. 1. Input and output to/from the project simulator.
economic relationships governing conventional software processes (Table I). The Web-based e-learning system used in the experiment offers a scenario driven, interactive single-learner environment accessible through the Internet via standard Web browsers. In addition to facilitating learning, another goal of the experiment was to raise interest in the topic of software project management among computer science students and to make them aware of some of the difficulties associated with controlling the dynamic complexity of software projects. A. Experimental Design To evaluate the effectiveness of a training session using SD-based process simulation, participating students (referred to as subjects in the following) had to take a pretest and a posttest. Subjects were randomly assigned to an experimental group A and a control group B. Further details are provided in the next subsections. The pretest measures the performance of groups A and B before the treatment, while the posttest measures the performance of the two groups after the treatment. The effectiveness of the
training was assessed by comparing posttest to pretest scores (based on the number of correct answers) and by comparing the scores between subjects in the experimental group (those who used the SD model) and subjects in the control group (those who used a conventional project planning model instead of the SD model). In the study, the well-known COCOMO model [18], [19] was used by the control group. COCOMO is static cost-estimation model which is commonly used in many industrial software organizations. The training session can be described as a three-layered structure. The first layer defines the learning goal-Boehm’s project management principles (Table I). The second layer defines the type of project planning model used in the training session—the experimental or control treatment. Finally, the third layer defines the learning mode as another dimension to characterize the training session—inclusion or exclusion of a Web-based, interactive role play. The treatment is subdivided into four scenario blocks as described in the original experiment conducted at the University of Kaiserslautern, Kaiserslautern, Germany (the KL experiment) [19]:
454
IEEE TRANSACTIONS ON EDUCATION, VOL. 49, NO. 4, NOVEMBER 2006
TABLE I SOFTWARE ENGINEERING PRINCIPLES (ADOPTED FROM [16] AND [17])
— Block 1—PM Introduction: general introduction to project managers’ typical problems with regard to planning and control; — Block 2—PM Role Play: illustration of common project planning problems on the basis of an interactive case (this block contains the Web-based training module based using the SD-based simulation model and was only available to the experimental group); — Block 3—PM Planning Models: presentation of models that help project managers with planning tasks (the subjects in the experimental group receive an explanation of the SD-based simulation model, while the subjects in the control group receive an explanation of the COCOMO model); — Block 4—PM Application Examples: explanation on how to apply the PM Planning Models on the basis of examples that are presented in the form of little exercises that the subjects have to carry out. The effectiveness of the training was evaluated by comparing posttest to pretest scores (counting the number of correct answers) and by comparing the scores between subjects in the experimental group A and the control group B. B. Experimental Treatment The core element of the training delivered to the students in the experimental group is the SD-based, software process simulation model facilitated in the PM Role Play. The tertiary level of interaction and dialogue advocated by Mayes [9] to generate Kolb’s Learning Cycle is created by scenarios where the students need to reflect and make decisions to achieve their goals to complete successfully a software development project
without violating a given set of constraints. For example, Fig. 2 shows two Web pages offered during the PM Role Play block. The background page shows how a student can select one of Boehm’s principles. Assume that the student selected the ninth principle to reduce project duration. Then, the next page shown to the student gives the opportunity to implement the selected principle by adjusting related input parameters of the SD simulation model, to run a simulation, and to analyze the resulting effects on project duration, effort consumption, and product quality. The experimental group performs all scenario blocks. The SD model is also used as the predictive PM Planning Model in scenario blocks 3 and 4. In scenario block 2 (PM Role Play), the usage of the SD model is integrated into scenarios. Scenarios offer stories that help students understand the implications of Boehm’s principles. A role play is conducted in which the student takes the role of a project manager who has been assigned to a new development project. Several project constraints are imposed on the project manager—the size of the product (functionality), the maximal number of field defects per size unit (quality), the maximal project duration, the maximal number of available developers. Depending on the principles that students decided to apply in their role of project manager, various actions can be taken and subsequently additional options are provided by the system. Eventually, students always find a way to complete the assigned task successfully—finish the project within time, budget, and quality required. At the end of the role play, a short discussion of the different solutions is provided to the students. The role play is designed so that the students need to apply several development principles. Some combinations of principles yields success faster than others, depending on the set of project goals and constraints.
RODRÍGUEZ et al.: E-LEARNING IN PROJECT MANAGEMENT USING SIMULATION MODELS
455
Fig. 2. Selection of alternatives and the outcome of such alternatives.
C. Control Treatment The students in the control group have to use the original version of the COCOMO model [18]. The COCOMO model helps to predict the duration and effort necessary to complete a software project of certain size (functionality). The COCOMO model is composed of three submodels: a) basic COCOMO, b) intermediate COCOMO, and c) detailed COCOMO. The choice of the model depends on the level of knowledge that
users have about the project under estimation. In the basic model, also called nominal, only an estimate of the size is necessary. The Intermediate COCOMO model uses an Effort Adjustment Factor (EAF) to adjust the effort and schedule estimates to specific constraints that are already known at project start, a set of so-called cost driver attributes. The detailed COCOMO model uses different effort multipliers for each phase of a project. The phase-dependent effort multipliers yield better estimates than the Intermediate model.
456
The EAF used by the Intermediate COCOMO model can be used to estimate the effects on project effort and duration, depending on the set of development principles selected by students. The control group performs only scenario blocks 1, 3, and 4.
IEEE TRANSACTIONS ON EDUCATION, VOL. 49, NO. 4, NOVEMBER 2006
TABLE II PERSONAL CHARACTERISTICS
D. Subjects The replication study was conducted during a university term with 11 undergraduate students of the University of Reading. All participating students were taking the SE module (second-year undergraduate course). The SE module offered by the Department of Computer Science at the University of Reading consists of 20 lectures (one hour each), and the goal is to explain the principles of SE. The SE module covers the complete software development life cycle from requirements elicitation to maintenance, following the structure of the Software Engineering Body of Knowledge (SWEBOK) [20] and most textbooks on software development. When the experiment was conducted in Reading, more than 150 students were taking the SE module. The large number of students made it impossible to have practical work or laboratories associated with the lectures. As a result, most of the SE concepts taught could not be applied in practice and thus were difficult to understand by students. A few options exist to mitigate this problem: one is to provide as many examples as possible to students, for example, by selecting suitable books (for the SE module, Pfleeger’s book on Software Engineering [21] provided two extended examples throughout the whole book), and by providing additional literature on case studies that the students could read on their own time; another option is to facilitate an interactive Web-based e-learning system that helps students experience the implications of theoretical SE concepts through a role play that simulates typical software project behavior. The instructor invited students to participate in the experiment on a voluntary basis. From a total of 180 students, 30 responded positively, but only 11 turned up on the day of the experiment. The treatment was divided randomly among the students, solely based on which computer they selected. Table II summarizes personal characteristics of the subjects. E. Experimental Variables During the experiment, data for three types of variables are collected for judging the performance of the students: — one independent variable X.1; — four dependent variables Y.1, Y.2, Y.3, and Y.4; — three variables Z.1, Z.2, and Z.3, representing potentially disturbing factors. Each variable type is explained in the following subsections. 1) Independent Variables: The independent variable X.1 can have two values: , assigned to the experimental group A, and , assigned to the control group B. The difference between and is determined by the scenario blocks applied to the students and the associated PM Planning Model (Sections III-B and III-C). 2) Dependent Variables: The dependent variables Y.1, Y.2, Y.3, and Y.4 represent various aspects of interest and understanding to concepts in SE in general and software project planning in particular. The values of the dependent variables are determined by analyzing data collected through the pretest
and posttest questionnaires. Examples of questions contained in these questionnaires can be found in [2]. Below, only a brief characterization of each variable is provided. — Y.1—Interest in software project management issues (“Interest”): Questions assessing the personal interest in learning more about software project management. — Y.2—Knowledge about typical behavior patterns of projects (“Knowledge”): Questions about typical performance patterns of software projects based on empirical findings and lessons learned summarized by Boehm’s top 10 list of SE principles (Table I). — Y.3—Understanding of “simple” project dynamics (“Understand simple”): Questions on project planning problems that require simple application of the provided PM planning models, addressing trade-off effects between no more than two planning variables (project effort and duration, project effort and product quality, project duration, and product quality). — Y.4—Understanding of “complex” project dynamics (“Understand complex”): Questions on project planning problems addressing trade-off effects between more than two planning variables (project effort, project duration, and product quality), and questions on planning problems that may require replanning because of alterations of project constraints during project performance. 3) Disturbing Factors: The disturbing factors are defined as follows: — Z.1: personal characteristics (age, gender), university education, practical software development experience, software project management, literature background, and preferred learning style; — Z.2: actual time consumption per scenario block and perceived time need (in case the time provided was not sufficient); — Z.3: personal judgement of the training session.
RODRÍGUEZ et al.: E-LEARNING IN PROJECT MANAGEMENT USING SIMULATION MODELS
457
TABLE III TERMS AND DEFINITIONS OF THE HYPOTHESES
F. Experimental Hypotheses The two hypotheses of the experiment were stated as follows: 1) A positive learning effect exists in both groups A experimental group and B control group . Using the notations in Table III, this effect can be formulated as follows: score for — score — score
score
for
2) The learning effect in group A is higher than in group B, either with regard to the performance improvement between pretest and posttest (relative learning effect), or with regard to posttest performance (absolute learning effect). The absolute learning effect is of interest because it may indicate an upper bound of the possible correct answers depending on the type of training (A or B). This expectation can be formulated as follows: score for — score — score
score
for
The related null hypotheses were stated as follows. — : no difference is shown between pretest scores and posttest scores within group A and group B; score ; — score score for ; — score — : no difference is displayed in relative learning effectiveness between group A and group B; score for ; — score — : no difference is shown in absolute learning effectiveness between group A and group B; score for . — score G. Experimental Procedure In the replication of the experiment conducted in Reading, the same didactical intention and technical environment as in the original KL experiment were in place. However, the evaluation of the KL experiment suggested some modifications. Almost all participants of the KL experiment stated that they did not have enough time for working through the materials [2]. Therefore, more time was reserved for the treatment during the replication in Reading. Moreover, while the initial experiment was conducted on two days with one week of time in between, the Reading experiment was conducted on one single day.
Table IV shows the time in minutes spent on each activity of the experiment, comparing the original experiment (KL) to the replication (Reading). After a short introduction during which the purpose of the experiment and general organizational issues are explained, data on the background characteristics (Z.1) is collected. Then, the pretest is conducted, and data on all dependent variables (Y.1 to Y.4) is collected. Following the pretest, students are randomly assigned to either the experimental or the control group, and each group undergoes its treatment. In both experiments, six students were assigned to the experimental group and five to the control group. Both groups perform the posttest using the same set of questions as during the pretest, thus providing data on the dependent variables for the second time. Finally, the subjects evaluate the training session, providing data on variables Z.2 and Z.3. H. Data Collection Procedure The data collection procedure of the replicated experiment remained the same as in the original KL experiment. The raw data for Y.1 to Y.4 were collected during pretest and posttest with the help of questionnaires. Each answer in the questionnaire is mapped to range [0, 1] (“totally disagree” as 0, “disagree” as 0.25, “undecided” as 0.5, “agree” as 0.75, and “fully agree” as 1). The raw data for disturbing factors was collected before pretest (Z.1) and after posttest (Z.2 and Z.3). To determine the values of factor Z.1 (“Personal background”) information on gender, age, number of terms studied, subjects studied (major and minor), personal experience with software development, and number of books read about software project management was collected. The values for factor Z.2 are normalized average scores reflecting the time needed for reading and understanding of the scenario blocks 1, 3, and 4, for familiarization with the supporting tools, and for filling in the posttest questionnaire. The values for factor Z.3 (“Session evaluation”) are based on subjective measures reflecting the quality of the treatment. For the experimental group A, the variables and include also scores related to scenario block 2. I. Data Analysis Procedure As a first step of the statistical analysis, a t-test [22] was used to investigate the effect of the independent variable X.1 on the dependent variables Y.1 to Y.4. A very low number of subjects took part in the experiment; however, t-test is relatively strong to non-normality, and the outlier analysis showed that all data points lie within the range of standard deviations around
458
IEEE TRANSACTIONS ON EDUCATION, VOL. 49, NO. 4, NOVEMBER 2006
TABLE IV TIME DISTRIBUTION FOR VARIOUS STAGES DURING THE EXPERIMENTS
TABLE V SCORES OF DEPENDENT VARIABLES
the samples’ means. The power of a statistical test [23] is de, effect size [22], and the pendent on the significance level number of subjects. Low power has to be considered when interpreting nonsignificant results. A value of = 0.1 was decided since sample sizes were rather small in the initial experiment, and no sufficiently stable effect sizes from previous empirical studies were known. For this study, effects where 0.5 are considered to be of practical significance (based on the indexes proposed by Cohen [23]).
IV. EXPERIMENTAL RESULTS Table V shows the calculated values for mean, median, and standard deviation of the raw data collected during the Reading experiment for the pretest, posttest, and the difference scores. Table VI shows the calculated values for mean, median, and standard deviation of the raw data collected for the disturbing factors. Statistical analyses, using the data collected for disturbing factors, did not change any of the results achieved when using only the data collected for dependent variables Y.1 to
RODRÍGUEZ et al.: E-LEARNING IN PROJECT MANAGEMENT USING SIMULATION MODELS
459
TABLE VI SCORES OF DISTURBING FACTORS
TABLE VII RESULT FOR POSTTEST VERSUS PRETEST
TABLE VIII RESULT FOR PERFORMANCE IMPROVEMENT
TABLE IX RESULTS FOR POSTTEST PERFORMANCE
Y.4. Therefore, in the following discussion only statistical results based on data for Y.1 to Y.4 are presented and discussed. A. Hypothesis Table VII shows the results of testing hypothesis , using a one-way tailed paired t-test to compare the means of the preposttest scores within each group. Group A achieved significant results for dependent variables Y.2, Y.3, and Y.4, and group B for dependent variables Y.1 and Y.3. Therefore, the null hypothcan be rejected for these cases at . Note that esis for group A, the dependent variable Y.1 supports the direction of the hypothesis without showing an effect size of practical significance. In addition, for group B, values for dependent variables Y.2 and Y.4 also support the direction of the expected positive learning effect, with and without practical significance respectively. The analysis corroborates the result of the previous experiments in regard to the variables Y.2 and Y.3 for group A, and for Y.3 in group B. B. Hypothesis Table VIII shows the results of the testing hypothesis using a one-tailed t-test for independent samples. For signif, the score difference between posttest icance level
and pre-test for the dependent variables Y.2 and Y.4 are significantly larger in group A as compared to group B; thus, hycan be rejected for these variables. The values of pothesis Y.3 support the direction of the expected relative learning effect, showing a medium to large effect size (practical significance). The value for Y.1 does not even support the direction of the expected relative learning effect. C. Hypothesis Table IX shows the results of testing hypothesis using a one-tailed t-test for independent samples. For significance level , the posttest scores of variable Y.3 are significantly larger for the experimental group A as compared to the control group B, and thus hypothesis H0,2b can be rejected for this variable. The values of variables Y.2 and Y.4 also support the direction of the expected absolute learning effect, however, only with a small effect size. The values for variable Y.1 does do not even support the direction of the hypothesis.
460
IEEE TRANSACTIONS ON EDUCATION, VOL. 49, NO. 4, NOVEMBER 2006
TABLE X SUMMARY OF INDIVIDUAL RESULTS OF H
TABLE XI RESULTS OF H
D. Qualitative Results The participants reported problems encountered and made improvement suggestions. Besides suggestions regarding technical aspects of the tools, comments generally supported the findings of the quantitative analyses related to learning effectiveness and effect on interest in software project management. Positive comments about the usefulness of the treatments as a whole were made in both groups. Negative comments or problem statements addressed difficulties in understanding the amount of information (both groups) and the structure of the complex SD simulation model used by the experimental group. E. Meta-Analysis of the Experiments Table X shows the main results of the two experiments in regard to null hypotheses and . Meta-analysis techniques [24] are used for comparing and combining results from different studies to identify effects that could escape the scrutiny in a single study with much lower statistical power. To make a step in this direction and include both p-values and effect sizes in the discussion, the hypothesis testing results of each study were classified as follows. — Statistical significance (stat. sig.): Null hypothesis could . be rejected at significance level — Practical significance (pract. sig.): Null hypothesis could . not be rejected, but effect size : No practical significance could be ob— Positive effect served but effect size . The number in parentheses indicates how many subjects would have been needed to achieve statistical significance with the given effect size. . — No effect or negative effect (-): t-value
could only be reTable X shows that null hypothesis jected in all experiments for variable Y.3 (both for the experimental and the control groups). In addition, for the experimental could be rejected in all cases for Y.2 and in one group A, case for Y.1. For the control group B, could be rejected in two cases for Y.1. could only be reTable XI shows that null hypothesis jected in all cases for variables Y.2. A significant result was achieved in one case for variable Y.1. Regarding null hypothesis , statistical testing yielded statistically and practically significant results for variable Y.2. In the KL experiment, nothing indicates that the experimental group A performs better than the control group B with regard to understanding simple and complex project dynamics (variables Y.3 and Y.4). However, in the Reading experiment, a better performance for the experimental group was obtained for these variables. The role-play scenario explicitly states project management principles that were not clearly specified for the control group B. On the other hand, performing the role-play-imposed additional time pressure on the subjects in the experimental group A, which might have resulted in low scores for questions related to dependent variables Y.3 and Y.4 in the KL study; this pressure was not observed in the Reading experiment and may be explained because students in Reading were given more time to perform the scenario blocks than students in KL. Also a major difference existed between the Reading and KL experiments in relation to the experience of the students. Reading students were in the middle of a course on software engineering and only a few weeks before they were introduced to principles of project management. Possibly such issues related to project management were fresh in their minds and might be the reason the results were better as regards to Y.4 and . and hypotheses
RODRÍGUEZ et al.: E-LEARNING IN PROJECT MANAGEMENT USING SIMULATION MODELS
V. THREATS TO VALIDITY A. Construct Validity Construct validity is the degree to which the variables used in the study accurately measure the concepts they purport to measure. The related issues remain the same as in the KL experiment [25]. a) SD models might not adequately capture the specific advantages over conventional planning models. b) Interest in a topic and evaluation of a training session are difficult concepts that have to be captured with subjective measurement instruments. c) To avoid an “unfair” comparison between SD models and COCOMO is difficult because SD offers features that are not available for COCOMO. B. Internal Validity Internal validity is the degree to which conclusions can be drawn about the causal effect of the independent variable on the dependent variables. a) A selection effect was avoided by random assignment of subjects. b) Non-drop-out of subjects has been avoided by the experimental design. c) Different treatments in the number of blocks and time available may have induced an instrumentation effect. C. External Validity External validity is the degree to which the results of the research can be generalized to the population under study and other research settings. a) Being the subjects of the experiment computer science students or related fields, generalizations to professionals should be made with caution. b) Adequate size and complexity of the applied materials might vary depending on previous knowledge about SD modelling and COCOMO. VI. ANALYSIS OF THE RESULTS AND DISCUSSION The main objective of developing and applying a simulationbased training module is to facilitate effective learning about certain topics of software project management for computer science students. From the results of the replication and from the original experiment, one can conclude that the goal of achieving deep learning in project management is accomplished better by those students using simulation. According to the posttest and qualitative results, students using the SD simulation model seem to have learned and understood SE principles better than students in the control group using a more traditional approach involving the static COCOMO model. When analyzing these results from the point of view of current learning theories, the following points can be highlighted. a) e-learning systems with simulation can achieve the interactivity advocated by current learning theories. By using simulation, students can achieve Mayes’ tertiary level [9] of interactivity as if they could consult the instructor or an expert (with the benefit that the instructor does not need
461
to be present). Also, students need to reflect on the experimental structure designed by the instructor which helps to establish Kolb’s Learning Cycle [10], [11]. b) Based on the students’ comments, simulation attained a motivation effect. Students liked to play, try out different solutions, and check the effects. Thus, considering the motivating effect that emotion has on learning to fuel a “want to learn” [26], while “emotional intelligence” [27] is the energy that takes students from the single-loop learning of Kolb’s learning cycle to the potentially paradigm-shifting of double-loop learning—deep learning. The average of the final marks of the students that took part in this experiment was better than the class average (one of the students in the SD group obtained all the possible marks in the final exam). However, such results were not very surprising since the experiment was conducted on a voluntary basis with primarily good students deciding to participate. This experiment shows that instructors can improve e-learning environments by using simulation. However, SD is not the only simulation technique that can be applied. The Bayesian Networks (BN) can be used to generate similar causal effect relationships by combining graph and probability theories. For example, Fig. 3 represents a simplified defect estimation model where the residual defects depend on the defects introduced in the source code and the defects detected during testing. The number of defects detected during testing depends on the amount of testing effort and the number of defects in the source code. Every node has a probability table defining the strength of the relationships between connected nodes. The power of BNs emerges when setting evidences. Once evidences (or facts) have been entered into the network, such evidences can be used to update the probabilities in the BN (Fig. 4). Using this technique, students can check the causal effect of their decisions. Problems also exist when applying SD and BN models. The first set of problems is related to the creation and validation of such models. Models need to be created specific to a domain. Therefore, expertise is required to model the entities, attributes, and cause–effect relationships that compose such models. Furthermore, once those models have been created, they need to be validated against the real world they are modeling. Kitchenham et al. [28] propose a framework for validating bidding systems, which can also be used for evaluating SD or BN models. The evaluation framework is composed of five quality aspects: 1) syntactic quality, 2) semantic quality, 3) pragmatic quality, 4) test quality, and 5) value quality. For each quality aspect, the authors define goals and means to achieve them. 1) Syntactic quality is achieved by syntactic correctness. Both SD and BN have a well-defined syntax based on mathematical theories. 2) Semantic quality results from feasible completeness and feasible validity. Feasible completeness means that the model includes all relevant causal relationships of the domain. Feasible validity refers to the correctness of such relationships to the domain. Typically, semantic quality goals are the most difficult to achieve in the context of SD or BN, since they are related to the problem of accurate knowledge elicitation.
462
IEEE TRANSACTIONS ON EDUCATION, VOL. 49, NO. 4, NOVEMBER 2006
Fig. 3. Simplified BN Estimation Model.
Fig. 4. Evidences and probabilities updated in the model.
3) Pragmatic quality deals with the issue of adequately presenting model and results from feasible comprehension and feasible understandability. Methods to facilitate comprehension include visualization, explanation, and filtering, which can be assessed through empirical studies. Expressive economy and structure are model properties that enable the achievement of feasible understandability. 4) Test quality results from achieving feasible test coverage. 5) Value quality results from practical utility of the models. Kitchenham et al. mention appropriate user manuals, training, etc., as means to achieve practical utility. Finally, another problem relates to the ease of use of the models and tools provided to the students. Although both SD and BN tools usually provide graphical user interfaces, e-learning simulation systems may require the creation of new interfaces appropriate to the domain they are modeling to avoid steep learning curves imposed by too abstract or complex causal models. VII. CONCLUSION The empirical studies presented in this paper investigated the effect of using a Web system based on system dynamics (SD) to assist software project management education. The study was completed by replicating an experiment to gain better insight about its utility in project management in particular and in higher education in general. The treatment focused on
problems of project planning and control. In this work, the SD models were based on a Web interactive role-play scenario against the control group without interactive role play. The performance of the students, which was measured using a pretest and posttest, was analyzed with regard to four dimensions—interest in the topic of software project management, knowledge of typical project behavior patterns, understanding of simple project dynamics, and understanding of complex project dynamics. By studying the differences between the posttest and pretest scores of the experimental group (based on an SD model) and the control group (based on COCOMO), conclusions were drawn with respect to the effects of the different treatments. The results indicated that students using the e-learning system with the incorporated SD simulation model gained a better understanding about typical behavior patterns of software development projects. The findings of the replicated experiment corroborates that using SD models increase the students’ interest in software project management and also improve their knowledge about typical project behavior patterns. This positive result of the experiment may result from the SD simulation model being integrated into e-learning systems that achieve the level of interaction advocated by current learning theories. Future work will be related to the creation of generic tools that facilitate easy integration of SD models into Web-based e-learning systems. In addition, other dynamic methods such as BN should be investigated as an alternative to SD models. An experiment that compares the effectiveness of SD and BN models in the context of software project management education is currently in the planning stage. ACKNOWLEDGMENT The authors would like to thank the anonymous reviewers for their useful comments. REFERENCES [1] A. K. Graham, J. D. W. Morecroft, P. M. Senge, and J. D. Sterman, “Model-supported case studies for management education,” Eur. J. Oper. Res., vol. 59, pp. 151–166, 1992. [2] D. Pfahl, O. Laitenberger, G. Ruhe, J. Dorsch, and T. Krivobokova, “Evaluating the learning effectiveness of using simulations in software project management education: Results from a twice replicated experiment,” Inf. Softw. Technol., vol. 46, pp. 127–147, 2004.
RODRÍGUEZ et al.: E-LEARNING IN PROJECT MANAGEMENT USING SIMULATION MODELS
[3] IEEE/ACM Joint Task Force on Computing Curricula, “Software Engineering 2004, Curriculum guidelines for undergraduate degree programs in software engineering,” IEEE Computer Soc. Press and ACM Press, Aug. 2004 [Online]. Available: http://www.computer.org/curriculum [4] E. Hamilton and H. Cairns, The Collected Dialogues of Plato, Including the Letters. Princeton, NJ: Princeton Univ. Press, 1961. [5] G. O’Neill and T. McMahon, “Student-centred learning: What does it mean for students and lecturers?,” in Emerging Issues in the Practice of University Learning and Teaching, G. O’Neill, S. Moore, and B. McMullin, Eds. Dublin, Ireland: AISHE, 2005, vol. 1. [6] J. Biggs, Teaching for Quality Learning at University. Buckingham, U.K.: Society for Research into Higher Education and the Open Univ. Press, 1999. [7] G. Light and R. Cox, Learning & Teaching in Higher Education: The Reflective Professional. Newbury Park, CA: Paul Chapman Publishing, 2001. [8] D. Laurillard, Rethinking University Teaching : A Conversational Framework for the Effective Use of Learning Technologies, 2nd ed. London, U.K.: RoutledgeFalmer, 2002. [9] J. T. Mayes, “Learning technology and groundhog day,” in Hypermedia at Work: Practice and Theory in Higher Education, W. Strang, V. Simpson, and D. Slater, Eds. Canterbury, U.K.: Univ. of Kent Press, 1995. [10] D. A. Kolb, Experiential Learning: Experience as the Source of Learning and Development. Englewood Cliffs, NJ: Prentice-Hall, 1984. [11] R. Ross, B. Smith, and C. Roberts, “The wheel of learning: Mastering the rhythm of a learning organization,” in The Fifth Discipline Fieldbook, P. Senge, R. Ross, B. Smith, C. Roberts, and A. Kleiner, Eds. New York: Currency/Doubleday, 1994. [12] J. W. Forrester, Principles of Systems. Norwalk, CT: Productivity Press, 1961. [13] T. K. Abdel-Hamid and S. E. Madnick, Software Project Dynamics: An Integrated Approach. Englewood Cliffs, NJ: Prentice-Hall, 1991. [14] A. Drappa and J. Ludewig, “Simulation in software engineering training,” in Proc. 22nd Int. Conf. Software Engineering, Limerick, Ireland, Jun. 4–11, 2000, pp. 199–208. [15] E. O. Navarro and A. Van Der Hoek, “Software process modeling for an educational software engineering simulation game,” Softw. Process Improvement Practice, vol. 10, pp. 311–326, 2005. [16] B. W. Boehm, “Industrial software metrics top 10 list,” IEEE Software, vol. 4, pp. 84–85, 1987. [17] B. W. Boehm and V. R. Basili, “Software defect reduction top 10 list,” IEEE Computer, vol. 34, pp. 135–137, 2001. [18] B. W. Boehm, Software Engineering Economics. Englewood Cliffs, NJ: Prentice-Hall, 1981. [19] D. Pfahl, M. Klemm, and G. Ruhe, “A CBT module with integrated simulation component for software project management education and training,” J. Syst. Softw., vol. 59, pp. 283–298, 2001. [20] Guide to the Software Engineering Body of Knowledge (SWEBOK). New York: (SWEBOK) IEEE Press, 2004. [21] S. L. Pfleeger, Software Engineering: Theory and Practice, 2nd ed. Upper Saddle River, NJ: Prentice-Hall, 2001. [22] D. J. Sheskin, Handbook of Parametric and Nonparametric Statistical Procedures. Boca Raton, FL: CRC Press, 1997. [23] J. Cohen, Statistical Power Analysis for the Behavioral Sciences, 2nd ed. Hillsdale, NJ: Lawrence Earlbaum, 1988. [24] J. Miller, “Applying meta-analytical procedures to software engineering experiments,” J. Syst. Softw., vol. 54, pp. 29–39, 2000. [25] D. Pfahl, N. Koval, and G. Ruhe, “An experiment for evaluating the effectiveness of using a system dynamics simulation model in software project management education,” in Proc. 7th Int. Software Metrics Symp., Metrics 2001, 2001, pp. 97–109.
463
[26] P. Race and S. Brown, The Lecturer’s Toolkit. London, U.K.: Kogan Page, 1998. [27] A. Brockbank and I. McGill, Facilitating Reflective Learning in Higher Education. New York: Open Univ. Press, 1999. [28] B. A. Kitchenham, L. Pickard, S. Linkman, and P. Jones, “A framework for evaluating a software bidding model,” Inf. Softw. Technol., vol. 47, pp. 747–760, 2005. Daniel Rodríguez (M’99) received the B.Sc. degree in computer science from the University of the Basque Country, Spain, in 1995 and the Ph.D. degree from the University of Reading, U.K., in 2003. He is currently a Lecturer in the Department of Computer Science at the University of Alcalá, Madrid, Spain. His research interests are in the area of software engineering, including empirical software engineering and the application of data mining techniques to software engineering.
Miguel Ángel Sicilia received the Ms.C. degree in computer science from the Pontifical University of Salamanca, Madrid, Spain, in 1996 and the Ph.D. degree from the Carlos III University, Madrid, Spain, in 2003. He worked as a Software Architect in e-commerce consulting firms, where he was part of the development team of a Web personalization framework at Intelligent Software Components (iSOCO). Currently, he leads the Information Engineering Unit at the Computer Science Department, University of Alcalá, Madrid, Spain. His research interests are primarily in the areas of adaptive hypermedia, learning technology, and human–computer interaction. He is coauthor of more than 20 refereed publications in these areas, and he also leads the AIS SIG on reusable learning objects (http://www.sigrlo.org).
Juan José Cuadrado-Gallego received the Ph.D. degree in computer sciences engineering from the University Carlos III, Madrid, Spain, in 2001. He previously held positions at the University of Valladolid and University Carlos III, Madrid, Spain. He currently works in the Department of Computer Science at the University of Alcalá, Madrid, Spain, and the University Oberta of Catalunya, Barcelona, Spain. His research interest are in the area of software engineering and especially software measurement. Dr. Cuadrado-Gallego is the President of the Spanish Function Points Users Group (SFPUG), Spain.
Dietmar Pfahl received the Ph.D. degree (Dr. rer. nat.) in computer science from the University of Kaiserslautern, Kaiserslautern, Germany, and the M.Sc. (Diplom-Wirtschaftsmathematik) degree in applied mathematics and economics from the University of Ulm, Ulm, Germany. He joined the Schulich School of Engineering at the University of Calgary, AB, Canada, in July 2005. Previously, he was department head with the Fraunhofer Institute for Experimental Software Engineering (IESE), Kaiserslautern, Germany; Project Manager with Siemens Corporate Technology, Munich, Germany; and Research Staff Member with the German Aerospace Research Establishment, Oberpfaffenhofen, Germany. He has almost 20 years of experience in conducting and leading national and international research and transfer projects with the software industry, including organizations such as Bosch, DaimlerChrysler, Dräger, Ericsson, and Siemens. His current research interests include empirical software engineering, quantitative software project management, software process analysis and improvement, and simulation-based learning and decision support. Dr. Pfahl is an affiliate member of the IEEE Computer Society, a senior member of the Association for Computing Machinery (ACM), a member of the Institute of Mathematics and Its Application, and a member of the German Computer Society.