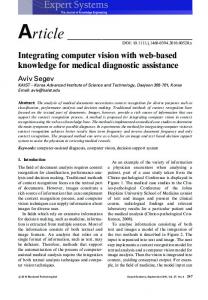
BioSystems 103 (2011) 115–124
Contents lists available at ScienceDirect
BioSystems journal homepage: www.elsevier.com/locate/biosystems
E-photosynthesis: Web-based platform for modeling of complex photosynthetic processes a ˇ ˇ David Safránek , Jan Cerven y´ b,c,∗ , Matˇej Klement a , Jana Pospíˇsilová a , Luboˇs Brim a , Duˇsan Lazár d , b,c Ladislav Nedbal a
Systems Biology Laboratory, Faculty of Informatics Masaryk University, Botanická 68a, CZ-60200 Brno, Czech Republic Institute of Systems Biology and Ecology, Academy of Sciences, Zámek 136, CZ-37333 Nové Hrady, Czech Republic c Photon Systems Instruments, Ltd., Koláˇckova 39, CZ-62100 Brno, Czech Republic d Laboratory of Biophysics, Faculty of Science, Palack´ y University, Tˇr. Svobody 26, 771 46 Olomouc, Czech Republic b
a r t i c l e
i n f o
Article history: Received 17 August 2010 Received in revised form 22 October 2010 Accepted 23 October 2010 Keywords: Biomodels repository Computational models Photosynthesis Systems biology Web platform
a b s t r a c t E-photosynthesis framework is a web-based platform for modeling and analysis of photosynthetic processes. Compared to its earlier version, the present platform employs advanced software methods and technologies to support an effective implementation of vastly diverse kinetic models of photosynthesis. We report on the first phase implementation of the tool new version and demonstrate the functionalities of model visualization, presentation of model components, rate constants, initial conditions and of model annotation. The demonstration also includes export of a model to the Systems Biology Markup Language format and remote numerical simulation of the model. © 2010 Elsevier Ireland Ltd. All rights reserved.
1. Introduction Most of life forms, including humans, depend on photosynthesis that transforms energy of solar radiation into energy-rich organic matter, releases oxygen that we breathe, and removes excess carbon dioxide from the atmosphere that would threaten the Earth’s energy balance. The scale of this process is illustrated by the global carbon cycle: Most of the global carbon emissions (ca. 215 Gt/year), including 9 Gt/year of anthropogenic emissions are assimilated by photosynthesis of plants, algae, and cyanobacteria into newly synthesized organic matter (Lal, 2008; Raven et al., 2008). Adding to the relevance of photosynthesis, significant expectations emerged lately in connection with potential human interventions in the global carbon cycle – among the considered alternatives are the higher generation biofuels (Brennan and Owende, 2010; Chisti, 2008), biomineralization by point-source carbon capture (Jansson
Abbreviations: MIASE, Minimal Information about a Simulation Experiment standard; MIRIAM, Minimum Information Requested In the Annotation of Models; ODE, ordinary differential equation; SBML, Systems Biology Markup Language; SEDML, Simulation Experiment Description Markup Language; SOAP, Simple Object Access Protocol. ∗ Corresponding author at: Institute of Systems Biology and Ecology ASCR, ˇ Zámek 136, CZ-37333 Nové Hrady, Czech Republic. Tel.: +420 386 361231; fax: +420 386 361231. ˇ ´ E-mail address:
[email protected] (J. Cerven y). 0303-2647/$ – see front matter © 2010 Elsevier Ireland Ltd. All rights reserved. doi:10.1016/j.biosystems.2010.10.013
and Northen, 2010; Riding, 2009), or enhancing the ocean carbon storage by microbial carbon pumps (Jiao et al., 2010). One of the key strategies in addressing these issues aims at increasing the natural efficiency of photosynthesis (Zhu et al., 2010). This would be hard to achieve without a good mathematical model capturing relevant features of the complex non-linear and dynamic photosynthetic network. The complexity of photosynthesis is not a mere result of a large number of components but rather it results from numerous regulatory interactions that act over vastly different time scales and connect different compartments. The complexity is an inherent property of the photosynthetic process that must be responsive to a highly dynamic environment (e.g., Baumert and Petzoldt, 2008; Niinemets and Valladares, 2004; Rascher and Nedbal, 2006). Remarkable effort towards a consistent and coherent knowledge base of photosynthetic models materialized in the recent publication of photosynthetic models that span from femtoseconds to seasons and from individual molecules to forests and oceans (Laisk et al., 2009). However, the models that are published in the book are of a limited use unless their rigorous transcription is shared among all potentially interested users. Such a community-wide model sharing may be facilitated by Internet provided that the models are translated into a unified format and uniformly annotated so that they can be used in its original form, compared with each other and with wet-lab experiments, and further expanded. To this end, one needs a unified, flexible, and neutral format to fully represent partial models, involved compo-
116
D. Sˇ afránek et al. / BioSystems 103 (2011) 115–124
Fig. 1. Scheme of E-photosynthesis architecture.
nents, as well as their interactions. Here, we choose Systems Biology Markup Language (SBML) which is a standard and widely accepted format for biological models (Hucka et al., 2003). SBML provides a clearly defined scheme that incorporates the model structure, the reaction network, together with appropriate annotation links and quantitative data.
The SBML format is, however, not customized for modeling photosynthesis. In a typical SBML application, the state variables are concentrations of biochemical species that mutually react according to mass action laws. In contrast, a state of a photosynthetic reaction center is defined as a Cartesian product multiplying the degrees of freedom of all contained redox com-
Fig. 2. E-photosynthesis Introduction screen. The user login is for users that volunteer to register for gaining access to advanced simulation and project management features. Registration is not a pre-requisite for model browsing and visualization. The main menu tasks at the top of this window direct the user to Projects, Links, Team, and Contacts. The links to other features offer addition information resources at the bottom of the window.
D. Sˇ afránek et al. / BioSystems 103 (2011) 115–124
117
Fig. 3. E-photosynthesis Project screen.
ponents (Nedbal et al., 2009). Thus, SBML represents a solid base format that needs to be further customized for photosynthesis modeling. Another existing resource to inspire further expansion of photosynthesis modeling are the established web repositories of curated and well-annotated models traversing already through many branches of biology (Beard et al., 2009; Le Novere et al., 2006; Olivier and Snoep, 2004). Unfortunately, photosynthesis models are strongly underrepresented in these repositories, probably, because of the natural differences that exist between most of the metabolic networks and networks that include photosynthetic combinatorial states. Also it is very hard to develop visualization tools to present general metabolic networks jointly with photosynthesis in an illustrative and facile manner. Another challenge that needs to be addressed is the limited scope and coherence of annotation of photosynthetic components and reactions in existing public databases. In particular, the current state of photosynthesis-related terms available in general annotation ontologies and repositories like Gene Ontology (http://www.geneontology.org; Ashburner et al., 2000), MetaCyc (http://www.metacyc.org; Chisti, 2008), KEGG (http://www.genome.jp/kegg; Kanehisa et al., 2010) and BioMod-
els (http://www.genome.jp/kegg; Le Novere et al., 2006), is not sufficient. To overcome these problems, we initiated some years ago a dedicated E-photosynthesis project (Nedbal et al., 2007, 2009; Orr and Govindjee, 2007; Rascher and Nedbal, 2006) aiming at generation of a comprehensive modeling space that would be customized for photosynthesis. This ambitious project had stumbled until recently on lacking capacity that was temporarily re-directed towards writing and editing of the review book on photosynthesis modeling (Laisk et al., 2009). Lately, the E-photosynthesis project has resumed by complete remodeling of the web site that is based on new software tools that are described here in Section 2. The newly created features are presented here in “work-in-progress” form of Section 3 demonstrating the features that are already available in the new environment. 2. Methods 2.1. Model simulation methods SBML-based modeling frameworks connect the models directly to a set of well-developed simulation methods. The methodology used to drive the simulation tasks in E-photosynthesis is based on ODEPACK algorithms (Hindmarsh,
118
D. Sˇ afránek et al. / BioSystems 103 (2011) 115–124
Fig. 4. Zooming in the scheme of photosynthetic structures and reactions.
D. Sˇ afránek et al. / BioSystems 103 (2011) 115–124
119
Fig. 5. List of components of the “Holzwarth 2006” model. When clicked, the components are characterized by a short description and by links to annotations in local and public databases. Here, the examples of public databases include EMBO-EBI database (http://www.ebi.ac.uk/) and KEGG database (http://www.genome.jp/dbgetbin/www bget?cpd:C05306).
1980; Hindmarsh, 1983) providing a set of highly parameterized ODE solvers. Ephotosynthesis provides a simulation engine which is based on LSODE methods as implemented in the free computational tool Octave 3 (Eaton, 2002). Each simulation task is determined by a specific setting of the quantitative model parameters (initial conditions, reaction rates) as well as by appropriately tuned settings of simulation parameters. Thus, when dealing with simulations, the proper management of all relevant data is needed in order to guarantee unique solution and reproducibility of simulation experiments. To this end, we employ the methodology presented in the Minimal Information about a Simulation Experiment standard (MIASE, http://biomodels.net/miase) that prescribes what information has to be maintained together with the model data in order to completely capture the particular simulation tasks.
2.2. Model annotation methods It is important to differentiate between models of the same subsystem that might differ, e.g., by the time resolution of the detection system in the considered experiment. This is achieved in the model annotation that, typically, also includes information about the organism or structure that is modeled, the model output to be compared with the measured experimental signal, the time resolution at which is the modeled signal captured, as well as external constraints such as irradiance or irradiance temporal modulation. To this end, we employ the Minimum Information Requested In the Annotation of Models (MIRIAM, http://biomodels.net/miriam; Le
Novere et al., 2005), the proposed standard in systems biology for annotating models by model-specific information.
2.3. Framework architecture and technology The architecture of E-photosynthesis is intended to unify the model presentation with model analysis and model validation in a single framework. By model presentation, we mean that the user can simulate modeled dynamic behavior as it has been already published and export data and the model for further use. Model analysis includes also modification of the model parameters, of initial conditions, of rate constants and, in its most advanced form, also of the model structure. Model validation feature is considered as a framework for comparison of simulated behavior against wet-lab experiments. In particular, this is achieved by statistical comparison of time-series data measured on the organism with respect to the data simulated on the model with initial conditions mimicking the experimental conditions. A scheme of E-photosynthesis framework is shown in Fig. 1. The two cores of the framework are the database engine and the simulation engine. Services of these central modules are provided to users via web-based presentation and administration interfaces. The entire system is strongly modularized and segmented into individual libraries to facilitate easy future upgrades. The database engine serves for data storage and as a querying center of two mutually interconnected databases – the annotations and models databases. Both databases are deployed to a MySQL 5 database server (http://www.mysql.com).
D. Sˇ afránek et al. / BioSystems 103 (2011) 115–124
120
Fig. 6. List of reactions of the “Holzwarth 2006” model. When clicked, the reactions are characterized by initial and final states and by relevant rate constants.
The simulation engine serves the in silico experiment tasks as they are requested by the users remotely via the presentation interface module. The simulation engine works with the model translated to a set of ordinary differential equations (ODEs). Robust numerical methods are employed to generate time-series data for given initial conditions and kinetic parameter sets. The simulation engine is prepared for any MATLAB-compatible ODE solver in terms of the standard API. In the current implementation, Octave is employed as computational platform for the simulation engine. The results of the simulation are sent back to the presentation module for further processing and visualization. The administration and presentation interfaces are implemented using dynamic web technologies PHP 5.2 (http://www.php.net) and asynchronous server-to-client communication. For the visual presentation of simulation results, we adapted the open source Open Flash Chart 2 technology (http://teethgrinder.co.uk/open-flashchart-2). To optimize the computational power of the individual services, the tool architecture is prepared for deployment of the database, simulation, and both presentation modules to four independent computing nodes interconnected via high-speed network links. Communication between libraries deployed to different machines is realized using Simple Object Access Protocol (SOAP) employed over HTTP links.
3. Results Based on the methodology described in the previous section, we have implemented the second version of E-photosynthesis.org website (http://www.e-photosynthesis.org) that currently offers the following services available on-line:
• model repository customized for specific needs of photosynthesis research • MIRIAM-compatible annotation database and ontology of photosynthesis-related terms • graphical environment visualizing the models in a modular and hierarchical manner • model examination module prepared for further deployment to high-performance platforms • support for user enabled construction of new models by re-using modules of already existing model structures • user specific interactive interface The graphical user interface of E-photosynthesis starts with the Introduction window (Fig. 2) that declares its close relationship with the “Photosynthesis in Silico” book (Laisk et al., 2009). The tool functionality features, “Introduction”, “Projects”, “Links”, “Team”, and “Contact” are available through the main menu tabs placed at the top of the screen. The most important functionality of E-photosynthesis is accessible by clicking the “Projects” button. It supports browsing and exploring of models in the repository database. During the tool construction, only two models are publicly available in the model repository (http://www.e-photosynthesis.org) that are labelled “Holzwarth 2006” and “Laisk 2009”, indicating the principal
D. Sˇ afránek et al. / BioSystems 103 (2011) 115–124
121
Fig. 7. List of parameters of the “Holzwarth 2006” model. When clicked, the numerical values of the initial conditions and of the rate constants are displayed.
authors and publication year. These two models are used for validation of the construction progress and for testing the functionalities. Here, we are using the first modeling project “Holzwarth 2006” to give an overview of the tool functionality and to demonstrate its practical use. The model targets the primary events of photosynthetic energy conversion in Photosystem II that was published by Holzwarth et al. (2006). The implementation of the model in the E-photosynthesis framework was discussed in detail in Nedbal et al. (2007, 2009). The second modeling project “Laisk 2009” is currently presented in a less advanced form because the model already involves also the Calvin–Benson cycle and nitrogen metabolic paths that introduce regulatory feedbacks. The model representation at E-photosynthesis will be further refined during the next phase of tool development during which the support for multi-component modeling with regulatory feedbacks among components will be implemented. The projects are represented in the graphical user interface of the E-photosynthesis tool in several ways (Fig. 3): • By the directory tree in the left part of the screen that presents the names of the available projects in terms of an expandable list of their subsystems and/or components (“AVAILABLE MODELING PROJECTS” in Fig. 3). • By a short model description, typically Abstract from the model publication (“SHORT MODEL DESCRIPTION” in Fig. 3). • By a cartoon scheme (“SCHEME OF REACTIONS AND STRUCTURES” in Fig. 3) in which individual subsystems or components are highlighted when the cursor moves over. The functionality also highlights the models which include the particular subsystem or component (in Fig. 3, both “Holzwarth 2006” and “Laisk 2009” are highlighted because they include the “Light reactions” module which was selected by the mouse pointer). Upon click-
ing on the highlighted subsystem, one can zoom in to its detailed graphical representation (Fig. 4). • By the Components, Reactions, Parameters, and Annotations tabs (“MODEL DETAILS PANEL” in Fig. 3). Note that the Project screen also offers simulation and export to SBML (“SIMULATION & EXPORT” in Fig. 3). Zooming in as shown in Fig. 4 restricts also the selection of models that include the selected component as well as it restricts the information about components, reactions, parameters and annotations. The model details are presented in the left bottom part of the Project screen (“MODEL DETAILS PANEL” in Fig. 3) by model components, reactions, parameters and annotations. Short description and annotation links of particular model components can be opened by clicking (+) in the respective component list (Fig. 5). The annotations are typically taken from the local E-photosynthesis annotation database and from public databases like EBI (European Bioinformatics Institute, http://www.ebi.ac.uk/), KEGG (Kyoto Encyclopedia of Genes and Genomes, http://www.genome.jp/kegg/), GO (Gene Ontology, http://www.geneontology.org/) or others. Further, the Reactions tab (Fig. 6) provides the list of reactions considered in the model together with the reaction rates as they were published with the respective model. The reaction rates can be edited for an advanced simulation only by the registered users and project leaders. The same applies also to the initial conditions of the model that are available under the Parameters tab (Fig. 7). The annotations relevant to the model are partly listed in the Components tab and will also be included in the Reactions tab as soon as the reaction annotations are provided by the annotators. The remaining annotations describing the modeled experimen-
D. Sˇ afránek et al. / BioSystems 103 (2011) 115–124
122
UniProt TAXONOMY
GENE ONTOLOGY Components
Reactions
Parameters
Annotations
+ publication: Holzwarth et al., 2006
- cellular component: photosystem II A photosystem that contains a pheophytin-quinone reaction center with associated accessory pigments and electron carriers. In cyanobacteria and chloroplasts, in the presence of light, PSII functions as a water-plastoquinone oxidoreductase, transferring electrons from water to plastoquinone, whereas other photosynthetic bacteria carry out anoxygenic photosynthesis and oxidize other compounds to re-reduce the photoreaction center. GO:0009523
- cellular organism: Synechococcus elongatus taxonomy:32046
- cellular organism: Spinacia oleracea taxonomy:3562
- cellular component: membrane-derived thylakoid PSII GO:0030096 + publication: Nedbal et al., 2007
- biological process: photosynthesis The synthesis by organisms of organic chemical compounds, especially carbohydrates, from carbon dioxide (CO2) using energy obtained from light rather than from the oxidation of chemical compounds. GO:0015979
- biological process: photosynthesis, light harvesting Absorption and transfer of the energy absorbed from light photons between photosystem reaction centers. [source: GOC:sm] GO:0009765
- cellular component: chloroplast Chloroplasts are semiautonomous arganelles comprising an envelope formed of two membranes, an aqueous matrix known as stroma, and an extensive system of internal membranes known as thylakoids. All of the light-harvesting and energy-transducing functions are located in the thylakoids." [source: local, PMID:15187262]
Fig. 8. List of annotations of the “Holzwarth 2006” model. When clicked, the annotation and links to the corresponding databases are displayed. Here examples of the databases include Gene Ontology database (http://amigo.geneontology.org/cgi-bin/amigo/term-details.cgi?term=GO:0009523) and the UniProt database (http://www.uniprot.org/taxonomy/32046).
tal system or a particular experimental protocol are given in the Annotations tab (Fig. 8). The links to public databases also offer navigation in an ontology tree. Simulation environment gives access to quick on-line exploitation of model behavior based on predefined parameter sets. For each project, the numerical simulation is accessible directly from the initial “Project” page (“SIMULATION & EXPORT” in Fig. 3). The calculation takes place in the remote simulation engine (Fig. 1) and is presented to the user who requested the simulation by the screen shown in Fig. 9. The graph presenting the simulation can be modified by adjusting the graph upper and lower limits (“ZOOMING” in Fig. 9) and by hiding some of the curves (click the legend). The numerical values can be inspected by moving the cursor over a particular curve. The simulation results can also be exported by clicking either “CSV Data” or “XLS Data” at the bottom of the simulation graph (CommaSeparated Values or MS Excel formats). Another important feature of the E-photosynthesis tool is the export of the model in the SBML format. This feature is available by clicking Export in the initial “Project” page (“SIMULATION & EXPORT” in Fig. 3). The exported file is encoded in the XML format that can be read by variety of solvers listed in http://sbml.org/SBML Software Guide. In this way, the model available in E-photosynthesis repository can be further exploited
and modified by the user outside the E-photosynthesis framework. As an alternative, advanced users may also change the model parameters while remaining in the E-photosynthesis framework to obtain alternative simulations such as with different initial conditions and/or reaction rates. The results of such simulations together with the respective model parameters can be stored, used later or shared with other registered participants – always connected to the profile of the registered user. In this way, E-photosynthesis may facilitate not only storage and presentation of models from literature but also support further development and continuous update of the models. E-photosynthesis also includes the administration interface (not shown) which is available to project leaders and managers. Its main purpose is to provide a platform for maintaining the assigned models. The interface simplifies project workflow by effective manipulation with individual model parts including creation and editing of reactions, component states, and parameter values. In this way, the model can be also expanded and its structure changed. Another important part of the administration is selection of the numerical methods used for simulation of particular models. The default parameters of ODE solver can be reset by the project managers to ensure robust simulation. Together with the simulation parameters, the project managers can also customize the visualization of calculated time-series.
D. Sˇ afránek et al. / BioSystems 103 (2011) 115–124
123
Fig. 9. Simulation of the “Holzwarth 2006” model.
4. Discussion The biggest challenge in generating tools like E-photosynthesis is in errors that often occur in published models. Hucka and Schaff (2009) estimated that 60–95% of published biological models are defective. Very often, the model is correct in the software that is used by the creator of the model but its description in the paper is erroneous. In other cases, important model parameter can be missing in the paper. An individual reader cannot reconstruct the model without excessive effort or without a constructive assistance from the model author. The same amount of work must be done by the E-photosynthesis team but the result is then shared by all users of the tool. A more specific challenge of model repositories is in generating functional connection between related models to obtain functional modeling framework. It is because, almost as a rule, different authors consider different assumptions and apply different approaches, e.g., order of a reaction and dimension and value of related rate constant, use of absolute or relative quantities for model state variables – see, e.g., Lazár and Jablonsky´ (2009). A meaningful integration of a new model to the Ephotosynthesis modeling framework also requires a rigorous definition of experimental quantities to be modeled. For example, chlorophyll fluorescence emission is a radiative deactivation of excited states of chlorophylls and therefore, only models which include the excited states as model state variables can adopt this definition. On the other hand, chlorophyll fluorescence signal is very often assumed to be proportional to the amount of the so-called closed reaction centers of Photosystem II (PSII). This raises a question of what are the closed reaction centers of PSII? Mostly, these are considered to be the centers with the primary quinone electron acceptor reduced (QA − ), however, some author also include the centers with Pheo− or with Pheo− QA − (Pheo is the primary electron acceptor, pheophytin; for more details see Lazár and Schansker (2009)). Moreover, a term semi-closed (or semi-open) PSII centers (Pheo− QA or PheoQA − ) also appears in a
definition of fluorescence signal as well as a possibility of “deletion” of a closed status of PSII center by presence of oxidative state of the donor side of PSII caused by the so-called donor side quenching (for more details see Vredenberg (2004)). Again, only models which include QA and/or Pheo and the donor side of PSII can use these definitions. Thus, the modeled kinetics of fluorescence emission depends on the definition that is used for closed reaction of PSII. These challenges are addressed by designing E-photosynthesis as a modeling tool which keeps domain-specific models together with precise annotation data. The quality of the annotation is boosted by the internal E-photosynthesis annotation database that is used whenever the annotation data in open public databases are unavailable or insufficient. The internal annotation database represents a significant contribution of E-photosynthesis to meeting the MIRIAM criteria also in photosynthesis models. Considering model analysis, the central concept of Ephotosynthesis is on-line simulation. Advantages of including this functionality directly by means of an on-line service are two-fold. First, the user can avoid multi-step process of exporting the model and loading it into a particular off-line tool. That not only saves time but also reduces errors that often occur proportionally to the number of involved manipulations. Moreover, the numerical simulation procedures in E-photosynthesis are already tuned by the project administrators to give stable results for particular models. Thus, the properly tuned simulation engine of E-photosynthesis can abstract the user from non-trivial and counterintuitive settings of the simulation procedure – an advantage that is particularly important in the case of large-scale models requiring high-performance computational power. Owing to the fact that the first development phase of Ephotosynthesis has been focused mainly on model presentation aspects, we leave another important functionality, the model validation support, for the nearest future work. In the preliminary prototype implementation of E-photosynthesis, we already made first steps towards this goal. The realization of model validation
124
D. Sˇ afránek et al. / BioSystems 103 (2011) 115–124
will be realized in two aspects. The first aspect is to extend the features of simulation graph applet to allow quick visual comparison of simulation curves against uploaded wet-lab measured data. The second aspect we aim to implement is more detailed statistical comparison of simulated data against wet-lab data. We believe that due to the strictly modular and loosely coupled architecture, the E-photosynthesis framework is well-prepared for further extensions. We plan to further improve the tool functionality, especially in the simulation engine and simulation results visualization. To allow extensive and tool independent analysis, we aim to enable MIASE-compliant export of the simulated time-series data. To this end, we prepare the tool for exporting the simulation experiments data in the form of Simulation Experiment Description Markup Language (SED-ML, http://www.biomodels.net/sed-ml; Kohn and Le Novere, 2008). We also aim to support novel analysis techniques adapted from computer science. Especially, methods of discrete abstraction have proven fruitful for property-driven analysis and tuning of differential models (Barnat et al., 2010; Rizk et al., 2008). Acknowledgements ˇ were supported by grants AV0Z60870520 (Czech LN and JC ˇ 206/09/1284 (Czech Science Academy of Sciences), and by GACR ˇ Foundation) as well as by Photon Systems Instruments, Ltd. DS, ˇ 201/09/1389 (Czech Science MK, JP and LB were supported by GACR Foundation). DL was supported by MSM 6198959215 (Ministry of Education of the Czech Republic). References Ashburner, M., Ball, C.A., Blake, J.A., Botstein, D., Butler, H., Cherry, J.M., Davis, A.P., Dolinski, K., Dwight, S.S., Eppig, J.T., Harris, M.A., Hill, D.P., Issel-Tarver, L., Kasarskis, A., Lewis, S., Matese, J.C., Richardson, J.E., Ringwald, M., Rubin, G.M., Sherlock, G., 2000. Gene ontology: tool for the unification of biology. Nat. Genet. 25 (1), 25–29. Barnat, J., Brim, L., Safranek, D., 2010. High-performance analysis of biological systems dynamics with the DiVinE model checker. Brief. Bioinform. 11 (3), 301–312. Baumert, H.Z., Petzoldt, T., 2008. The role of temperature, cellular quota and nutrient concentrations for photosynthesis, growth and light-dark acclimation in phytoplankton. Limnol. Ecol. Manage. Inland Waters 38 (3–4), 313–326. Beard, D.A., Britten, R., Cooling, M.T., Garny, A., Halstead, M.D.B., Hunter, P.J., Lawson, J., Lloyd, C.M., Marsh, J., Miller, A., Nickerson, D.P., Nielsen, P.M.F., Nomura, T., Subramanium, S., Wimalaratne, S.M., Yu, T., 2009. CellML metadata standards, associated tools and repositories. Philos. Trans. Roy. Soc. A: Math. Phys. Eng. Sci. 367 (1895), 1845–1867. Brennan, L., Owende, P., 2010. Biofuels from microalgae – a review of technologies for production, processing, and extractions of biofuels and co-products. Renew. Sust. Energy Rev. 14 (2), 557–577. Eaton, J.W., 2002. GNU Octave Manualed. Network Theory Limited. Hindmarsh, A.C., 1980. LSODE and LSODI, two new initial value ordinary differnetial equation solvers. SIGNUM Newsl. 15 (4), 10–11. Hindmarsh, A.C., 1983. In: Stepleman, R.S., et al. (Eds.), ODEPACK, a Systematized Collection of ODE Solvers. IMACS Transactions on Scientific Computation, vol. 1. North-Holland, Amsterdam, pp. 55–64. Holzwarth, A.R., Müller, M.G., Reus, M., Nowaczyk, M., Sander, J., Rögner, M., 2006. Kinetics and mechanism of electron transfer in intact photosystem II and in the isolated reaction center: pheophytin is the primary electron acceptor. Proc. Natl. Acad. Sci. U.S.A. 103 (18), 6895–6900. Hucka, M., Finney, A., Sauro, H., Bolouri, H., Doyle, J., Kitano, H., Arkin, A., Bornstein, B., Bray, D., Cornish-Bowden, A., Cuellar, A., Dronov, S., Gilles, E., Ginkel, M., Gor, V., Goryanin, I., Hedley, W., Hodgman, T., Hofmeyr, J.-H., Hunter, P., Juty, N., Kasberger, J., Kremling, A., Kummer, U., Le Novére, N., Loew, L., Lucio, D., Mendes, P., Minch, E., Mjolsness, E., Nakayama, Y., Nelson, M., Nielsen, P., Sakurada, T., Schaff, J., Shapiro, B., Shimizu, T., Spence, H., Stelling, J., Takahashi, K., Tomita,
M., Wagner, J., Wang, J., 2003. The systems biology markup language (SBML): a medium for representation and exchange of biochemical network models. Bioinformatics 19 (4), 524–531. Hucka, M., Schaff, J., 2009. Trends and tools for modeling in modern biology. In: Laisk, A., Nedbal, L., Govindjee (Eds.), Photosynthesis in Silico: Understanding Complexity from Molecules to Ecosystems. Springer, Netherlands, Dordrecht, pp. 3–15. Chisti, Y., 2008. Biodiesel from microalgae beats bioethanol. Trends Biotechnol. 26 (3), 126–131. Jansson, C., Northen, T., 2010. Calcifying cyanobacteria – the potential of biomineralization for carbon capture and storage. Curr. Opin. Biotechnol. 21 (3), 365–371. Jiao, N., Herndl, G.J., Hansell, D.A., Benner, R., Kattner, G., Wilhelm, S.W., Kirchman, D.L., Weinbauer, M.G., Luo, T., Chen, F., Azam, F., 2010. Microbial production of recalcitrant dissolved organic matter: long-term carbon storage in the global ocean. Nat. Rev. Microbiol. 8 (8), 593–599. Kanehisa, M., Goto, S., Furumichi, M., Tanabe, M., Hirakawa, M., 2010. KEGG for representation and analysis of molecular networks involving diseases and drugs. Nucleic Acids Res. 38 (Suppl. 1), D355–360. Kohn, D., Le Novere, N., 2008. SED-ML: an XML format for the implementation of the MIASE. In: Computational Methods in Systems Biology. Springer-Verlag, Rostock, Germany, pp. 176–190. Laisk, A., Nedbal, L., Govindjee, 2009. Photosynthesis in Silico: Understanding Complexity from Molecules to Ecosystems, first ed. Springer, Dordrecht, Netherlands. Lal, R., 2008. Carbon sequestration. Philos. Trans. Roy. Soc. B: Biol. Sci. 363 (1492), 815–830. ´ J., 2009. On the approaches applied in formulation of a kinetic Lazár, D., Jablonsky, model of photosystem II: different approaches lead to different simulations of the chlorophyll a fluorescence transients. J. Theor. Biol. 257 (2), 260–269. Lazár, D., Schansker, G., 2009. Models of chlorophyll a fluorescence transients. In: Laisk, A., Nedbal, L., Govindjee (Eds.), Photosynthesis in Silico: Understanding Complexity from Molecules to Ecosystems. Springer, Dordrecht, Netherlands, pp. 85–123. Le Novere, N., Finney, A., Hucka, M., Bhalla, U.S., Campagne, F., Collado-Vides, J., Crampin, E.J., Halstead, M., Klipp, E., Mendes, P., Nielsen, P., Sauro, H., Shapiro, B., Snoep, J.L., Spence, H.D., Wanner, B.L., 2005. Minimum information requested in the annotation of biochemical models (MIRIAM). Nat. Biotechnol. 23 (12), 1509–1515. Le Novere, N., Bornstein, B., Broicher, A., Courtot, M., Donizelli, M., Dharuri, H., Li, L., Sauro, H., Schilstra, M., Shapiro, B., Snoep, J.L., Hucka, M., 2006. BioModels database: a free, centralized database of curated, published, quantitative kinetic models of biochemical and cellular systems. Nucleic Acids Res. 34 (suppl 1), D689–691. ˇ ´ J., Rascher, U., Schmidt, H., 2007. E-photosynthesis: a compreNedbal, L., Cerven y, hensive modeling approach to understand chlorophyll fluorescence transients and other complex dynamic features of photosynthesis in fluctuating light. Photosynth. Res. 93 (1), 223–234. ˇ ´ J., Schmidt, H., 2009. Scaling and integration of kinetic models of Nedbal, L., Cerven y, photosynthesis: towards comprehensive E-photosynthesis. In: Laisk, A., Nedbal, L., Govindjee (Eds.), Photosynthesis in Silico: Understanding Complexity from Molecules to Ecosystems. Springer, Dordrecht, Netherlands, pp. 17–29. Niinemets, Ü., Valladares, F., 2004. Photosynthetic acclimation to simultaneous and interacting environmental stresses along natural light gradients: optimality and constraints. Plant Biol. (Stuttg.) 6 (03), 254–268. Olivier, B.G., Snoep, J.L., 2004. Web-based kinetic modelling using JWS Online. Bioinformatics 20 (13), 2143–2144. Orr, L., Govindjee, 2007. Photosynthesis and the Web: 2008. Photosynth. Res. 91 (2), 107–131. Rascher, U., Nedbal, L., 2006. Dynamics of photosynthesis in fluctuating light. Curr. Opin. Plant Biol. 9 (6), 671–678. Raven, J.A., Cockell, C.S., De La Rocha, C.L., 2008. The evolution of inorganic carbon concentrating mechanisms in photosynthesis. Philos. Trans. Roy. Soc. B: Biol. Sci. 363 (1504), 2641–2650. Riding, R., 2009. An atmospheric stimulus for cyanobacterial-bioinduced calcification ca 350 million years ago? Palaios 24 (10), 685–696. Rizk, A., Batt, G., Fages, F., Soliman, S., 2008. On a continuous degree of satisfaction of temporal logic formulae with applications to systems biology. In: Heiner, M., Uhrmacher, A. (Eds.), Computational Methods in Systems Biology. SpringerVerlag, Berlin Heidelberg, pp. 251–268. Vredenberg, W.J., 2004. System analysis and photoelectrochemical control of chlorophyll fluorescence. terms of trapping models of photosystem II: a challenging view. In: Papageorgiou, G.C., Govindjee (Eds.), Chlorophyll a Fluorescence: A Signature of Photosynthesis. Springer, Dordrecht, Netherlands, pp. 133–172. Zhu, X.-G., Long, S.P., Ort, D.R., 2010. Improving Photosynthetic Efficiency for Greater Yield. Annu. Rev. Plant Biol. 61 (1), 235–261.