anisotropy; MANOVA, multivariate analysis of variance. The preterm infant provides an ..... both with extensive infant experience, gathered the EEG data at.
Early Experience Alters Brain Function and Structure Heidelise Als, PhD*; Frank H. Duffy, MD‡; Gloria B. McAnulty, PhD*; Michael J. Rivkin, MD*‡§; Sridhar Vajapeyam, PhD§; Robert V. Mulkern, PhD§; Simon K. Warfield, PhD§; Petra S. Huppi, MD‡储; Samantha C. Butler, PhD*; Nikk Conneman, MD*; Christine Fischer, MD*; and Eric C. Eichenwald, MD¶# ABSTRACT. Objective. To investigate the effects of early experience on brain function and structure. Methods. A randomized clinical trial tested the neurodevelopmental effectiveness of the Newborn Individualized Developmental Care and Assessment Program (NIDCAP). Thirty preterm infants, 28 to 33 weeks’ gestational age (GA) at birth and free of known developmental risk factors, participated in the trial. NIDCAP was initiated within 72 hours of intensive care unit admission and continued to the age of 2 weeks, corrected for prematurity. Control (14) and experimental (16) infants were assessed at 2 weeks’ and 9 months’ corrected age on health status, growth, and neurobehavior, and at 2 weeks’ corrected age additionally on electroencephalogram spectral coherence, magnetic resonance diffusion tensor imaging, and measurements of transverse relaxation time. Results. The groups were medically and demographically comparable before as well as after the treatment. However, the experimental group showed significantly better neurobehavioral functioning, increased coherence between frontal and a broad spectrum of mainly occipital brain regions, and higher relative anisotropy in left internal capsule, with a trend for right internal capsule and frontal white matter. Transverse relaxation time showed no difference. Behavioral function was improved also at 9 months’ corrected age. The relationship among the 3 neurodevelopmental domains was significant. The results indicated consistently better function and more mature fiber structure for experimental infants compared with their controls. Conclusions. This is the first in vivo evidence of enhanced brain function and structure due to the NIDCAP. The study demonstrates that quality of experience before term may influence brain development significantly. Pediatrics 2004;113:846 – 857; preterm infants, NIDCAP, neurobehavior, spectral coherence, diffusion tensor imaging, transverse relaxation time, Bayley Scales of Infant Development, APIB. ABBREVIATIONS. NICU, newborn intensive care unit; NIDCAP, Newborn Individualized Developmental Care and Assessment Program; MRI, magnetic resonance imaging; EEG, electroencephalogram; APIB, Assessment of Preterm Infants’ Behavior; Prechtl,
From the Departments of *Psychiatry, ‡Neurology, §Radiology, and ¶Newborn Medicine, Harvard Medical School and Children’s Hospital Boston, Boston, Massachusetts; 储Department of Newborn Medicine, University of Geneva, Geneva, Switzerland; and #Newborn Intensive Care Nursery, Brigham and Women’s Hospital, Boston, Massachusetts. Received for publication Jun 17, 2003; accepted Dec 29, 2003. Address correspondence to Heidelise Als, PhD, Harvard Medical School and Children’s Hospital Boston, Enders Pediatric Research Laboratories, EN107, 320 Longwood Ave, Boston, MA 02115. E-mail: heidelise.als@ childrens.harvard.edu PEDIATRICS (ISSN 0031 4005). Copyright © 2004 by the American Academy of Pediatrics.
846
PEDIATRICS Vol. 113 No. 4 April 2004
Prechtl Neurologic Examination of the Fullterm Newborn Infant; Bayley II, Bayley Scales of Infant Development, Second Edition; MDI, mental developmental index; PDI, psychomotor developmental index; BRS, Behavior Rating Scale; T2*, transverse relaxation time; DTI, diffusion tensor imaging; ROI, region(s) of interest; E1, principal eigenvalue; E3, tertiary eigenvalue; RA, relative anisotropy; MANOVA, multivariate analysis of variance.
T
he preterm infant provides an opportunity to study the effects of early postnatal experience on brain development. Increasing evidence suggests that features of brain structure1– 4 and function5– 8 are different between medically healthy preterm infants and their term counterparts when assessed at a comparable age point. Although some differences are explained by the cumulative effect of minor medical complications associated with premature birth, the infant’s sensory experience in the newborn intensive care unit (NICU) environment, including exposure to bright lights, high sound levels, and frequent noxious interventions, may exert deleterious effects on the immature brain and alter its subsequent development.9 –15 The importance of the match between the environment and the brain’s expectation during “critical” periods of brain development has long been demonstrated in animal models of development, beginning with the classical experiments of Hubel and Wiesel.16 –23 In an effort to decrease the discrepancy between the immature human brain’s expectation and the actual experience in a typical NICU environment, a comprehensive approach named the Newborn Individualized Developmental Care and Assessment Program (NIDCAP) has been developed and tested. Several randomized trials have shown positive results in both behavioral and electrophysiological functioning of very premature infants (⬍30 weeks’ gestational age) at high risk for various serious organ injuries such as chronic lung disease and intraventricular hemorrhage.11–13,15,24 Despite the consistent results, a recent meta-analysis concluded that sufficient evidence did not exist at this time to warrant a multicenter clinical trial.25 Similar developmental results have been documented also in low-risk 30- to 34-week gestational preterms.10 The goal of the current study was to explore the effect of the NIDCAP intervention on a population of low-risk preterm infants. Neurobehavioral, electrophysiological, and quantitative structural magnetic resonance imaging (MRI) methods were used for this study. It was hypothesized that the NIDCAP intervention group, when com-
pared with a standard care group, would perform better on all 3 measures of neurodevelopment. METHODS Design A controlled trial design with 2-group randomization was used. Blocking by gender (male/female) and ethnicity (white/ other) was imposed a priori. Consent was obtained as soon after delivery as feasible within the first 3 postpartum days. Immediately after consent was obtained, subjects were assigned randomly to either the experimental or control group. Group assignment was revealed by parental opening of the opaque, prenumbered, sealed envelope drawn from the respective randomization box, dependent on the infant’s gender and ethnicity. Outcome assessment staff was purposefully kept “blind” to the infants’ group assignments. The outcome assessments were performed at 2 weeks’ corrected age (all infants were discharged from the NICU before this point) and at 9 months’ corrected age.
Subjects Thirty low-risk preterm infants and their parent(s) constituted the study sample. They were recruited from the NICU of the Brigham and Women’s Hospital (Boston, MA), a facility with ⬎6000 births per year and a 46-bed level III NICU with an exclusively inborn population. The institutional review boards for research with human subjects of both Brigham and Women’s Hospital and Children’s Hospital Boston (Boston, MA), at which the outcome assessments took place, approved the study protocol. The 2 hospitals are interconnected physically, and both are Harvard teaching hospitals. Study family selection criteria included residence in the greater Boston area; mothers ⱖ14 years; absence of major maternal medical or psychiatric illness, chronic maternal medication treatment (eg, insulin, steroids, thyroid replacement, antidepressants, and anticonvulsants), or history of maternal substance abuse at any time (including alcohol or tobacco abuse); family accessibility by telephone; and some English-language facility. Infant criteria included gestational age at birth of 28 weeks 4 days to 33 weeks 3 days after mother’s last menstrual period; 5-minute Apgar score ⱖ7; weight and head circumference at birth appropriate for gestational age (ⱖ5th, ⱕ95th percentile26); normal initial cranial ultrasound(s), MRI, and/or electroencephalogram (EEG); ⱕ72 hours of mechanical ventilator support including continuous positive airway pressure; and ⱕ72 hours of vasopressor medication. Additional exclusion criteria included congenital or chromosomal abnormality, congenital or acquired infection (eg, HIV, sepsis, toxoplasmosis, rubella, cytomegalovirus, and herpes simplex), absence of prenatal care, known prenatal brain lesions (eg, cysts or infarctions), and neonatal seizures. The study-recruitment period extended over 28 months, from
May 1, 2000 through August 30, 2002. Ninety infants met study criteria. Of these, 12 families were not approached because of staff unavailability, and 45 families declined participation. The main reason given was the extensive nature of the outcome assessments. After successful entry into the study, 3 families failed to return for outcome assessment. In terms of background criteria, the families that were eligible but did not participate for the various reasons described were comparable with the families that participated. Although the participants represent only 33% of the population eligible in the course of the intake period, they nevertheless seem broadly representative. Figure 1 presents a flowchart of both the eligible and the studied infants, with reasons for nonparticipation shown.
Control and Experimental Group Experience Control group infants received the standard care practiced throughout the Brigham and Women’s Hospital NICU at the time of study, which included an effort at primary care nursing and staff-dependent inconsistent parent inclusion. The standard developmental protocol of the NICU involved uniform shielding of incubators with white hospital blankets, early use of dressing in T-shirts, and side and foot rolls; liberal provision of pacifiers; and inconsistent nurse-dependent encouragement of skin-to-skin holding (kangaroo care) and breastfeeding. No formal effort was made to prevent spillover and contamination effects from experimental to control group care. Therefore, significant experimental effects identified by definition were conservative, because they had to be in excess (ie, go beyond the inevitable spillover) of care contamination by the experimental treatment provided in the same NICU and cared for at the same time as control group infants. The individualized intervention consisted of daily (7 days a week) observations and evaluations of the experimental group infants’ behavior, with suggestions for parents and staff in terms of ways to support each infant’s development. The framework of developmental care views preterm infants as fetuses who find themselves too early and unexpectedly in a technologic hospital environment instead of the evolutionarily promised mother’s womb. Developmental care emphasizes the behavioral individuality of each infant. Each infant is seen as an active participant in all care. Each family is valued as the infant’s most consistent nurturer and most important advocate. Developmentally supportive care seeks to reduce the discrepancy between womb and NICU environment by taking into account the individual infant’s current thresholds of behavioral organization, diminishing stress, and supporting each infant’s strengths and competencies. This means assuring restfulness, calm breathing and well modulated color; a well-functioning, calm digestive tract; well-modulated face, extremity, and trunk tone; comfortable restful positions; and slowed tempo of all caregiving procedures, individualized adjustment of all timing and implementation of procedures, and provision of
Fig 1. Subject-selection process.
ARTICLES
847
well-supported relaxation periods. The developmental specialist team, trained to reliability and experienced in the use of the NIDCAP approach,27 included a developmental psychologist and a developmentally trained neonatologist. They provided the intervention-group infants’ weekly observations and daily contact with the infants’ current caregivers, ensuring continuity and consistency of developmental care. In addition, they provided ongoing support for the care teams and parents in jointly planning and implementing individually supportive care. Special problem solving around staff consistency and parent support with input by the developmental specialists for the experimental group infants was facilitated by the NICU’s nurse managers and medical directors. A group of 25 nurses was “recruited” before the start of the study to volunteer for developmental care training and caregiving for the experimental infants. They were comparable in age and years of experience with the NICU nursing staff as a whole and included very young and recently hired as well as senior long-term staff members. The developmental specialists provided daily contact and support for the caregivers in understanding the experimental group infants’ stress and comfort signals, adjusted their care accordingly, and conceptualized the infants as active participants in the care delivered. The developmental specialists formally observed each infant’s behavior weekly throughout the hospitalization, starting with the phase of the infant’s initial stabilization and then every 7 days throughout hospital discharge and to 2 weeks’ corrected age. For each observation, the developmental specialist systematically recorded an infant’s behavior for ⬃20 minutes before a planned medical or nursing caregiving interaction and continued to observe throughout the duration of the interaction and for ⬃20 minutes beyond the caregiving interaction. Ninety-one behaviors, including autonomic (breathing, heart rate, color changes, and visceral signs), motor (postures, muscle tone fluctuations, and movements), and state organization behaviors (levels of arousal, patterns of transitions between states, and clarity and robustness of sleep and awake states) were monitored every 2 minutes. Behaviors were conceptualized as stress (eg, flaccidity, agitated or frantic movements, hyperextensions, duskiness, respiratory pauses, gagging, spitting up, finger splaying, arching, gaze aversion, etc) and regulatory (eg, hand to mouth, hand clasping, grasping, efforts to suck, tucking, etc) and interpreted as indices of the infants’ current vulnerabilities and strengths, respectively. The developmental specialists used the observations to formulate descriptive neurobehavioral reports and suggestions, to structure caregiving procedures to the infant’s sleep/wake cycle, and to maintain the infant’s well-regulated behavioral balance in an effort to promote the infant’s strengths and simultaneously to reduce the infant’s self-regulatory vulnerability. For example, some infants became aroused and agitated easily and struggled during care, whereas others become limp and lethargic. In these situations, suggestions included gently helping the infant tuck into a more curled up position to promote maintenance of motor tone, energy, and restfulness; gently swaddling the infant with a soft blanket or bedding the infant tucked in a soft, comfortable, individually sized, well-fitting bunting; supportively holding into a tucked position and cradling in the caregiver’s hands a vulnerable infant whose breathing easily became labored and/or whose color fluctuated quickly or an infant who paled out, became easily dusky, or began to gag or hiccough during taxing manipulations; supporting restful return to sleep by gently bedding the infant curled up on his or her side; supporting the infant by soft, individually adjusted bedding; bathing the infant swaddled in a soft blanket in deep, warm water; weighing the infant gently swaddled; including a second caregiver to support the infant during stressful procedures such as suctioning, chest radiographs, and cranial ultrasounds; increasing darkness and quiet for the infant; and, from early on, supporting the parents in caring for their infant, nursing, and holding their infant in skin-to-skin closeness and/or cradle their infant during stressful and difficult procedures. Staff members were encouraged to offer parents comfortable recliner chairs (available as part of the study) in which to relax and hold and sleep with their infant in restful, skin-to-skin contact for prolonged periods of time. Several accessories specifically designed to support the experimental group infants when in the incubator or crib included natural sheepskins, terry cloth buntings, soft, special-sized, appropriate body and hugging pillows, and soft, special pacifiers. Furthermore, parents were encouraged to personalize their infant’s bed area. To provide a
848
EARLY EXPERIENCE
soothing atmosphere with muted indirect lighting and the impetus to approach calmly, parents and staff were encouraged to make use of custom-made, attractive “privacy screens” consisting of polished wood frames and soft-colored cloth panels as well as specially designed coordinated soft-colored cloth crib canopies with bows and ribbons.9 These materials supported the development of soothing bedside islands in the midst of an otherwise large, very active, and often hectic NICU.
Medical/Demographic Background and Medical Outcome Medical information derived from the infants’ NICU and community hospital charts was abstracted in double-blind fashion by the study’s pediatrician, who was completely unfamiliar with the identity of the infants and families. The information was coded into a priori-defined variables. Demographic and parent/infant medical history information not accessible from the medical records was obtained by parent interview, also in double-blind fashion, by the study’s senior psychologist, who was kept naive to family and infant identity. Because randomization was used, it was hypothesized that control and experimental groups would be comparable in terms of medical and demographic background. On the basis of the earlier study of developmental care for low-risk, appropriate-for-gestational-age preterm infants,10 it was also hypothesized that there would be no differences between the 2 groups in medical outcome. Although the current study’s infants were selected to be, on average, younger at birth than the infants in the earlier study, they nevertheless were selected to have only very early (⬍72 hours) transient medical issues and were all born to healthy mothers, had grown well in the womb, and were considered medically at low risk. Given their early gestational age (28 –33 weeks), some of the infants, as would be expected for this population, required several weeks of supplemental oxygen and supportive gavage feedings before being fully weaned to the breast (or, in some cases, a combination of breast and bottle).
Measurement of Developmental Care Experience Consistency of the developmental care experience for the experimental group infants was measured by percent of weekly developmental care observations completed and by the number of nursing shifts staffed by developmentally skilled nurses. To arrive at this determination, all formal care observations resulting in written reports were tabulated by infant, compared with the infant’s number of weeks from birth to 2 weeks’ corrected age, and expressed as a percentage. Additionally, nursing staff was assigned a score of 1 or 2, reflecting the degree to which their caregiving conformed to the criteria of the developmental care program guidelines.27 Two independent raters familiar with the developmental care guidelines and the nursing staff’s care practices performed the ratings. Each child’s care was subsequently described in terms of percent time of total hospital duration cared for by a developmentally skilled nurse. At the time of recruitment of an experimental group infant into the study, a great effort was made to schedule a developmentally skilled nurse to that infant for each caregiving shift.
Neurobehavioral Outcome Measures at 2 Weeks’ and 9 Months’ Corrected Age Two neurobehavioral assessments were used at 2 weeks’ corrected age: the Assessment of Preterm Infants’ Behavior (APIB)4,28 and the Prechtl Neurologic Examination of the Fullterm Newborn Infant (Prechtl).29 For all assessments performed at 2 weeks’ and 9 months’ corrected age, the evaluator was blind to the study group of the infant. The APIB is a widely used behavioral assessment specifically designed for the documentation of the full spectrum of term as well as preterm newborn infants’ neurobehavioral functioning. The assessment presents increasingly demanding environmental inputs in a graded sequence of distal and proximal stimulus presentations. Quantification includes measurement of the level of differentiation and modulation of various behavioral subsystems including the autonomic, motor, state, attention interaction, and self-regulation systems, which are defined as reflections of the infant’s pattern of current behavioral organization and integration. The APIB yields 6 main variables (overall system scores) and 24 additional variables.30 The 6 main variables range in score from
1 to 9. The lowest 3 scores (1–3) denote degrees of well-modulated and well-organized behavioral regulation, reflective of high thresholds of transition from good modulation to disorganization and stress; the highest scores (7–9) denote easily disorganized, poorly modulated behavioral regulation, reflecting low and very low thresholds to disorganization and stress. Well-functioning infants between 10 and 30 days’ corrected age are expected to respond in the 1 to 3 range.6 The 6 main system variables were used for analysis (for details of specific variable construction see refs 7 and 8). The Prechtl is a well-known neurologic evaluation of the newborn at term. It was reduced to 12 summary variables,10 which were used for analysis. The variables assess functions such as syndromes of reactivity and thresholds of functioning. Additionally, in a separate analysis, 8 APIB/Prechtl factor scores were examined as outcome measures. They were generated for the current independent population based on the rules established by principal components analysis with Varimax rotation in a large study of 312 preterm and term infants examined with the APIB and Prechtl at 2 weeks’ corrected age.5 The current study’s subjects were not included in the analysis of the 312 infants. The 8 APIB/Prechtl factors resulting from the large independent sample had explained 67.62% of the total variance in the large population and showed good electrophysiological group differentiation.6 It was hypothesized that the experimental group compared with the control group in the current small sample would perform significantly better on the 6 APIB and 12 Prechtl scores and on the 8 factor scores. At 9 months’ corrected age, the infants were assessed in terms of growth (weight, height, and head circumference) and with the Bayley Scales of Infant Development, Second Edition (Bayley II),31 which yield a mental developmental index (MDI) and psychomotor developmental index (PDI) (both with a mean of 100 and an SD of 15) age-equivalent scores, and 4 factor scores (percentile) derived from the Behavior Rating Scale (BRS; orientation/engagement, emotional regulation and motor quality, and BRS total score). Growth was expected to be comparable between the 2 groups. The Bayley II measures were hypothesized to be significantly better for the experimental group than for the control group. Two independent examiners, who were naive as to the infants’ backgrounds and group status, assessed the infants. All assessments were performed at the Neurobehavioral Studies Laboratory at Children’s Hospital Boston in a quiet, private, light-controlled, and comfortable examination room. All assessments were videotaped for later reliability assessment. The examiners maintained periodically assessed interexaminer reliability of ⬎90% scoring agreement per evaluation. The APIB/Prechtl assessments were scheduled 1 hour before an infant’s anticipated next feeding; the Bayley II assessments were typically in the morning between 9:30 am and 11:00 am, at a time the infants’ parents judged to be optimal for their infants’ best alert and play time. The parent(s) were present throughout all examinations. The APIB and Prechtl as well as the Bayley II variables derived from the assessments were coded by 1 of 2 experienced coders. All coding was double checked for accuracy by an independent research coordinator familiar with the instruments.
Neurophysiologic Outcome Measures All infants were additionally assessed neuroelectrophysiologically (EEG) on the same day after the neurobehavioral assessment. Sleep EEG cortical spectral coherence data were evaluated for the study. Infants were evaluated during quiet sleep, verified by constant EEG monitoring. In EEG, quiet sleep is recognized as the most stable state and therefore was chosen as the best condition for obtaining an estimate of the brain’s resting functional architecture. Spectral analysis, in this case coherence analysis, represents the average of architecture of connectivity over a period of at least 15 minutes, which serves to average random variations second to second and minute to minute. Thus, spectral coherence data accurately reflect the landscape of cortical-cortical connectivity during quiet sleep. Cortical spectral coherence between 2 EEG electrodes is generally taken as a measure of cortical coupling between the brain areas underlying the electrodes. Coherence assesses the neural function responsible for complex cognitive and affective regulatory processes.33– 41 In the current study, the EEG spectral coherence data at 2
weeks’ corrected age of the 30 study infants were represented electrophysiologically by 40 coherence factors, derived from an independent large population.5 All coherence data available per subject of the large sample of 312 infants with varying medical backgrounds had been entered into a principal components analysis, followed by Varimax rotation. By use of an algorithm based on singular value decomposition, 3040 coherence variables from trace´ alternant sleep formed 40 coherence factors, which accounted for 65% of the variance. These factors, which successfully predicted gestational age at birth, degree of medical compromise, and newborn behavioral factors,6 were used in the current study. A registered EEG technologist and infant-behavior specialist, both with extensive infant experience, gathered the EEG data at the Developmental Neurophysiology Research Laboratory at Children’s Hospital Boston. The EEG was monitored continuously during data collection. Data were obtained from 20 scalp electrodes with linked ear reference. After amplification (Neuroscan Synamps, El Paso, TX), data were digitized at 250 Hz and were band pass filtered from 1 to 100 Hz. Subsequent analyses were limited to artifact-free segments of quiet sleep, delineated by a senior electroencephalographer naive to subject identity. Limiting analysis to infant quiet sleep assured freedom from movement and eye-blink artifact. A minimum of 180 seconds of EEG was analyzed to compensate for the minimally residual trace´ alternant pattern, a potential instability still noted at 2 weeks’ corrected age. Creation of log-corrected coherence data, using the Laplacian reference,41 and derivation of factor scores were performed as detailed.5
Neurostructural Outcome Measures MRI provides several quantitative methods to search for brain structural changes underlying functional differences. All MRI was performed at Children’s Hospital Boston on a 1.5-T General Electric scanner operating at the LX 8.3 hardware/software configuration (GE Medical Systems, Milwaukee, WI). Scanning was performed during a single scanning session after behavioral and EEG data acquisition on the same day. The 2 MRI methods used were transverse relaxation time (T2*) and diffusion tensor imaging (DTI). The T2* measurements were made by using a spoiled gradient echo sequence acquiring 5 axial 7-mm-thick slices through the middle of the cerebral hemispheres. The repetition time was fixed at 100 milliseconds, and data sets were acquired at echo-time values of 7, 24, 48, 64, and 91 milliseconds. The total scan time for the T2* measurement was ⬃5 minutes. The T2* values were calculated at selected regions of interest (ROI) from monoexponential fits of the signal decay with echo time. T2* has been demonstrated to decrease as the brain matures,42 making it a potentially useful index for comparison of brain development between the experimental and control groups. Four ROI were selected a priori for measurement: frontal white matter, considered the locus of attention regulation and executive function; thalamus, an early maturing structure; and the medial and lateral occipital lobes, given the challenge of premature visual processing in early born infants and the subsequent spatial visualization and visual-motor difficulties, respectively, in preterm children at later ages.43,44 For the T2* analysis, all ROI were circular, 5 mm in diameter, and placed manually in 4 locations according to anatomic landmarks as agreed on by the same 2 experienced neuroimaging investigators, who placed all regions. It was hypothesized that frontal white matter as well as the medial and lateral occipital lobes might show differences in favor of the experimental group. The second methodology chosen was DTI, which was performed with a line scan diffusion imaging sequence45 using a repetition time/echo time of 2500/70 milliseconds, a field of view of 24 cm, b factors46 of 5 and 750 seconds/mm2, and 48 columns per slice, with a 24 ⫻ 12-cm field of view and columns oriented posterior to anterior. The 6 gradient directions sampled were 1,1,0 (⫺1,1,0), 1,0,1 (⫺1,0,1), and 0,1,1 (0,⫺1,1). Five to eight 6-mm-thick axial slices were typically sampled with total DTI scan times between 6 and 8 minutes. Acquired images could be manipulated to obtain all the elements of the diffusion tensor and related quantities on a pixel-by-pixel basis. DTI yielded 3 orthogonal eigenvectors and their corresponding eigenvalues: the principal eigenvalue (E1) represents the maximum diffusion along the fiber tract axis as indicated by the prin-
ARTICLES
849
cipal eigenvector, and the secondary and tertiary eigenvalue (E3) represent diffusion transverse to the fiber tract axis. The rotationally invariant ratio of E1/E3 extracted from the diffusion tensor image is a shape descriptor of the diffusion tensor ellipsoid and can be thought of as an index associated with the myelin sheath development of the underlying white matter fibers. Another index commonly used is the relative anisotropy (RA), which is a more rotationally invariant measure of the diffusion anisotropy. RA is calculated as a percentage with the equation
冑3 RA ⫽ 冑2
1 D ⫺ 3 trace 共D兲I
Trace 共D兲
where D is the trace of the diffusion tensor and I is the identity matrix. Both E1/E3 and RA were determined at 4 ROI chosen a priori: frontal white matter, the left and right internal capsules, and corpus callosum. The ROI for each location was hand drawn by using neuroanatomical markers as seen on the apparent diffusion coefficient maps and the diffusion-weighted images. All ROI for DTI analysis were determined by the same 2 experienced neuroimaging investigators working together, who took great care to ensure that all ROI for a particular location were of comparable size and shape. All infants were scanned unsedated, asleep, and positioned comfortably in a specially designed vacuum pillow used to stabilize head position. All infants wore effective ear protection to muffle the magnet’s sounds. Cardiac function and blood oximetry levels were monitored (MR Equipment Corp, Bay Shore, NJ) throughout the study. Resuscitation equipment and personnel were available at all times. No untoward events were encountered at any time in the course of the study. All infants were accompanied by 1 of their parents and a skilled behavioral professional. The project’s pediatric neuroradiologist reviewed each scan and provided the institution-required clinical report.
Data Analysis All statistical analyses were performed by using BMDP software.47 Medical and demographic background and medical/ growth outcome continuous variables were submitted to respective multivariate analysis of variance (MANOVA), with subsequent univariate analysis of variance using Holm’s48 method of correction for multiple comparisons. To account for unequal variances, the Browne Forsythe test of variance (F*) was uniformly
TABLE 1.
used. Categorical variables were submitted to 2 test with Yates’ correction.47,49 For all analyses, an a priori probability level of P ⱕ .05 (2-tailed) was selected. The sample size chosen assures detection at a .05 probability level, with medium to large effects accounting for between 23% and 69% of the variance.50 Because no significant group effects favoring the experimental group were identified in the medical and demographic background or in the medical/growth outcome measures, the behavioral, electrophysiological, and neurostructural outcome measures were submitted to analysis as outlined. Given the sample size of 30 infants compared with the set of 40 EEG coherence factors,5 discriminant function analysis was restricted to use of the first 20 coherence factors for hypothesis testing. In a separate analysis, the second 20 coherence factors were explored. Wilks’ 51 was calculated, and jack-knifed52,53 classification was performed to ascertain 2-group classification success. Canonical correlation analysis was used to explore the relationship among the behavioral, electrophysiological, and neurostructural domains. Three canonical correlations54 were performed for each of 2 sets of variables, namely the behavioral factors with the coherence factors, as well as each of these with the (E1/E3) DTI measures.
RESULTS
Age at assessment was comparable for both groups at 2 weeks’ corrected age as well as at 9 months’ corrected age (2 weeks: control mean ⫽ 21.00 days’ corrected age [SD: 8.80]; experimental mean ⫽ 17.19 days’ corrected age [5.99]; F ⫽ 1.87; degrees of freedom [df] ⫽ 1,22; P ⫽ .19; 9 months: control mean ⫽ 9.36 months’ corrected age [0.34]; experimental mean ⫽ 9.27 months’ corrected age [0.23]; F ⫽ 0.67; df ⫽ 1,21; P ⫽ .42). All 30 subjects had complete medical and demographic background review along with neurobehavioral assessment at 2 weeks’ corrected age. The groups were comparable on the medical and demographic background, including pregnancy and delivery indices, as shown in Table 1. Apgar score at 5 minutes favored the control group (8.5 [0.5] vs 7.9 [0.8]; P ⫽ .02). Because the
Medical and Demographic Background Variables Variable
Control (n ⫽ 14)
Experimental (n ⫽ 16)
Gestational age at birth, wk Birth weight, g Birth weight, percentile Head circumference, cm Head circumference, percentile Apgar scores 1 min 5 min* No. of days mechanical ventilation Fio2, first 48 h, mean SNAP-PE55 NTISS56 Maternal age, y Obstetric Complication Scale57 Prenatal corticosteroids: yes/no Vaginal deliveries: yes/no Patent ductus arteriosus: yes/no Surfactant: yes/no Gender, no. males/females Caucasian, Black, Hispanic, Other Firstborn, laterborn Social class: I and II, III, IV and V58 Parents married/attached: yes/no
31.83 (1.47) 1730 (350) 37 (22.0) 36.70 (0.75) 41 (23.1)
31.22 (1.39) 1648 (232) 44 (18) 36.75 (1.18) 46 (27)
7.27 (1.68) 8.50 (0.52) 1.79 (1.89) 0.24 (0.04) 7.36 (3.62) 11.14 (3.66) 31.57 (6.85) 68.36 (14.5) 13, 1 4, 10 1, 13 5, 9 9, 5 8, 3, 1, 2 7, 7 9, 4, 1 14, 0
7.0 (1.1) 7.88 (0.81) 1.19 (1.52) 0.24 (0.05) 8.00 (4.38) 13.31 (6.51) 32.44 (6.50) 66.38 (12.60) 11, 5 6, 10 2, 14 4, 12 10, 6 15, 0, 0, 1 10, 6 12, 3, 1 16, 0
Summary analysis: MANOVA: F ⫽ 1.74; df ⫽ 20,8; P ⫽ .21. Data shown are means (SD). As expected, none of the variables differed significantly at P ⬍ .05 except for that indicated with an asterisk, which varied at P ⫽ .02. SNAP-PE indicates Score for Neonatal Acute Physiology-Perinatal Extension; NTISS, Neonatal Therapeutic Intervention Scoring System.
850
EARLY EXPERIENCE
direction of the difference made the results more conservative, covarying on later analyses was not performed. All head ultrasounds and baseline MRI and EEG studies, specially performed to assure infant’s brain intactness before onset of experimental intervention, were read as normal by the 2 independent radiologists and the senior electroencephalographer, respectively, who were all naive as to the infants’ group status. As was hypothesized, because both groups were of relatively low medical risk, none of the medical or growth outcome measures showed significant group differences. The control and experimental group infants were discharged from the hospital after 32 (17) and 40 (19) days, respectively, at a mean age after mother’s last menstrual period of 36.4 (1.6) and. 36.9 (1.8) weeks, respectively (ie, well before the expected due date). At 2 weeks’ and 9 months’ corrected age, there was no significant weight (g), height (cm), or head circumference (cm) difference between the 2 groups, nor was there any other difference, as Table 2 shows. Review after hospital discharge of all head ultrasounds revealed a questionable grade 1 intraventricular hemorrhage for 1 of the experimental group infants. However, both groups were considered clinically neurologically normal and healthy at the 2 weeks’ and 9 months’ corrected age outcome points. Developmental Care Experience
The developmentalists’ weekly observations and reports, as well as their feedback and support to the parents and the caregiving staff, were conducted with 100% consistency. Additionally, the experimenTABLE 2.
tal group infants were cared for by nurses rated as developmentally skilled for more hours/shifts in the course of their hospitalization than the control group infants (control: mean ⫽ 38% [9.9]; experimental: mean ⫽ 53% [12.8]; F ⫽ 11.06; df ⫽ 1,18; P ⫽ .004). Behavioral Outcome
Experimental group infants showed significant improvement in neurobehavioral outcome (APIB and Prechtl)4,29 in terms of the 6 APIB system scores, as well as the 12 Prechtl variables, as the 2 significant MANOVA indicate. Two APIB variables (motor system modulation and self-regulation) and 6 Prechtl scores were individually significant between the 2 groups, as Table 3 shows. The 8 APIB/Prechtl factor scores also showed overall significant differences by MANOVA (F ⫽ 4.88; df ⫽ 8,21; P ⫽ .0017). Factors 2 and 3 differed significantly individually. Factor 2 represents a broad motor organization factor and is almost exclusively contributed to by APIB variables (P ⬍ .0004). Factor 3, an intensity of reaction and hypersensitivity factor, is exclusively contributed to by Prechtl variables (P ⬍ .00001). At 9 months’ corrected age, 6 infants (1 control and 5 experimental) did not return for assessment because of family scheduling conflicts. The returning experimental group children continued to show significantly better performance than the control group children. MDI and PDI as well as the BRS scores (emotional regulation, motor quality, and total score) differed significantly in favor of the experimental group infants, as analyzed by MANOVA. (The Bayley II scores, aside from the mean MDI and PDI
Medical Outcome Variables at 2 Weeks’ and 9 Months’ Corrected Age Variable
Medical outcome at 2 weeks’ corrected age Average daily weight gain (birth to 2 weeks), g No. of days on oxygen No. of days before bottle feeding Age after last menstrual period at discharge, wk No. of days in hospital Pediatric Complication Scale59 (mean ⫽ 100 ⫾ 20) Weight, g Weight, percentile Length, cm Length, percentile Head circumference, cm Head circumference, percentile Pneumothorax: none, mild, moderate* Intraventricular hemorrhage: none, grade I* Bronchopulmonary dysplasia: none, mild, severe* Retinopathy of prematurity: no, yes Medical outcome at 9 months’ corrected age Weight, g Weight, percentile Length, cm Length, percentile Head circumference, cm Head circumference, percentile
Control (n ⫽ 14)
Experimental (n ⫽ 16)
P
34 (6) 5.57 (12.46) 20.93 (11.34) 36.44 (1.64) 32.21 (16.6) 63.50 (10.23) 4095 (518) 59 (29) 52.27 (2.67) 46 (33) 36.70 (0.74) 62 (18) 12, 1, 1 14, 0 13, 1, 0 14, 0
32 (5) 12.25 (20.50) 28.44 (15.3) 36.94 (1.84) 40.0 (18.50) 65.63 (9.10) 3999 (400) 56 (26) 52.46 (4.21) 51 (20) 36.75 (1.12) 65 (27) 16, 0, 0 15, 1 13, 2, 1 16, 0
.17 .29 .14 .44 .24 .56 .58 .75 .81 .63 .89 .76 .29 .34 .55 —
9123 (1409) 49 (30) 71.91 (3.55) 48 (33) 45.62 (1.25) 50 (28)
9132 (988) 46 (28) 72.00 (1.85) 44 (24) 46.09 (1.14) 60 (31)
.99 .81 .94 .74 .34 .40
Summary analysis at 2 week’s corrected age (MANOVA): F ⫽ 0.45; df ⫽ 13,10; P ⫽ .91 (using Holm’s correction); summary analysis at 9 months’ corrected age (MANOVA): F ⫽ 0.46; df ⫽ 3,20; P ⫽ .72 (using Holm’s correction). Data shown are means (SD). * Severity of pneumothorax, intraventricular hemorrhage, and bronchopulmonary dysplasia were derived from chest radiographs and head ultrasounds by double-blind review by an independent pediatric radiologist not involved in the care of the subjects.
ARTICLES
851
TABLE 3.
APIB System4 and Prechtl29 Scores at 2 Weeks’ Corrected Age Variable
APIB system scores Autonomic system Motor system State system Attention system Self-regulation system Examiner facilitation Prechtl scores Trunk and limb posture (0–6) Motility (0–2) Pathological movements (0–11) Motor system tone (0–2) Intensity of responses (0–2) Threshold of responses (0–1) Moro response (0–2) State stability (0–1) Crying (0–2) Hemisyndrome (0–14) Syndromes abnormal reactivity (0–2) Total Prechtl (percent abnormal)
Control (n ⫽ 14)
Experimental (n ⫽ 16)
P
5.56 (1.41) 6.29 (1.01) 5.22 (1.34) 6.91 (1.83) 6.11 (1.26) 6.89 (1.76)
4.59 (1.26) 4.70 (1.23) 4.62 (0.90) 6.54 (1.69) 4.94 (1.07) 5.74 (1.67)
.06 .001‡ .12 .58 .01† .08
2.21 (1.31) 1.07 (0.48) 3.79 (1.48) 1.00 (0.00) 0.85 (0.36) 0.85 (0.36) 1.47 (0.75) 0.86 (0.63) 0.93 (0.48) 2.32 (2.27) 1.16 (0.62) 38.30 (9.55)
0.81 (1.05) 0.50 (0.73) 1.50 (1.46) 0.63 (0.62) 0.25 (0.45) 0.44 (0.51) 0.38 (0.62) 0.38 (0.50) 0.69 (0.48) 1.50 (2.56) 0.56 (0.73) 17.33 (15.52)
.004* .02 .002* — .0004† .02 .002* .005* .18 .36 .03 .0001†
Shown are APIB system scores at 2 weeks’ corrected age (range: 1–9; lower scores denote more appropriate responses) and Prechtl scores (ranges shown in parentheses; lower scores denote more appropriate responses). MANOVA for the APIB: F ⫽ 3.19; df ⫽ 6,23; P ⫽ .02; MANOVA for the Prechtl: F ⫽ 3.35; df ⫽ 12,17; P ⫽ .01. Data shown are means (SD). Probabilities in bold type indicate significant differences (Holm’s correction). * P ⬍ .05; † P ⬍ .01; ‡ P ⬍ .001.
scores, are also represented in terms of MDI and PDI score frequency distribution above and below the Bayley II mean score of 100, as well as in the form of standardized percentile scores and age equivalents, to aid in interpretation of the MDI and PDI group differences. These additional score representations did not enter the MANOVA [see Table 4].) The results indicated significant neurofunctional improvement in terms of behavioral intactness and modulation of functioning. This is in keeping with previously identified results for medically low-risk preterm infants10 and is documented here for infants who were gestationally younger at birth. Furthermore, the findings are extended beyond the 2 weeks’ corrected age point to 9 months’ corrected age. TABLE 4.
Neurophysiological Outcome
All 30 subjects had complete EEG spectral coherence study data at 2 weeks’ corrected age. Discriminant function analysis using the first 20 coherence factors identified 4 coherence factors as significantly differentiating the control from the experimental group infants (Wilks’ ⫽ 0.45; F ⫽ 7.69; df ⫽ 4,25; P ⫽ .0001). Jack-knifed classification success using these 4 variables showed 83% correct subject classification.52,53 Misclassified were only 2 control and 3 experimental group subjects. The 4 successfully discriminating variables included coherence factors 7, 10, 11, and 19 (depicted in Fig 2). The intervention group demonstrated increased coherence in the fast ␣ and the  frequency bands
Bayley II31 at 9 Months’ Corrected Age Variable
Mental scale MDI MDI ⬍ 100/ⱖ 100, percentile Percentile Age equivalent, mo Motor scale PDI PDI ⬍ 100/ⱖ 100, percentile Percentile Age equivalent, mo BRS, percentile Orient/engagement Emotional regulation Motor quality Total score
Control (n ⫽ 13)
Experimental (n ⫽ 11)
P
94.85 (9.22) 69/31 39 (20) 8.39 (1.19)
109.55 (7.23) 9/91 72 (15) 10.27 (0.79)
.0002‡ .003† .0002‡ .0001‡
89.23 (14.88) 77/23 31 (21) 8.00 (1.53)
107.00 (9.28) 9/91 67 (20) 9.91 (0.70)
.002† .003† .0004† .0009†
57 (28) 39 (27) 23 (22) 39 (23)
71 (22) 67 (23) 57 (32) 73 (16)
.19 .01* .007* .0004†
MANOVA of MDI, PDI, and 4 BRS: F ⫽ 3.59 (2-tailed); df ⫽ 6,17; P ⫽ .017. Data shown are means (SD). Probabilities shown in bold type indicate significant differences (Holm’s correction). MDI and PDI: mean ⫽ 100; SD ⫽ 15. * P ⬍ .05; † P ⬍ .01; ‡ P ⬍ .001.
852
EARLY EXPERIENCE
Fig 2. EEG coherence measures at 2 weeks’ corrected age: control (n ⫽ 14) versus experimental (n ⫽ 16). Shown are 4 heads, each corresponding to a used coherence factor, top view, scalp left to image left. Each shows the maximal loadings (correlations) of original coherence variables on the indicated factor. An index electrode and frequency are printed above each head. Colored regions indicate location, magnitude, and sign (red: positive; blue: negative) of maximally loading coherences on the factor. Arrows also illustrate coherence variables; however, the arrow color compensates for signs of factor loadings on subsequent, statistically derived canonical variates, thus illustrating how original coherence variables differ between experimental (red: increased; green: decreased) and control infants.
between left frontal regions and occipital and parietal regions (factors 7, 10, and 19), whereas midline central to occipital coherence was reduced (factor 11) in the experimental group. The NICU experimental experience, as hypothesized, indicated changes in functional connectivity between brain regions, with preferentially broad enhancement of frontal to occipital coherence, and some pruning of central to occipital coherence. The enhancement of coherence between left frontal to parietal regions was unexpected. Neurostructural Outcome
T2* data were acquired and analyzed for the first 10 study infants only (first 5 control and first 5 experimental) in preliminary exploration of the use of this measure as a potentially effective index of degree of brain organization. Heretofore T2* had only been explored as an indicator of age-dependent brain maturation. The MANOVA of the 4 variables measured (frontal white matter, median occipital lobe, lateral occipital lobe, and thalamus) was not significant (F ⫽ 1.96; df ⫽ 4,5; P ⫽ .24). Although the overall MANOVA was not significant, exploratory comparison of the 4 individual variables, with Holm’s correction for multiple comparisons, revealed an overall trend in favor of the study’s hypothesis. T2* values were reduced in frontal white matter (P ⫽ .08), median occipital lobe (P ⫽ .05), and
lateral occipital lobe (P ⫽ .07) for the experimental group infants. This trend, as had been predicted, was not observed for the thalamus measurement (P ⫽ .80). The small subject number may account for the failure of the MANOVA to reach significance. For 23 subjects (8 control and 15 experimental), artifact-free, complete DTI data sets were available. Table 5 shows the group comparisons for RA and for the ratio of E1/E3 for the respective delineated ROI. Results by MANOVA indicate significant overall improvement in RA, with specific trends in the regions as predicted (frontal white matter, right internal capsule, and left internal capsule). Evidence was stronger when testing E1/E3 than when testing RA. MANOVA for E1/E3 was significant. The individually significant regional difference observed pertained to E1/E3 for the left internal capsule. These MRI results obtained provide the first evidence of significant difference in brain structure resulting from developmental intervention, which means from sensory experience of the very immature brain. As a demonstration example, Fig 3 shows the comparison of a control and an experimental group infant at 2 weeks’ corrected age. Canonical correlations between the 8 behavioral APIB/Prechtl factors and the 20 spectral coherence factors were highly significant (2 ⫽ 238.76; df ⫽ 160; P ⱕ .0001), with 1 pair of canonical variates considARTICLES
853
TABLE 5. Age
Magnetic Resonance DTI at 2 Weeks’ Corrected
Variable RA Frontal white matter Right internal capsule Left internal capsule Corpus callosum Ratio of E1/E3 Frontal white matter Right internal capsule Left internal capsule Corpus callosum
Control (n ⫽ 8)
Experimental (n ⫽ 15)
P
12.03 (2.76) 35.20 (6.98) 35.18 (4.30) 40.43 (11.79)
14.66 (4.52) 41.54 (7.14) 40.19 (5.31) 40.23 (12.69)
.10 .06 .03 .97
1.27 (0.08) 1.98 (0.25) 1.96 (0.13) 2.18 (0.55)
1.35 (0.13) 2.25 (0.34) 2.17 (0.21) 2.17 (0.52)
.09 .05 .008* .99
Higher scores represent more mature fiber tract development. MANOVA for RA: F ⫽ 2.85 (2-tailed); df ⫽ 4,18; P ⫽ .05; MANOVA for the ratio of E1/E3: F ⫽ 2.88 (2-tailed); df ⫽ 4,18; P ⫽ .05. Data shown are means (SD). Probabilities in bold type indicate significant differences (Holm’s correction). * P ⬍ .05; † P ⬍ .01; ‡ P ⬍ .001.
ered significant. Examination of loadings on these canonical variates suggested that greater behavioral function symmetry, better motor organization, and better expression of attention (behavioral factors 5, 2, and 7, respectively) were associated with increased frontal-occipital 12-Hz coherence, signifying increased connectivity, and reduced midline occipitalparietal 10-Hz coherence, signifying reduced connectivity (coherence factors 17 and factor 9, respectively) (Fig 25). The canonical correlation between the 8 behavior factors and 4 DTI measures also was significant (2 ⫽ 52.19; df ⫽ 32; P ⱕ .0135), with 1 pair of canonical variates considered significant. The overall pattern suggested that better, ie, less behavioral, hypersensitivity and lower intensity of reactivity (behavioral factor 3) were associated with a higher ratio of E1/E3 (ie, they were associated with more mature development in the left internal capsule and in frontal white matter). The canonical correlation between the 20 spectral coherence factors and the 4 MRI measures was very highly significant (2 ⫽ 726.81; df ⫽ 80; P ⱕ .00001), with 2 pairs of canonical variates considered significant. The first pair of canonical variates demonstrated that increased left frontal to left posterior quadrant 18-Hz coherence (factor 14) (Fig 25) correlated with a greater left internal capsule and frontal white matter E1/E3 ratio, indicating greater maturity in these regions. The second association demonstrated that increased left posterior temporal to right occipital 26-Hz coherence (factor 18) (Fig 25) correlated with a higher right internal capsule E1/E3 ratio, again indicating greater maturity. These results demonstrated a strong relationship among the 3 data domains for this sample of low-risk preterm infants, which speaks to the sensitivity and meaningfulness of the measures chosen. DISCUSSION
The current study is the first investigation to test the effect of developmental intervention in the NICU on neurobehavior, electrophysiology, and brain structure. The study’s results consistently favor the experimental group infants who received developmental care at an apparently sensitive period in brain 854
EARLY EXPERIENCE
development. It may be concluded from these results that experience before term may alter not only brain function but also brain structure. The differences observed in brain structure appear to be consistent with the brain functional differences. The study supports the hypothesis that a developmentally based, individualized approach to care in the NICU is effective in supporting neurodevelopmental outcome of medically healthy, low-risk preterm infants by 2 weeks’ corrected age. It also supports the hypothesis that such improvements have lasting effects to 9 months’ corrected age, as judged by behavioral performance. Furthermore, the results validate previous research on the benefits of developmental care10,60 and broaden the generalizability of the effectiveness of developmental care in the NIDCAP model in terms of expanding the gestational age range beyond prior studies as well as the medical characteristics of the population studied.24 The preterm infants who received developmental care were better adjusted at 2 weeks’ corrected age. The differences involved motor system functions and self-regulation as well as a number of neurobehavioral aspects involving state stability, intensity, and threshold of responsiveness. EEG coherence measures indicated an orderly and conceptually consistent pattern of neurophysiologic differences, in keeping with the behavioral findings. The differences involved mainly the left frontal region and, to some extent, the occipital and parietal regions. The electrophysiological differences demonstrated significant correlations with the behavioral indices of improved motor system organization, symmetry, and expression of attention. The brain structural differences discovered also involved the left frontal region and the suggestion of occipital region involvement. Correlation of the brain structural measures (MRI) with the brain functional measures (behavior and spectral coherence) showed that improved behavioral regulation (less intensity and hypersensitivity) were associated with more mature frontal brain structural development. This may not be surprising, given that neuronal organization, especially in the frontal region, occurs late in the developmental sequence,61– 64 and previous studies of prematurity have indicated the frontal lobes’ differential vulnerability.6 The continuity of improvement to 9 months’ corrected age in terms of Bayley II scale mental, motor, and behavioral performance may justify cautious optimism for the continuity of enhanced long-term development for similar preterm infants, who may receive developmental care in the future.65 The availability of MRI makes feasible the examination of structural brain changes underlying the functional improvements obtained. The results of the study are consistent with the theoretical basis of the intervention tested and the study’s hypotheses. The developmental care model tested views the infant as an active participant who seeks ongoing caregiver support for self-regulation during the initial stabilization phase and in the course of continuing developmental progression. Individualized developmental care provided by the preterm infants’ parents in collaboration with their
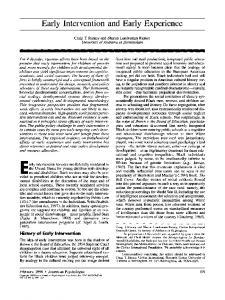
Fig 3. MRI DTI: comparison of control and experimental group infants at 2 weeks’ corrected age. Shown are examples of diffusion tensor maps from identical axial slices through the frontal lobes of a representative control group (A) and an experimental group (B) infant obtained at 2 weeks’ corrected age. In each example, the principal eigenvectors (shown in red and black) overlie the apparent diffusion coefficient (ADC) map to show anisotropy in white matter. The red lines denote eigenvectors located within the plane of the image, and the black dots indicate eigenvectors oriented mostly perpendicular to the image plane. The ratio of E1/E3 has been used as a threshold to show only eigenvectors at those voxels where E1/E3 exceeds a threshold value of 1.3 in both images. Note the greater anisotropy of white matter found in the experimental infant (B) as compared with the control infant (A) at the posterior limbs of the internal capsule (white arrows) and the frontal white matter adjacent to the corpus callosum (black arrows). The greater anisotropy found in the experimental infant (B) suggests more advanced white matter development in these regions as compared with white matter found in the control infant (A).
nursery care teams, and supported by a developmental specialist, may provide an extrauterine environment that supports cortical development by providing more stable autoregulation to the immature autonomic system in a challenging sensory environment by focus and consistent assurance of calm behavioral function in the course of all medical and daily care procedures.66 – 68 Chemical sedation to achieve stabilization of immature autoregulation69 may be substituted successfully at least in part by individualized modification and adaptation of care delivery in recognition of the infants’ behaviorally expressed stress thresholds. The differential enhancement of frontal regions identified in the current study seems to corroborate further the earlier findings of greater frontal vulnerability to unexpected environmental experience and stimulation. For preterm infants, even when medically at low risk, early birth nevertheless may trigger the onset of sensitive brain developmental periods. When the infants receive care that is structured individually based on their own thresholds to maintain
behavioral and therewith autonomic and motor system equilibrium as tested in this study, they seem to show improved outcome as compared with their peers who experience more standard care. Although the specific mechanisms are unclear at this point, it has been postulated that processes may involve resetting of the N-methyl-d-aspartate axis and consequent inappropriate cell death (apoptosis) with subsequent increased neurocitotoxic damage, lowered sensory and pain thresholds, and increased hyperreactivity and hypersensitivity.14 Other potential mechanisms, inferred from results of differential mothering and sensory experience experiments70 in animal models, suggest that variations in maternal care promote hippocampal synaptogenesis and spatial learning and memory through systems known to mediate experience-dependent neural development. Well-mothered rat pups showed increased expression of N-methyl-d-aspartate receptor subunit and brain-derived neurotrophic factor messenger RNA as well as increased cholinergic innervation of the hippocampus and enhanced spatial learning and ARTICLES
855
memory. Similarly, a study in the primate model maintained neocortical, experience-dependent synaptogenesis in a number of cortical areas.71 Aside from the lack of definitive knowledge as to the underlying mechanisms of the improvement in outcomes of the experimental group, additional limitations of the study include the relatively small total number of subjects, resulting from the extensive nature of the outcome assessments, and the substantial time commitment requested from the parents who participated in the study. The additional reduction of subjects in terms of some of the methodologies, given their technical complexity in acquisition of reliable and complete data, presents an added limitation to the study. Although medical, behavioral, and neurophysiological data sets were complete for all subjects, the MRI assessments were available on fewer subjects. For the T2* measures, the number of subjects was purposefully limited to the first 10 subjects to evaluate the merit of an untried methodology for the purpose of the question asked. The sample size for DTI data was reduced because of the insufficient quality of the raw MRI data acquired, which precluded reliable data analysis. Nevertheless, even with the smaller sample size, significant differences were found between the control and experimental groups. A larger sample of infants would be expected to yield even more significant results. An additional limitation of the MRI data are the investigator-dependent, operator-driven delineation of ROI chosen for analysis, which potentially might enter a degree of subjectivity into the data analysis. Automated, empirically validated, computer-driven region delineation would be more desirable, yet such technology is not available as yet for newborn structural brain image analysis. An additional limitation of the study is the shortterm nature of the outcome points of 2 weeks’ and 9 months’ corrected age. It will be important to investigate whether the improvements found at these ages (behavioral, brain structural, and electrophysiological) will hold up over a more extended period of time. The important questions to be asked would be: How will these same children function at 2 years, 5 years, and when entering elementary school, at 18 years, and when entering college? What will their brain structural development look like? And, in what relationship, if any, will it stand to the early childhood data reported here. A replication study with a larger sample size and with follow-up to later ages indeed seems warranted to validate and extend the generalizability of these first brain structural findings resulting from change in earliest experience. ACKNOWLEDGMENTS This study was supported by National Institutes of Health grant RO1HD3826 and US Department of Education grants HO23C970032 and R305T990294 (to Dr Als); a grant from the Whitaker Foundation and National Institutes of Health grant P41 RR13218 (to Dr Warfield); and NIH grant P30HD18655 (to Dr Volpe). Investigators who additionally made significant contributions to the study include the following co-authors: Sandra Kosta, BA (Department of Psychiatry, Harvard Medical School and Children’s Hospital Boston, Boston, MA); Jack Connolly, REEGT (Department of Neurology, Harvard Medical School and Children’s
856
EARLY EXPERIENCE
Hospital Boston); Julianne Mazzawi, RN, and Marianne Metcalfe, RN, MSN (Newborn Intensive Care Nursery, Brigham and Women’s Hospital, Boston, MA); Steven A. Ringer, MD, PhD (Department of Newborn Medicine, Harvard Medical School and Children’s Hospital Boston); Johan G. Blickman, MD (Department of Radiology, University of Nijmegen, Nijmegen, The Netherlands); and Richard L. Robertson, MD (Department of Radiology, Harvard Medical School and Children’s Hospital Boston). We thank R. Maltese and C. Schenck for expert support of data acquisition; Stephan E. Maier for continued support of the line scan diffusion imaging sequence; the study nurses for support to the NICU phase implementation; and foremost the study families and infants for their participation and commitment.
REFERENCES 1. Hu¨ ppi PS, Schuknecht B, Boesch C, et al. Structural and neurobehavioral delay in postnatal brain development of preterm infants. Pediatr Res. 1996;39:895–901 2. Hu¨ ppi PS, Warfield S, Kikinis R, et al. Quantitative magnetic resonance imaging of brain development in premature and mature newborns. Ann Neurol. 1998;43:224 –235 3. Hu¨ ppi PS, Maier SE, Peled S, et al. Microstructural development of human newborn cerebral white matter assessed in vivo by diffusion tensor magnetic resonance imaging. Pediatr Res. 1998;44:584 –590 4. Als H, Lester BM, Tronick EZ, Brazelton TB. Manual for the Assessment of Preterm Infants’ Behavior (APIB). In: Fitzgerald HE, Lester BM, Yogman MW, eds. Theory and Research in Behavioral Pediatrics. Vol 1. New York, NY: Plenum Press; 1982:65–132 5. Duffy FH, Als H, McAnulty GB. Infant EEG spectral coherence data during quiet sleep: unrestricted principal components analysis–relation of factors to gestational age, medical risk, and neurobehavioral status. Clin Electroencephalogr. 2003;34:54 – 69 6. Duffy FH, Als H, McAnulty GB. Behavioral and electrophysiological evidence for gestational age effects in healthy preterm and fullterm infants studied 2 weeks after expected due date. Child Dev. 1990;61: 271–286 7. Als H, Duffy FH, McAnulty GB. Behavioral differences between preterm and fullterm newborns as measured with the APIB system scores: I. Infant Behav Dev. 1988;11:305–318 8. Als H, Duffy FH, McAnulty GB. The APIB: an assessment of functional competence in preterm and fullterm newborns regardless of gestational age at birth: II. Infant Behav Dev. 1988;11:319 –331 9. Als H. Reading the premature infant. In: Goldson E, ed. Developmental Interventions in the Neonatal Intensive Care Nursery. New York, NY: Oxford University Press; 1999:18 – 85 10. Buehler DM, Als H, Duffy FH, McAnulty GB, Liederman J. Effectiveness of individualized developmental care for low-risk preterm infants: behavioral and electrophysiological evidence. Pediatrics. 1995;96: 923–932 11. Fleisher BF, VandenBerg KA, Constantinou J, et al. Individualized developmental care for very-low-birth-weight premature infants. Clin Pediatr (Phila). 1995;34:523–529 12. Kleberg A, Westrup B, Stjernqvist K, Lagercrantz H. Indications of improved cognitive development at one year of age among infants born very prematurely who received care based on the Newborn Individualized Developmental Care and Assessment Program (NIDCAP). Early Hum Dev. 2002;68:83–91 13. Westrup B, Kleberg A, von Eichwald K, Stjernqvist K, Lagercrantz H. A randomized, controlled trial to evaluate the effects of the Newborn Individualized Developmental Care and Assessment Program in a Swedish setting. Pediatrics. 2000;105:66 –72 14. Anand KJS, Scalzo FM. Can adverse neonatal experiences alter brain development and subsequent behavior? Biol Neonat. 2000;77:69 – 82 15. Als H, Lawhon G, Duffy FH, McAnulty GB, Gibes-Grossman R, Blickman JG. Individualized developmental care for the very low birthweight preterm infant. Medical and neurofunctional effects. JAMA. 1994;272:853– 858 16. Wiesel TN, Hubel DH. Receptive fields of cells in striate cortex of very young visually inexperienced kittens. J Neurophysiol. 1963;26:994 –1002 17. Wiesel TN, Hubel DH. Simple cell responses in striate cortex of kittens deprived of vision in one eye. J Neurophysiol. 1963;26:1003–1017 18. Wiesel TN, Hubel DH. Comparison of the effects of unilateral and bilateral eye closure on cortical unit responses in kittens. J Neurophsyiol. 1965;28:1029 –1040 19. Mower GD, Berry D, Burchfiel JL, Duffy FH. Comparison of the effects of dark rearing and binocular suture on development and plasticity of cat visual cortex. Brain Res. 1981;220:255–267
20. Mower GD, Burchfiel JL, Duffy FH. Animal models of strabismic amblyopia: physiological studies of visual cortex and the lateral geniculate nucleus. Brain Res. 1982;5:311–327 21. Mower GD, Duffy FH. Animal models of strabismic amblyopia: comparative behavioral studies. Behav Brain Res. 1983;7:239 –251 22. Bourgeois JP, Jastreboff PJ, Rakic P. Synaptogenesis in visual cortex of normal and preterm monkeys: evidence for intrinsic regulation of synaptic overproduction. Proc Natl Acad Sci USA. 1989;86:4297– 4301 23. Rakic PJ, Bourgeois J, Goldman-Rakic PS. Synaptic development of the cerebral cortex: implications for learning, memory and mental illness. In: Von Pelt J, Coiner MA, Uylings HBM, Lopes da Silva PH, eds. The Self-Organizing Brain: From Growth Cones to Functional Networks. Amsterdam, The Netherlands: Elsevier Science; 1994 24. Als H, Gilkerson L, Duffy FH, et al. A three-center, randomized, controlled trial of individualized developmental care for very low birth weight preterm infants: medical, neurodevelopmental, parenting, and caregiving effects. J Dev Behav Pediatr. 2003;24:399 – 408 25. Jacobs S, Sokol J, Ohlsson A. The newborn individualized developmental care and assessment program is not supported by meta-analyses of the data. J Pediatr. 2002;140:699 –706 26. Gairdner D, Pearson J. A growth chart for premature and other infants. Arch Dis Child. 1971;46:783–787 27. Als H. Program Guide: Newborn Individualized Developmental Care and Assessment Program (NIDCAP): An Education and Training Program for Health Care Professionals. 11th Revision. Boston, MA: Children’s Medical Center Corporation; 2002 28. Als H. Toward a synactive theory of development: promise for the assessment of infant individuality. Inf Mental Health J. 1982;3:229 –243 29. Prechtl HFR. The Neurological Examination of the Full-Term Infant: A Manual for Clinical Use. Second ed. Philadelphia, PA: Lippincott; 1977 30. Als H. APIB Features: Summary Variables– Revised. Boston, MA: Harvard Medical School; 1987 31. Bayley N. Bayley Scales of Infant Development. Second ed. San Antonio, TX: The Psychological Corporation; 1993 32. Saltzberg B, Burton WD, Burch NR, Fletcher J, Michaels R. Electrophysiological measures of regional neural interactive coupling. Linear and non-linear dependence relationships among multiple channel electroencephalographic recordings. Int J Biomed Comput. 1986;18:77– 87 33. Duffy FH, Jones KH, McAnulty GB, Albert MS. Spectral coherence in normal adults: unrestricted principal components analysis; relation of factors to age, gender, and neuropsychologic data. Clin Electroencephalogr. 1995;26:30 – 46 34. Richards JE, Parmelee AH Jr, Beckwith L. Spectral analysis of infant EEG and behavioral outcome at age five. Electroencephalogr Clin Neurophysiol. 1986;64:1–11 35. Thatcher RW, Walker RA, Giudice S. Human cerebral hemispheres develop at different rates and ages. Science. 1987;236:1110 –1113 36. Thatcher RW. Cyclic cortical reorganization during early childhood. Brain Cogn. 1992;20:24 –50 37. Bell MA, Fox NA. The relations between frontal brain electrical activity and cognitive development during infancy. Child Dev. 1992;63: 1142–1163 38. Bell MA, Fox NA. Crawling experience is related to changes in cortical organization during infancy: evidence from EEG coherence. Dev Psychobiol. 1996;29:551–561 39. Willekens H, Dumermuth G, Dic G, Mieth D. EEG spectral power and coherence analysis in healthy full-term neonates. Neuropediatrics. 1984; 15:180 –190 40. Kuks JB, Vos JE, O’Brien MJ. EEG coherence functions for normal newborns in relation to their sleep state. Electroencephalogr Clin Neurophysiol. 1988;69:295–302 41. Hjorth B. An on-line transformation of scalp potentials into orthogonal source derivations. Electroencephalogr Clin Neurophysiol. 1975;39:526 –530 42. Rivkin M, Als H, McAnulty G, et al. Prolonged T2* values in newborn vs adult brain: implications for fMRI studies of newborns [abstract]. Proc Int Soc Magn Reson Med. 2002;10:2559 43. Wolke D. Psychological development of prematurely born children. Arch Dis Child. 1998;78:567–570 44. Waber D, McCormick M. Late neuropsychological outcomes in preterm infants of normal IQ: selective vulnerability of the visual system. J Pediatr Psychol. 1995;20:721–735
45. Gudbjartsson H, Maier SE, Mulkern RV, Morocz IA, Patz S, Jolesz FA. Line scan diffusion imaging. Magn Reson Med. 1996;36:509 –518 46. Basser PJ, Mattiello J, LeBihan D. MR diffusion tensor spectroscopy and imaging. J Biophys. 1994;66:259 –267 47. Dixon WJ. BMDP Statistical Software Manual. Berkeley, CA: University of California Press; 1988 48. Aickin M, Gensler H. Adjusting for multiple testing when reporting research results: the Bonferroni vs Holm methods. Am J Public Health. 1996;86:726 –728 49. Yates F. The analysis of multiple classifications with unequal numbers in the different classes. J Am Stat. 1934;29:51– 66 50. Cohen J. Statistical Power for Analysis for the Behavioral Sciences. New York, NY: Academic Press; 1969 51. Rao CR. Advanced Statistical Methods in Biometric Research. New York, NY: Hafner Press; 1974 52. Lachenbruch PA. Discriminant Analysis. New York, NY: Hafner Press; 1975 53. Lachenbruch P, Mickey RM. Estimation of error rates in discriminant analysis. Technometrics. 1968;10:1–11 54. Cooley WW, Lohnes PR. Multivariate Data Analysis. New York, NY: Wiley and Sons; 1971 55. Richardson DK, Corcoran JD, Escobar GJ, Lee SK. SNAP-II and SNAPPE-II: Simplified newborn illness severity and mortality risk scores. J Pediatr. 2001;138:92–100 56. Gray JE, Richardson DK, McCormick MC, Workman-Daniels K, Goldmann DA. Neonatal Therapeutic Intervention Scoring System (NTISS): a therapy-based severity-of-illness assessment tool. Pediatrics. 1992;90: 561–567 57. Littman B, Parmelee AH. Manual for Obstetric Complications. Los Angeles, CA: Infant Studies Project, Department of Pediatrics, School of Medicine, University of California; 1974 58. Hollingshead AB. Four Factor Index of Social Status. Working Paper. New Haven, CT: Yale University; 1975 59. Littman B, Parmelee AH. Manual for Pediatric Complications. Los Angeles, CA: Infant Studies Project, Department of Pediatrics, School of Medicine, University of California; 1974 60. Duffy F, Bartels P, Burchfiel J. Significance probability mapping: an aid in the topographic analysis of brain electrical activity. Electroencephalogr Clin Neurophysiol. 1981;51:455– 462 61. Huttenlocher PR. Synapse elimination and plasticity in developing human cerebral cortex. Am J Ment Defic. 1984;88:488 – 496 62. Yakovlev PI, Lecours AR. The myelogenic cycles of regional maturation of the brain. In: Minkowsky A, ed. Regional Development of the Brain in Early Life. Oxford, United Kingdom: Blackwell; 1967:3–70 63. Schade JP, van Groenigen DB. Structural organization of the human cerebral cortex. I. Maturation of the middle frontal gyrus. Acta Anat (Basel). 1961;41:47–111 64. Volpe JJ. Neurology of the Newborn. Fourth ed. Philadelphia, PA: WB Saunders; 2001 65. Westrup B, Bo¨ hm B, Lagercrantz H, K. S. Preschool outcome in children born very prematurely and cared for according to the Newborn Individualized Development Care and Assessment Program (NIDCAP). In: Developmentally Supportive Neonatal Care: A Study of the Newborn Individualized Developmental Care and Assessment Program (NIDCAP) in Swedish Settings. Vol I. Stockholm, Sweden: ReproPrint AB; 2003:1–21 66. Gordon N. Some influences on cognition in early life: a short review of recent opinions. Eur J Paediatr Neurol. 1998;1:1–5 67. Meek JH, Firbank M, Elwell CE, Atkinson J, Braddick O, Wyatt JS. Regional hemodynamic responses to visual stimulation in awake infants. Pediatr Res. 1998;43:840 – 843 68. Shah AR, Kurth CD, Gwiazdowski SG, Chance B, DelivoriaPapadopoulos M. Fluctuations in cerebral oxygenation and blood volume during endotracheal suctioning in premature infants. J Pediatr. 1992;120:769 –774 69. Volpe JJ. Brain injury in the premature infant: is it preventable? Pediatr Res. 1990;27(6 suppl):S28 –S33 70. Liu D, Diorio J, Day JC, Francis DD, Meaney M. Maternal care, hippocampal synaptogenesis and cognitive development in rats. Nat Neurosci. 2000;3:799 – 806 71. Bourgeois J. Synaptogenesis, heterochrony and epigenesis in the mammalian neocortex. Acta Paediatr Suppl. 1997;422:27–33
ARTICLES
857