4959
Development 124, 4959-4970 (1997) Printed in Great Britain © The Company of Biologists Limited 1997 DEV1190
Early specification and autonomous development of cortical fields in the mouse hippocampus Shubha Tole, Caprice Christian and Elizabeth A. Grove* Department of Pharmacological and Physiological Sciences, Committees on Developmental Biology and Neurobiology, and Pritzker School of Medicine, University of Chicago, Chicago, USA *Author for correspondence at Department of Pharmacological and Physiological Sciences, MC0926, University of Chicago, Chicago, IL 60637, USA (e-mail:
[email protected])
SUMMARY Studies of the specification of distinct areas in the developing cerebral cortex have until now focused mainly on neocortex. We demonstrate that the hippocampus, an archicortical structure, offers an elegant, alternative system in which to explore cortical area specification. Individual hippocampal areas, called CA fields, display striking molecular differences in maturity. We use these distinct patterns of gene expression as markers of CA field identity, and show that the two major hippocampal fields, CA1 and CA3, are specified early in hippocampal development, during the period of neurogenesis. Two field-specific markers display consistent patterns of expression from the embryo to the adult. Presumptive CA1 and CA3 fields (Pca1, Pca3) can therefore be identified between embryonic days 14.5 and 15.5 in the mouse, a week before the fields are morphologically distinct. No other individual cortical areas have been detected by gene expression as early in development. Indeed, other features that distinguish between the CA fields appear after birth, indicating that mature CA field identity is acquired over at least 3 weeks. To determine if Pca1 and Pca3 are already specified to acquire mature CA field identities, the embryonic fields
were isolated from further potential specification cues by maintaining them in slice culture. CA field development proceeds in slices of the entire embryonic hippocampus. More strikingly, slices restricted to Pca1 or Pca3 alone also develop appropriate mature features of CA1 or CA3. Pca1 and Pca3 are therefore able to develop complex characteristics of mature CA field identity autonomously, that is, without contact or innervation from other fields or other parts of the brain. Because Pca1 and Pca3 can be identified before major afferents grow into the hippocampus, innervation may also be unnecessary for the initial division of the hippocampus into separate fields. Providing a clue to the source of the true specifying signals, the earliest field markers appear first at the poles of the hippocampus, then progress inwards. General hippocampal development does not follow this pronounced pattern. We suggest that the sources of signals that specify hippocampal field identity lie close to the hippocampal poles, and that the signals operate first on cells at the poles, then move inwards.
INTRODUCTION
through the CA fields in a largely unidirectional cascade (Nauta and Feirtag, 1986) and, in consequence, long-term memory is dependent upon the integrity of a single field (Tsien et al., 1996; Zola-Morgan et al., 1986). Accordingly, the development of normal hippocampal circuitry and function also depends on the correct division of the hippocampal anlage into its component CA fields. In the first step of this process, distinct populations of hippocampal cells must be specified to follow a particular developmental program, and thereby take on a particular CA field identity. A previous study indicates that the field identity of hippocampal neurons, like the area identity of neocortical cells, is not determined by cell lineage (Grove et al., 1992; Walsh and Cepko, 1992). That is, the CA fields are not generated by precursor populations that are permanently specified, or committed, to produce neurons for a single field. Rather, field identity is likely to be specified by interactions between hippocampal cells and their environment. The cellular nature of
The mammalian cerebral cortex is divided into many functionally specialized areas that also differ anatomically. Many recent studies have addressed the questions of when and how the developing rodent cerebral cortex is patterned into different areas, but most have focused on only one part of the cerebral cortex, the neocortex (reviewed in Grove, 1992; Levitt et al., 1993; McConnell, 1995; O’Leary et al., 1994). In the present study, we focus on another major component of the cerebral cortex, the hippocampus, and ask when the area divisions of the hippocampus, the CA fields, are specified. The hippocampal CA fields are anatomically and neurochemically distinct, and appear to make different contributions to the role of the hippocampus in learning and memory (Blackstad, 1956; Hess et al., 1995; Lorente de No, 1934; Swanson and Cowan, 1977; Swanson et al., 1978; Woodhams et al., 1993; Zimmer and Haug, 1978). Information flows
Key words: mouse, cerebral cortex, hippocampus, cortical area, CA field, specification
4960 S. Tole, C. Christian and E. A. Grove these specification signals, and when they may act has not been previously investigated. The hippocampus is a promising system for this type of investigation for two reasons. First, the hippocampus is anatomically simpler than most other parts of the cortex, containing only a single principal cell layer. Previous studies (Blackstad, 1956; Lorente de No, 1934; Swanson and Cowan, 1977; Swanson et al., 1978; Woodhams et al., 1993; Zimmer and Haug, 1978), supported by the present study, indicate that this cell layer is divided into only two major fields, CA1 and CA3, each of which contains a distinct pyramidal cell type. The two classes of pyramidal neuron mingle in the small transitional field, CA2. Thus, in contrast with neocortex, in which area boundaries are marked by changes in several cell layers containing many cell types, the transition from CA1 to CA3 is marked by a simple shift from one major pyramidal cell type to another. Second, mature CA1 and CA3 pyramidal cells can be distinguished not only by their morphology, connections and physiological properties, but also by their expression of several macromolecules (see Table 1). Consequently, a cell’s development of CA1 or CA3 identity can be readily determined in vivo, and in a variety of experimental settings, by the cell’s expression of an appropriate set of molecular markers. In the present study in the mouse, we ask when hippocampal cells are specified to acquire either a CA1 or CA3 field identity, using a panel of molecular markers, as well as morphological features, to define that identity. We find that two regions that we term presumptive CA1 and CA3 (Pca1 and Pca3) can be distinguished in the mouse hippocampus several days before birth by a complementary pattern of gene expression. However, this initial distinction between two embryonic hippocampal cell populations does not immediately indicate that the mature field identity of the cells is now specified. Many features make up a field identity, and these features may be specified at different times in development. Consistent with this, we find that new molecular and morphological field-specific features continue to appear in the developing hippocampus for at least 2-3 weeks after birth. Moreover, in another part of the cortical mantle, the neocortex, area identity appears to be specified gradually (Grove, 1992; Levitt et al., 1993; McConnell, 1995). Some features of neocortical area identity are specified during the peak of neurogenesis; others are specified much later, perhaps only just before the particular features appear postnatally (CohenTannoudji et al., 1994; Levitt et al., 1993; O’Leary et al., 1994; O’Leary and Stanfield, 1989; Schlaggar and O’Leary, 1991; Stanfield and O’Leary, 1985). To address the question of whether the presumptive hippocampal fields identifiable in the embryo are already specified to develop complex, mature CA field identities, the embryonic hippocampus was removed from its normal environment to one in which it would receive no further extrinsic specification cues: the developing hippocampal slice culture (Gahwiler et al., 1991; Stoppini et al., 1991). To attempt to identify candidate sources of specification cues, we first removed only extrahippocampal sources by culturing slices of the entire hippocampus. Next, the slices were subdissected into individual presumptive CA fields, which were then maintained separately in culture. In each case, we asked if hippocampal cells in these reduced environments could nonetheless develop a range of
molecular and morphological features of mature CA field identity. MATERIALS AND METHODS Tissue preparation Outbred CD-1 mouse pups and timed-pregnant females were obtained from the University of Chicago Cancer Research Center Transgenic Facility. The day on which a vaginal plug was discovered is termed E0.5, and the day of birth P0. To harvest embryo brains, timedpregnant dams were killed by CO2 inhalation, embryos were removed, and brains dissected out and immersed overnight in 4% paraformaldehyde in PBS. To harvest older brains, mouse pups were deeply anaesthetized by hypothermia (pups only, P0-P7), or nembutal (P8 on), and perfused transcardially with the same fixative. After cryoprotection, each brain was sectioned into 40 µm coronal sections using a sledge microtome (Leica). Slice cultures Slice cultures were prepared according to the method described by Stoppini et al. (1991) with modifications. Timed-pregnant dams were killed by CO2 inhalation, embryos were removed, and the telencephalon dissected out into Hepes-buffered ACSF. The telencephalon was sliced at a thickness of 200-400 µm on a McIlwain tissue chopper, slices were floated in Hepes-ACSF, and the hippocampus cut away from the rest of the telencephalon with a surgical microblade. The hippocampus proper was separated from the adjacent subiculum using a notch at the crest of the dentate gyrus as a landmark. A line drawn from this notch through and orthogonal to the cortical plate roughly marks the boundary between presumptive subiculum and CA1 (Paxinos et al., 1991). To generate slices of individual presumptive CA fields, each hippocampal slice was subdissected into four pieces: presumptive dentate gyrus (discarded), presumptive CA3, presumptive CA1, and a middle portion between the presumptive CA1 and CA3 pieces (discarded). Slices were placed on Millicell-CM inserts (Millipore) in 6-well culture plates, and maintained in B-27-supplemented NeuroBasal Medium (Gibco). For in situ hybridization or immunohistochemistry, cultures were fixed in 4% paraformaldehyde. In situ hybridization Riboprobes were transcribed from five cDNA clones used previously for in situ hybridization experiments, and tested for specificity of hybridization: pTy3IS.236 (Tyro3), O46.2B (SCIP), pKA1405 (KA1), pJDM33 (NGFI-A) and pmβ6T-3utr (class III β-tubulin) (Frantz et al., 1994; Lai et al., 1994; Wisden and Seeburg, 1993). In situ hybridization was performed using a non-radioactive method described previously (Tole and Patterson, 1995). For two-color in situ hybridization, one riboprobe was labeled with digoxygenin-UTP and the second with fluorescein-UTP (Boehringer Mannheim). Probes were detected with anti-digoxygenin or anti-fluorescein antibodies conjugated to alkaline phosphatase (Boehringer Mannheim). Color reactions were carried out using different substrates for alkaline phosphatase: nitro blue tetrazolium (NBT, Boehringer-Mannheim), 5bromo-6-chloro-3-indolyl phosphate (magenta-phos, Molecular Probes), or a novel chromagen (T. Sanders and C. W. Ragsdale, personal communication). Immunohistochemistry Fixed cultures or tissue sections were incubated overnight with the Py antibody or with an antibody against calbindin-D-28K (Sigma), then incubated with secondary antibodies coupled to fluorescein or rhodamine (Tago, Boehringer Mannheim). Morphological analysis To examine differences in cell size between CA1 and CA3, cultures
Early specification of hippocampal CA fields 4961 were maintained for 12 days in vitro (DIV) to allow cell morphology to mature, then fixed and stained for Nissl substance. From each of three culture batches, a whole hippocampal slice and a pair of Pca1 and Pca3 slices were selected at low magnification, at random, from cultures that displayed clear Nissl staining. For each Pca slice, or field within a whole hippocampal slice, the outlines of 25-30 cell bodies were drawn, and perimeters and cross-sectional areas determined using a computer reconstruction system (Neurolucida, MicroBrightField). Samples of CA1 and CA3 cells from whole hippocampal slice cultures were compared using a one-tail, paired two-sample t-test. Samples of cells from Pca1 and Pca3 slices were compared in the same way. Cell death assay Dying cells in embryonic hippocampus were identified using the TUNEL procedure (Gavrieli et al., 1992). Hippocampii were processed from 3-8 mice at each of the following ages: E15.5, 16.5 and 17.5. TUNEL staining was carried out using a kit (Boehringer Mannheim, In Situ Cell Death Detection Kit, Alkaline Phosphatase) according to the manufacturer’s instructions. Intense TUNEL labeling of cells appeared in a variety of positive control tissues, including embryonic dorsal root ganglia, head mesenchyme and brain meninges. In hippocampus, TUNEL-stained cells were counted in the developing pyramidal cell layer – the hippocampal cortical plate plus the intermediate zone. To analyze possible regional differences in cell death, the developing pyramidal cell layer in each coronal section was divided into three sectors of equal length, one at the subicular end of the hippocampus, one at the dentate end, and a third intervening sector. These sectors are thus referred to as the subicular, dentate and ‘gap’ sectors (see Results).
RESULTS Expression of several macromolecules provides a panel of CA1 and CA3 cell markers The first step was to identify a panel of CA1 and CA3 pyramidal cell markers from among the many macromolecules reported to be differentially expressed in hippocampus (Table 1). Such markers should distinguish unambiguously between the two cell classes and label all, or almost all, cells in a class. In situ hybridization and immunohistochemistry were used to examine systematically in adult mouse hippocampus the expression of several macromolecules listed in Table 1. Expression patterns were compared in serial sections from the same brains, or in single sections labeled with a two-color in situ hybridization procedure. To compare marker-defined boundaries with CA field boundaries defined by classical morphological criteria, one series of sections from each brain was processed for Nissl substance. Nissl staining reveals differences in cell size and cell packing that clearly distinguish CA field boundaries (Blackstad, 1956; Lorente de No, 1934; Woodhams et al., 1993; Zimmer and Haug, 1978). Four robust, field-specific markers were selected for the present study: Py-immunoreactivity, and the expression of KA1, SCIP and Tyro3 mRNA. CA1 pyramidal cells strongly express SCIP and Tyro3 (Figs 1G, 3A). CA3 pyramidal cells express KA1 (Fig. 1H) and are Py-immunoreactive (Py-IR) (Fig. 3B). All four markers label all, or virtually all, cells in the pyramidal layer of either CA1 or CA3 (Figs 1G,H, 3A,B). Only two of the four markers label non-pyramidal cell types in the hippocampus: KA1 is also expressed by dentate granule cells, and Py-immunoreactivity is detected in interneurons
Table 1. A diversity of molecular markers reported* to distinguish between CA1 and CA3 in adult mouse and rat Feature SCIP
Function
POU-domain transcription factor Brn-1 POU-domain transcription factor Brn-2 POU-domain transcription factor NGFIA Immediate early gene Tyro-3 Receptor tyrosine kinase KA1 Glutamate receptor subunit COX2 Cyclooxygenase isoform Py Undefined antigen neurexin Ib, IIIa Brain-specific cell surface proteins neuronal pentraxin Taipoxin (snake venom) binding protein
CA1
CA3
Detection
+
−
ISH
+
−
ISH
+
−
ISH
+ + − − −
− − + + + +
ISH ISH, ICC ISH ICC ICC ISH
±
+
ISH
*He et al. (1989); Woodhams et al. (1989); Bettler et al. (1990); Wisden and Seeburg (1993); Frantz et al. (1994); Herms et al. (1994); Lai et al. (1994); Alvarez-Bolado et al. (1995); Breder et al. (1995); Schlingen et al. (1995); Ullrich et al. (1995). ISH, in situ hybridization; ICC, immunocytochemistry. The symbol ± indicates low expression of a marker.
scattered throughout the hippocampus (Wisden and Seeburg, 1993; Woodhams et al., 1989). As previously reported, all the markers additionally label cell types outside the hippocampus (Alvarez-Bolado et al., 1995; Frantz et al., 1994; He et al., 1989; Lai et al., 1994; Wisden and Seeburg, 1993; Woodhams et al., 1989). Although the hippocampal pyramidal cell layer is classically divided into four CA fields, CA1-CA4 (Lorente de No, 1934), expression patterns of Py, KA1, SCIP and Tyro3 indicate that there are only two major classes of pyramidal neuron in this cell layer. Each marker labels a subpopulation of cells in CA2 (Figs 1G,H, 2H), consistent with the mixing of CA1 and CA3 cell types in this field (Woodhams et al., 1993). Further, CA3 marker expression continues into the hilus of the dentate gyrus (Fig. 1H, Woodhams et al., 1993, and data not shown), indicating that the CA3 pyramidal cell type also continues into this region – the part of the pyramidal cell layer classically defined as CA4. Thus, the entire pyramidal cell layer appears to be divided between two major cell types, CA1 and CA3 cells. When do these cell types first show a difference in development? Complementary expression of SCIP and KA1 defines two presumptive CA fields By E15.5, 4 days before the mouse is born, strong SCIP mRNA expression appears in presumptive CA1 (Pca1), as well as an adjacent cortical field, the presumptive subiculum (Fig. 1A). At the same age, strong KA1 expression appears in presumptive CA3 (Pca3) and the dentate gyrus (Fig. 1B). A few cells in Pca3 express KA1 still earlier, at E14.5, an age at which SCIP is detected in neocortex, but not in hippocampus (data not shown). Both SCIP and KA1 are expressed by cells at different stages of their maturation. Migrating cells in the intermediate zone and settled cells in the hippocampal cortical plate express SCIP and KA1 (Fig. 1A,B,E). SCIP, but not KA1, is also expressed by scattered cells close to the ventricular surface. The latter SCIP-expressing cells may be postmitotic cells at the start of migration, or precursor cells that are still dividing.
4962 S. Tole, C. Christian and E. A. Grove
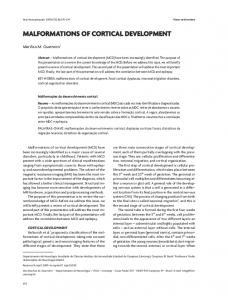
Fig. 1. SCIP and KA1 expression distinguishes CA1 and CA3 in adult hippocampus, and presumptive CA1 and CA3 in embryonic hippocampus. (A-F) In embryonic hippocampus, SCIP is expressed in presumptive CA1 (A,D); KA1 in presumptive CA3 (B,E). Both the cortical plate (cp) (A,B,D,E), and intermediate zone (iz) (A,B,E) contain SCIP- and KA1-expressing cells. Arrowheads (in B,C,E,F) indicate the tip of presumptive CA3; KA1 expression medial to the tip of presumptive CA3 is in the developing dentate gyrus (B,E). At E15.5, the fronts of SCIP and KA1 expression (dotted lines, A,B) do not yet meet, and a region in between expresses neither marker. By E18.5, the two fronts of expression have advanced inwards (D,E). (G-I) In adult hippocampus, SCIP is expressed in CA1 (G), KA1 in CA3 (H) and SCIP- and KA1expressing cells mix in CA2 (G,H). Arrows in A-C indicate a hippocampal landmark, a notch at the crest of the dentate gyrus. A line drawn from this notch through and orthogonal to the cortical plate roughly marks the boundary between presumptive subiculum and CA1 (Paxinos et al., 1991). Scale bar, 250 µm (A-I).
Early field-specific differentiation begins at the hippocampal poles and moves inward Regionally restricted expression of SCIP in the embryonic rat hippocampus has been reported previously (Alvarez-Bolado et al., 1995; Frantz et al., 1994; He et al., 1989), but these studies did not identify a complementary marker for developing CA3 cells. Consequently, the presumptive fields Pca1 and Pca3 could not be defined with respect to one another, and a further striking feature of early hippocampal development was missed. The hippocampal pyramidal cell layer has two ends, or ‘poles’, one at the dentate gyrus, and the other at the boundary between CA1 and the subiculum (see Figs 1, 2). At E15.5, cells near the dentate and subicular poles of the hippocampus express KA1 and SCIP, respectively, but a broad stretch of the hippocampus in between expresses neither regional marker (compare positions of dotted lines in Fig. 1A,B). Over the next 3-4 days, however, the two fronts of SCIP and KA1 expression advance gradually inwards from the poles (Fig. 1D,E). The progression of early marker expression in the developing hippocampus is best seen in sections processed with a two-color in situ hybridization procedure (Fig. 2, Fig. 5A). At E16.5 a substantial gap is apparent between the fronts of SCIP and KA1 expression (Fig. 2A-C) that is particularly prominent at mid and caudal levels through the hippocampus. By the next day, E17.5,
the gap between the fronts of SCIP and KA1 expression has narrowed (Fig. 2D-F). Closing of the gap between the two fronts of gene expression is complicated by the simultaneous expansion of the embryonic hippocampus, but as hippocampal expansion slows, progression of the two markers catches up. No gap remains, even in the most caudal hippocampus, at birth (E19.5/P0, data not shown). In early postnatal hippocampus, expression of SCIP and KA1 overlaps in field CA2 (Fig. 2G,H), showing the mature, adult pattern (Fig. 1G,H). Does the poles-inward progression of SCIP and KA1 expression reflect a more general pattern of hippocampal development? If the hippocampal cortical plate forms in this way, the gap between the fronts of early SCIP and KA1 expression might simply reflect a lower cell density in that part of the embryonic hippocampus. However, no such region of low cell density is seen in Nissl stain (Fig. 1C). Further, hippocampal neuronal differentiation, in general, does not follow a poles-inward pattern. At E17.5, when there is still a gap between the fronts of SCIP and KA1 expression (Fig. 5A), class III β-tubulin mRNA, a general marker of differentiating neurons, is expressed evenly throughout the developing hippocampal cortical plate and intermediate zone (Fig. 5B). Similarly, even expression of class III β−tubulin is seen as the cortical plate is forming (E14.5-E16.5) and, still
Early specification of hippocampal CA fields 4963
Fig. 2. SCIP and KA1 expression in embryonic hippocampus progresses inwards from the hippocampal poles. (A-H) Twocolor in situ hybridization reveals a gap between the fronts of early SCIP and KA1 expression, which closes as development proceeds. (A-C) Coronal sections through an E16.5 hippocampus at rostral (A), mid (B) and caudal (C) levels. White lines mark the two ends of the developing hippocampal pyramidal cell layer, determined as for Fig. 1. About one third of this layer (between black arrows) lacks SCIP (purple) or KA1 (brown) expression. (D-F) Corresponding rostral to caudal levels through an E17.5 hippocampus. The gap between the fronts of SCIP and KA1 expression has narrowed (D-F), and at the most rostral level (D) almost closed. (G,H) In P7 hippocampus, expression of SCIP (brown) and KA1 (magenta) overlaps in field CA2. (H) is a higher magnification of boxed area in (G), arrowheads indicate intermingled SCIP- or KA1-expressing cells. Scale bars, 200 µm (A-F); 250 µm (G); 100 µm (H).
earlier, in the hippocampal preplate (E10.5-E13.5) (data not shown). The poles-inward progression appears characteristic of the development of early field-specific neuronal markers. A final, formal possibility is that the gap between the fronts of SCIP and KA1 expression closes, not because cells between the two fronts upregulate marker expression, but because cells in this region selectively die. We used the TUNEL procedure (Gavrieli et al., 1992) to identify dying (TUNEL+) cells in the hippocampus at E15.5, E16.5 and E17.5, the period of ‘gap closing’. Results were inconsistent with a role for cell death in closing the gap. In agreement with previous reports (Ferrer et al., 1994; Stanfield and Cowan, 1988), only low levels of cell death were evident in the embryonic hippocampus. TUNEL+ cells were sparse throughout the developing pyramidal cell layer, and TUNEL+ cells in the ‘gap’ region of this layer were no more numerous than in neighboring regions. At E17.5, for example, mean numbers of TUNEL+ cells were 1.0, 0.5 and 0.5 per section, respectively, for three equal-sized subicular, ‘gap’ and dentate sectors of the pyramidal cell layer (s.e.=0.6, 0.1, 0.4; TUNEL+ cells counted in 40 sections through four hippo-campii; see Materials and methods for details of the division of the hippocampus into three sectors). Mature CA1 or CA3 field identity is acquired over at least 3 weeks Additional field-specific features distinguish CA1 and CA3 only
after birth. Consistent with previous observations in rat (Zimmer and Haug, 1978), CA3 cells in mice are not detectably larger than CA1 cells until P3 (Table 2). Selective expression of Tyro3 and NGFIA in CA1, and Py-immunoreactivity in the pyramidal cells of CA3, is detectable still later, 1-2 weeks after birth, and shows an adult pattern by 3 weeks (Herms et al., 1994; Lai et al., 1994; Woodhams et al., 1989) (Table 2). In contrast with early CA field differentiation, none of these later features appears to follow a poles-inward pattern of development. CA1 and CA3 field development proceeds without specification cues from outside the hippocampus Are the presumptive fields, Pca1 and Pca3, already specified to Table 2. Features that distinguish CA1 and CA3 continue to appear over at least three weeks Feature KA1 SCIP Pyramidal cell size difference Py Tyro3 NGFIA
First field-specific appearance
Expression at E17.5
Expression in the adult
E14.5 E15.5 P3
CA3 CA1 No difference
P5* P10 P14
No expression No expression No expression
CA3 CA1 CA3 larger than CA1 CA3 CA1 CA1
*In rat, Woodhams et al. (1989).
4964 S. Tole, C. Christian and E. A. Grove
Fig. 3. Late-appearing molecular markers of CA1 and CA3. In adult hippocampus, Tyro3 mRNA is strongly expressed in CA1 pyramidal cells (A), whereas CA3 pyramidal cells are strongly Py-immunofluorescent (B). Neither Tyro3 expression nor Pyimmunofluorescence is detectable in the hippocampus at E17.5 (C,D). Scale bars, 250 µm (A,C,D); 140 µm (B).
develop mature CA1 and CA3 identities, or do they require further specification signals from other hippocampal fields, or other parts of the brain? To address this question, E17.5 hippocampus was isolated from further potential extrinsic specification cues by maintaining hippocampal slices in organotypic culture. At E17.5, Pca1 and Pca3 can be detected by SCIP and KA1 expression, but other field-specific features, such as Tyro3 expression and Py-immunoreactivity, have not appeared (Fig. 3C,D). After 5-21 DIV, slice cultures were examined for expression of the early field markers SCIP and KA1, and for the development of three late-appearing features: Tyro3 expression, Py-immunoreactivity and the characteristic difference in cell body size between CA1 and CA3 pyramidal neurons. Slices prepared from E17.5 hippocampus maintain expression of SCIP and KA1, and develop all three new features of field identity in an appropriate, field-specific manner (Figs 4, 7). In many slices, the pyramidal cell layer is much broader than in vivo, probably reflecting the eventual breakdown of normal cell migration in cortical slice cultures (Gotz and Boltz, 1992), as well as spreading of the embryonic cortical plate. Nonetheless, slices retain a recognizable hippocampal morphology (Fig. 4), and although not confined to a compact pyramidal cell layer, the expression of each field marker is confined to a single region of each slice, either proximal (CA3) or distal (CA1) to the dentate gyrus (Fig. 4). Appropriate expression of field-specific markers was highly Fig. 4. E17.5 hippocampus develops new CA1 and CA3 field differences in vitro. (Nissl, KA1, SCIP, Tyro3, Py) A hippocampal slice (12 DIV) with adjoining cortex attached shows a well-defined pyramidal cell layer and dentate gyrus (Nissl). Other slices shown, containing the hippocampus only, display a much broader pyramidal cell layer, but can be oriented by reference to the dentate gyrus (arrowheads indicate landmark notch at the crest of the dentate gyrus). After 9-21 DIV, slices of E17.5 hippocampus maintain fieldspecific expression of KA1 and SCIP, and upregulate expression of new field-specific markers, Tyro3 and Py. (Py-CA1, Py-CA3) CA3 contains many large Py-IR neurons, with pyramidal-shaped cell bodies (Py-CA3, arrow), and thick, brightly stained processes. CA1 contains only scattered small, multiform Py-IR cells, likely to be PyIR interneurons. Scale bars, 150 µm (Nissl, SCIP, KA1, Tyro3); 125 µm (Py); 40 µm (Py-CA1, Py-CA3).
consistent (Table 3). Most cultures displayed field-specific staining patterns, and only a single culture showed a pattern of marker expression that was the reverse of that seen in vivo (Table 3). For each marker, however, a few slices displayed staining in both CA1 and CA3, due either to non-specific staining, or genuine upregulation of expression in both fields.
Early specification of hippocampal CA fields 4965 Table 3. CA field identity develops in slice cultures of E17.5 hippocampus Feature SCIP Tyro3 KA1 Py
Field-appropriate expression
Expression in inappropriate field only
Expression in both fields
No expression
Total*
30 (94%) 34 (67%) 38 (85%) 28 (78%)
0 1 (2%) 0 0
2 (6%) 10 (19%) 1 (2%) 4 (11%)
0 6 (12%) 6 (13%) 4 (11%)
32 51 45 36
*Total for each marker includes cultures prepared in at least 4 separate experiments.
The difference in size that developed between CA1 and CA3 cells in slice culture was strongly reminiscent of the difference these cell types develop in vivo (Fig. 7). In vivo, embryonic pyramidal cells appear roughly equal in size, but by adulthood in the rat or mouse, CA3 cells are about 50% larger than CA1 cells with respect to cell body diameter, and twice as large as CA1 cells with respect to cross-sectional area (Blackstad, 1956; Lorente de No, 1934; Zimmer and Haug, 1978; present study). Similarly, in E17.5 hippocampal slices maintained for 12 DIV, the mean cross-sectional area of CA3 cells (138 µm2, s.e.=6) was roughly twice that of CA1 cells (68 µm2, s.e.=4), and the difference was highly significant (one-tail, paired twosample t-test, P