Early-stage Design by Concept Plotting: Insights from Advertising Alex Ivanov School of Interactive Arts and Technology Simon Fraser University, BC, Canada
[email protected] ABSTRACT Drawing on the practice of advertising and other group support system research, this paper introduces a framework for creativity support called concept plotting. A node-link map structure is collectively grown vertically, while options are plotted sideways. Images can be uploaded into nodes, and their size determined by dynamic polling, infusing an element of play and social dynamics. Keywords Computer support for collective creativity, visualization, advertising, concept maps, knowledge media, web polling INTRODUCTION On May 2005 Nike Corporation ran an interactive billboard on the Reuters panel in Times Square in New York [7]. Passersby could dial from their mobiles and participate in the construction of a Nike shoe model on that very billboard. Now, turn back forty years to look at one of the most 'low-fidelity', yet most successful advertising campaigns in history: "We try harder." (Fig. 1) The concepts behind each of these two ads help to synthesize a framework for nurturing creativity in the early stage design process. Tools for this process, according to Nakakoji, need “interpretation-rich representations, representations with constant grounding, and interaction methods for hands-on generation and manipulation of the representations”[13]. The concept plotting framework, introduced next, builds on this conclusion, drawing on best practices from advertising planning and several group support systems. It also caters to Schneidermann’s three types of creative people: inspirationalists, structuralists, and situationalists [13], supporting multi-stakeholder participation. We first look at the Avis ad, then relate concept maps to concept plots, concluding with a prototype sketch and a note on empirical research. SKETCHING IN ADVERTISING Strategic, or ‘upstream’ creativity in advertising has been explored in [10]. Designers and writers may sketch on napkins fresh ways to present the message, but the essence of that message is distilled in the early stage design process by account planners. The planner's ‘sketching’ is like that of ethnographers, hunting for insights into people's behaviour.
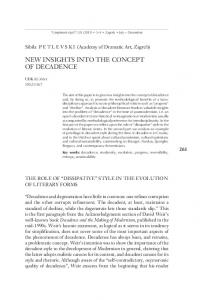
In advertising, these insights are represented in the creative brief, which is an exercise in knowledge restriction—a one pager containing little more than objectives, audience profile, their attitude, and some thought-starters [8]. Creative briefs were discussed in [4] by looking at the Avis ad below, as if it were the actual creative brief for the campaign. Why is this ad creative? According to deBono, creativity happens when a probable way of looking at things is disrupted by a sudden appreciation that there is another way of looking at them [2]. The ad’s headline invites such appreciation. With a ‘prey-predator’ metaphor alongside details in the body, it becomes obvious that Avis has to work harder (than Hertz) and keep gas tanks fuller, etc. The visual also softens our reaction, even induces sympathy (Oh, that poor fish). Note the minimalism; anyone could have sketched the fish, as if playing Pictionary. But such informal representations could also take the form of pictures found in seconds on Google!
Fig. 1. 1963 newspaper ad for Avis rental, created by DDB. [11] (Source: www.wetryharder.com)
FROM CONCEPT MAPS TO CONCEPT PLOTS The form and content of the Avis ad can serve to show how suitable concept (node-link) maps are for knowledge visualization. The ad’s elements fit into a structure of ‘claim, support, and interpretation’. Of course node-link maps are widely used in graphical interfaces, but few allow for pictorial representations besides text. The VisualExplorer dialog mapping tool is one exception [9]; another is EVIDII, which uses spatial positioning of triples [6]. These prototypes, however, are more about knowledge browsing rather than scaffolding of representations. The latter is supported by GuideMaps [1], partitioned into several ‘fill-in-the-blank-boxes’ and initially populated with
a few seed ideas by an expert. Other team members can then add content in a bottom-up, inductive process. But what if the GuideMap allowed adding content sideways, in line with deBono’s lateral thinking? And what if the map was an x/y plot, so nodes and links can be objects that have attributes such as the degree of agreement on meanings, set by dynamic voting visualiation? [12] Advertising provides another example here: The Ideaquarium is an application for ad agency teams to externalize and assess their ideas onto a shared display [3]. Ideas are represented by types of fish, which rise to the surface as they get voted on. One limitation with the Ideaquarium or VisualExplorer, however, is that they require a facilitator. For distributed, asynchronous collaborative knowledge construction, a more accessible form of persistence would fare better. This was the idea behind the Plot-poll: Web polling in the form of a scatterplot, embedded in a discussion board on the topic of mood supplements [5]. People literally plot where they ‘stand’ in time (x axis for weeks, y for mood). Subsequent plots (clicks) on the same spot increase the size of the dot. The resulting pattern not only visualizes knowledge from hands-on generation of representations, but reifies the shared temporal context of the discussion board.
Fig. 2. Possible structure of concept plotting based on the “We try harder” concept. Due to lack of space, details are omitted.
Concept plotting, then, tries to integrate all of the abovementioned features into one compact structure, which may take the form and shape shown Fig. 2. In summary: • The node-link structure is collectively grown vertically for concept refinement… • but also laterally, as options are plotted sideways. 45˚ plotting might help, as with the fish graphic, which refines yet also takes the concept into new territory. • Links show the type and author of the contribution
• Images as well as text can be uploaded into nodes • Node size is determined by dynamic polling, infusing an element of play and social dynamics • The canvas may be constrained, partitioned or based on a metaphor, such as a chess board DIRECTIONS FOR EMPIRICAL RESEARCH One Concept Plot prototype is currently being developed for an experiment at SFU. A diverse team of stakeholders will use it to plan, create and negotiate (as in a creative brief) the student experience the School of Interactive Arts and Technology should convey on its website. In addition to measuring effectiveness, the study will try to gauge ‘softer’ factors such as affect from aesthetics and play. REFERENCES 1. Dansereau, D. Node-Link Mapping Principles for Visualizing Knowledge and Information. Lecture Notes in Computer Science 3426, June 2005, 61-81. 2. DeBono, E. New Think: The Use of Lateral Thinking in Generation of New Ideas. NY: Basic Books, 1967. 3. Eppler, M. and Mengis, J. Persistence through visualization in knowledge-intensive conversations. Proc. 9th Int. Conf. Information Visualization, 2005. 4. Ivanov, A. Do Account Planners make creative leaps? Master’s project, The University of Texas at Austin, 1999 www.collabographics.com/brief 5. Ivanov, A., and Funkel, K. Graphical web polling for online discussion spaces, i L O R 0 5 Conference (Posters), Vancouver, Canada, Nov. 14-17, 2005. (www.sfu.ca/~aivanov/poster.pdf) 6. Nakakoji, K., Yamamoto, Y. and Ohira M. A framework that supports collective creativity in design using visual images, Creativity and Cognition 99, UK. 7. Nike iD Interactive Reuters Billboard Sign http://freshnessmag.com/content/features/files/0505/ nike_id_reuters/index.php 8. Nov, O. Knowledge, Creativity, and IS: A critical view. Proc. 38th Hawaii Int. Conf. on System Sciences, 2005 9. Selvin, A. Fostering collective intelligence: Helping groups use visualized argumentation. Visualizing Argumentation, Kirschner, P.A., Shum S.B. and Carr S. (Eds.), Springer-Verlag: London, 2003. 10. Steel, J. Truth, Lies and Advertising: The Art of Account Planning, New York: Wiley, 1998. 11. The history of “We Try Harder”, article accessed Dec 30, 2005. http://video.mww.com/clients/avis/e-kit/ 2003/html/quickfacts-history.html 12. Turoff, M., Hiltz, S.R., Bieber, M., Fjermestad, J., and Rana, A. Collaborative discourse structures in computer mediated group communications. Proc. 32nd Hawaii Int. Conf. on System Sciences, 1999. 13. Yamamoto, Y. and Nakakoji, K. Interaction design of tools for fostering creativity in the early stages of information design. Int. J. Human-Computer Studies 63, 2005, 513–535.