Hoffmann J. Mapping damage during the Bam (Iran) earthquake using interferometric ... Timo Balz, Mingsheng Liao. Building-damage detection using.
The International Archives of the Photogrammetry, Remote Sensing and Spatial Information Sciences, Volume XLII-3, 2018 ISPRS TC III Mid-term Symposium “Developments, Technologies and Applications in Remote Sensing”, 7–10 May, Beijing, China
EARTHQUAKE BUILDING DAMAGE MAPPING BASED ON FEATURE ANALYZING METHOD FROM SYNTHETIC APERTURE RADAR DATA Liqiang An 1,3, Jingfa Zhang 2, Lixia Gong 2 1
Institute of Engineering Mechanics, CEA. Key Laboratory of Earthquake Engineering and Engineering Vibration, CEA 2 Institute of Crustal Dynamics, CEA 3 Earthquake Administration of Tianjin Municipality
KEY WORDS: Building Damage Assessment, Earthquake Emergency, Feature Analysing, SAR
ABSTRACT: Playing an important role in gathering information of social infrastructure damage, Synthetic Aperture Radar (SAR) remote sensing is a useful tool for monitoring earthquake disasters. With the wide application of this technique, a standard method, comparing postseismic to pre-seismic data, become common. However, multi-temporal SAR processes, are not always achievable. To develop a post-seismic data only method for building damage detection, is of great importance. In this paper, the authors are now initiating experimental investigation to establish an object-based feature analysing classification method for building damage recognition.
1. INTRODUCTION Remote observation has become an essential method for data collection in the initial stage of earthquake relief, since it can provide disaster information on a large scale objectively and effectively. Nowadays, remote observation for seismic damage information takes advantage of mainly two types of sensors: optical sensors which observe reflective and radiometric characteristics passively, and radar sensors which actively emit microwaves. High-resolution optical sensor images can be used to assess damage at building level or to evaluate damage to ground. Unfortunately, this method is not applicable in regions with incidence of cloud cover or snow. On the other hand, radar sensors can observe the ground irrespective of weather conditions or the time of the day, and therefore have been gaining prominence as a reliable tool for grasping the overall picture of damage from disasters. For rapid damage assessment based on SAR data, there are mainly three techniques: 1)interpretation of a single post-event very-highresolution(VHR) SAR data; 2)change detection of pre-event and post- event data pair with same sensor; 3)combination of optical data and post-event SAR data In recent years, some researchers have started to apply objectoriented image analysis techniques to building damage information extraction based on SAR data. Hideomi Gokon and Shunichi Koshimura (2016) developed an object-based method to estimate building damage from TerraSAR-X. Yanbing Bai and Bruno Adriano (2017) proposed an object-based building damage assessment method that use only post event ALOS2/PALSAR dual polarimetric SAR intensity image and they also applied machine learning method in SAR image based building mapping. In this article, the authors analysed the interpretation characteristics of damaged buildings in high resolution SAR image and made a statistic analysis on the texture feature of block scale image object, in the end, preformed an experiment of applying fuzzy classification method to block scale building damage estimation.
2. ANALYSIS OF IMAGE FEATURES OF DAMAGED BUILDINGS 2.1 General Study To identify damaged buildings from high resolution SAR image, firstly, the overall destruction of buildings should be analysed from the direction of the building and the geometric features of SAR system, and factors of the surrounding scene should be considered. Finally, damage degree is analysed with scattering characteristics.
This contribution has been peer-reviewed. https://doi.org/10.5194/isprs-archives-XLII-3-39-2018 | © Authors 2018. CC BY 4.0 License.
39
The International Archives of the Photogrammetry, Remote Sensing and Spatial Information Sciences, Volume XLII-3, 2018 ISPRS TC III Mid-term Symposium “Developments, Technologies and Applications in Remote Sensing”, 7–10 May, Beijing, China
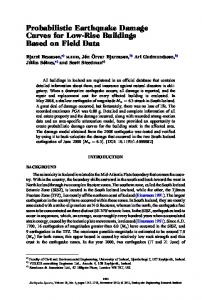
Figure 1. Damaged buildings in different remote sensors. a: aerial photo, b: Cosmo-Skymed SM, c: TerraSAR-X spotlight, d: Cosmo-Skymed SP The offset or interruption of the linear characteristics of buildings in SAR images (such as shadow or overlay) can reflect different levels of damage, which is mainly caused by the loss of elevation. High resolution SAR image can capture more detail information of buildings, so that the earthquake damage can be recognized. It can also detect small damage targets, such as debris that can be reflected in the image. The strong scattering of exposed reinforced materials can be used as a seismic criterion.
also commonly applied in object - oriented image analyzing. Haralick (1973) points out that the use of gray level cooccurrence matrix statistics as space relationship of texture feature of image pixels and puts forward the 14 GLCM texture characteristics. In this article, several specifications of GLCM texture feature the authors chose are as follows:
In the formula, i, j are representing the grayscale value of P the pixel, ij is the calculation value in the symbiotic matrix. 1.Entropy
e
N 1
P
i, j
i , j 0
( ln Pi , j ) 2 (1)
Entropy measures the uniformity of texture distribution, the disorder of image. There is no specific spatial shape of the weight of entropy, which is determined by the value of the value in the symbiotic matrix and is independent of its position in the matrix. This characteristic parameter is used to describe the overall nature of gray change in the region, and the entropy value is small when the gray degree changes in the region are intensive. Figure 2. Offset of linear characteristic of a damaged building in post-event SAR image. a: aerial photo, b: TerraSAR-X spotlight
2.Ang. Second Moment, ASM
a
N 1
P
i , j 0
2
i, j
(2)
ASM describes the distribution uniformity of image grayscale. It can be used to detect the global homogeneity of texture.
3.Contrast
c
N 1
Pi j (i i j ,
j )2
(3)
, 0
Figure 3. A cartoon profile for figure2 As described in Figure 3, the partially collapsed building resulted in an interruption of the linear characteristics in the image of the right look descending SAR. The authors can draw a conclusion from the imaging mechanism that because of the blocking from the right building, the left building did not form an overlay in that image. As its top is not smooth, there occurred diffuse reflection. The change of elevation between the front and back caused an offset in the shadow region, which can be used as a seismic hazard criterion of the image. 2.2 Texture Feature of SAR Image For SAR data, image grayscale distribution expresses radar backscatter features. Different targets with similar scattering coefficient in the SAR images could show the similar grey value. As a result, SAR image always appear in complex grey level. Therefore, it is possible to improve the analysis precision by using the texture information of the target to compensate the deficiency of grey features in SAR image analysis. Several experiments indicated that the texture feature of SAR image is the effective feature to describe the overall distribution of all kinds of objects in the image. There are many definitions of texture of image, and it is generally believed that texture features are expressed through the grayscale distribution of the neighbourhood of the pixel and its surrounding space. The commonly used description methods include Grey Level Co-occurrence Matrices (GLCM), which is
It measures local grayscale changes and the degree of local change of image. It can be understood as the sharpness of image and can be used to determine texture strength. The greater the weight of contrast, the greater the power of the diagonal, the greater the value of the contrast in the high contrast region.
4.Inverse Difference Moment,IDM G 1 G 1
1 P(i, j ) 2 j 0 1 (i j )
IDM i 0
(4)
IDW is also affected by the homogeneity of images. Because of the weight, IDM will decrease when the area is not uniform. On the other hand, the higher regions of IDM represent better images of homogeneity. 2.3 Statistical Analysis In the segmentation process of image object-oriented classification, the authors choose to use the block as the object unit to carry on the statistics of texture feature. The highresolution SAR data is mainly used in TerraSAR-X spotlight mode image which captured Dujiangyan area after the Great Wenchuan Earthquake. By comparing the aftershock ground survey data and aerial photo, the authors selected block samples of different damage degree. As shown in Figure 4 and Figure 5. Then the authors calculated four main texture features based on GLCM for feature combination.
This contribution has been peer-reviewed. https://doi.org/10.5194/isprs-archives-XLII-3-39-2018 | © Authors 2018. CC BY 4.0 License.
40
The International Archives of the Photogrammetry, Remote Sensing and Spatial Information Sciences, Volume XLII-3, 2018 ISPRS TC III Mid-term Symposium “Developments, Technologies and Applications in Remote Sensing”, 7–10 May, Beijing, China
TerraSAR-X spotlight image, which is acquired form a descending orbit. The image was taken 3 days after the earthquake and has a spatial resolution of 1.5m.
Figure 4. Building samples in SAR image: intact
Figure 7. TerraSAR-X data used in study and study area
Figure 5. Building samples in SAR image: severely damaged Figure 6 gives the results of the statistical analysis of experiment. These results suggest that the intact geometry and the obvious shadow information make the intact buildings after the earthquake have a good consistency in the texture characteristics. On the contrary, destroyed buildings have different forms of damage, resulting in a variety of texture features. Nevertheless, the values of the texture feature can still be distinguished from intact buildings.
3.2 Fuzzy Classification Automatic remote sensing image classification methods consist of supervised classification and unsupervised classification. In recent years, many kinds of classification methods such as multi-source data composite texture analysis, artificial neural network, expert system, have shown up. For object-oriented image information extraction, fuzzy classification is core of the whole process. The fuzzy set theory was first proposed by the American automatic control expert Zadeh (1965). The theory is an extension of the traditional classical set theory and the history of fuzzy mathematics research. Uncertainty exist in remote sensing data acquisition, processing, analysis, which caused uncertainty and fuzziness in information extraction. This makes the fuzzy classification technique more suitable for the extraction of remote sensing information. Traditional classifiers such as maximum likelihood method, the minimum distance method, parallelepiped method, belong to a specific classification. Fuzzy classification based on fuzzy set theory, is a kind of expert system. Fuzzy classification converts the characteristic values between 0 and l fuzzy value in the process of image classification, to express membership degree of a category. After the analysis of object characteristics, the authors made fuzzy classification of image objects by eCongition software. First, the authors extracted class of intact based on texture feature. Then, according to the combination characteristics the rest of the unclassified object were divided into two classes, moderate damaged and severely damaged. The results are shown in the figure 8. It is proved that it is feasible to evaluate the damage degree of block and building based on texture analysis.
Figure 6. Feature statistics of intact and severely damaged buildings
3. FEATURE ANALYZING BASED FUZZY CLASSIFICATION 3.1 Study Area Our study area is the city of Dujiangyan, about 5.5km from the epicentre of Great Wenchuan Earthquake. Figure 7 shows a
This contribution has been peer-reviewed. https://doi.org/10.5194/isprs-archives-XLII-3-39-2018 | © Authors 2018. CC BY 4.0 License.
41
The International Archives of the Photogrammetry, Remote Sensing and Spatial Information Sciences, Volume XLII-3, 2018 ISPRS TC III Mid-term Symposium “Developments, Technologies and Applications in Remote Sensing”, 7–10 May, Beijing, China
Bai Y, Adriano B, Mas E, et al. Object-Based Building Damage Assessment Methodology Using Only Post Event ALOS2/PALSAR-2 Dual Polarimetric SAR Intensity Images. Journal of Disaster Research, 2017, 12(2):259-271. Cossu, R., Chaudhuri, S., Bruzzone, L., 2005. A ContextSensitive Bayesian Technique for the Partially Supervised Classification of Multitemporal Images. IEEE Geoscience and Remote Sensing Letters 2, 352–356. Celik, T., 2010. Change Detection in Satellite Images Using a Genetic Algorithm Approach. IEEE Geoscience and Remote Sensing Letters 7, 386–390. Dell'Acqua F, Gamba P. Remote Sensing and Earthquake Damage Assessment: Experiences, Limits, and Perspectives. In: Proceedings of the IEEE, 2012, 100(10):2876-2890. Figure 8. Building damage degree estimation in block scale 4. CONCLUSION AND DISCUSSION From our experiments, the authors concluded that those four texture features are effective to extract seismic damage building information. The limitations of this study are clear. The total sample selection needs to be further improved. While, a proper choice of identifying earthquake damage in a whole large region, is to use part of the disaster area for classification feature selection, because similar buildings have relatively close to the geometrical characteristics in the whole region and the texture features. Furthermore, to what extent the structure type of buildings and the spatial distribution of buildings had influence texture characteristics remains to be determined.
ACKNOWLEDGEMENTS This work is supported by the “Science of Earthquake Resilience Program of China Earthquake Administration” (XH16005Y). REFERENCES Bai Y, Adriano B, Mas E, et al. Shunichi Koshimura. Feature analyzing Based Building Damage Mapping from the ALOS2/PALSAR-2 SAR Imagery: Case Study of 2016 Kumamoto Earthquake. Journal of Disaster Research, Vol.12 No.sp pp. 646-655. Baselice F, Ferraioli G, Pascazio V. Markovian change detection of urban areas using very high resolution complex SAR images. Geoscience and Remote Sensing Letters, IEEE, 2014, 11(5): 995-999. Ban Y, Yousif O. Multitemporal space borne SAR data for urban change detection in China. Selected Topics in Applied Earth Observations and Remote Sensing, IEEE Journal of, 2012, 5(4): 1087-1094. Berberoglu, S., Akin, A., 2009. Assessing different remote sensing techniques to detect land use/cover changes in the eastern Mediterranean. International Journal of Applied Earth Observation and Geoinformation 11, 46–53.
Del Frate, F., Pacifici, F., Solimini, D., 2008. Monitoring Urban Land Cover in Rome, Italy, and Its Changes by SinglePolarization Multitemporal SAR Images. IEEE Journal of Selected Topics in Applied Earth Observations and Remote Sensing 1, 87–97. Gokon H, Koshimura S, Matsuoka M. Object-Based Method for Estimating Tsunami-Induced Damage Using TerraSAR-X Data (Special Issue on Disaster and Big Data). Journal of Disaster Research, 2016, 11. Hall, O., Hay, G.J., 2003. A Multiscale Object-Specific Approach to Digital Change Detection. International Journal of Applied Earth Observation and Geoinformation 4, 311–327. Hoffmann J. Mapping damage during the Bam (Iran) earthquake using interferometric coherence. International Journal of Remote Sensing, 2007, 28(6): 1199-1216. Liu, W., Matsuoka, M., Yamazaki, F., Nonaka, T., & Sasagawa, T.. Detection of building side-wall damage caused by the 2011 Tohoku, Japan earthquake tsunamis using high-resolution sar imagery.In: National Conference in Earthquake Engineering.2014 Matsuoka M, Nojima N. Building damage estimation by integration of seismic intensity information and satellite L-band SAR imagery. Remote Sensing, 2010, 2(9): 2111-2126. Matsuoka M, Yamazaki F. Building damage mapping of the 2003 Bam, Iran, earthquake using ENVISAT/ASAR intensity imagery. Earthquake Spectra, 2005, 21(S1): 285-294. Matsuoka M, Yamazaki F. Characteristics of satellite SAR images in the areas damaged by earthquakes. In: Geoscience and Remote Sensing Symposium, 2000.Proceedings. 6: P26932696. Matsuoka M, Yamazaki F. Use of satellite SAR intensity imagery for detecting building areas damaged due to earthquakes. Earthquake Spectra, 2004, 20(3): 975-994. Melgani, F., Moser, G., Serpico, S.B., 2002. Unsupervised changedetection methods for remote-sensing images. Optical Engineering 41, 3288–3297. Moser, G., Serpico, S.B., 2006. Generalized minimum-error thresholding for unsupervised change detection from SAR
This contribution has been peer-reviewed. https://doi.org/10.5194/isprs-archives-XLII-3-39-2018 | © Authors 2018. CC BY 4.0 License.
42
The International Archives of the Photogrammetry, Remote Sensing and Spatial Information Sciences, Volume XLII-3, 2018 ISPRS TC III Mid-term Symposium “Developments, Technologies and Applications in Remote Sensing”, 7–10 May, Beijing, China
amplitude imagery. IEEE Transactions on Geoscience and Remote Sensing 44, 2972–2982.
Marin, C., Bovolo, F., Bruzzone, L., 2015. Building Change Detection in Multitemporal Very High Resolution SAR Images. IEEE Transactions on Geoscience and Remote Sensing 53, 2664–2682. Plank S. Rapid Damage Assessment by Means of MultiTemporal SAR — A Comprehensive Review and Outlook to Sentinel-1. Remote Sensing, 2014, 6(6):4870-4906. Timo Balz, Mingsheng Liao. Building-damage detection using post-seismic high-resolution SAR satellite data. International Journal of Remote Sensing, 2010, 31(13):3369-3391.
This contribution has been peer-reviewed. https://doi.org/10.5194/isprs-archives-XLII-3-39-2018 | © Authors 2018. CC BY 4.0 License.
43