Earth’s Future COMMENTARY 10.1002/2014EF000273 Key Points: • Recent assessments of climate sensitivity exhibit apparent inconsistencies. • Causes of the inconsistencies and differences need to be identified.
Supporting Information: • Table S1. Numerical values and sources of quantities shown in Figure 1 of the article. • Table S2. Numerical values of Seq and sources of values of F − N of CMIP5 models shown in Figure 1 of the article.
Corresponding author: S. E. Schwartz,
[email protected]
Citation: Schwartz, S. E., R. J. Charlson, R. Kahn, and H. Rodhe (2014), Earth’s Climate Sensitivity: Apparent Inconsistencies in Recent Assessments, Earth’s Future, 2 601–605, doi:10.1002/2014EF000273.
Received 9 SEP 2014 Accepted 4 NOV 2014 Accepted article online 17 NOV 2014 Published online 8 DEC 2014
Earth’s Climate Sensitivity: Apparent Inconsistencies in Recent Assessments Stephen E. Schwartz1, Robert J. Charlson2, Ralph Kahn3, and Henning Rodhe4 1 Biological,
Environmental & Climate Sciences Department, Brookhaven National Laboratory, Upton, New York, USA, of Atmospheric Sciences, University of Washington, Seattle, Washington, USA, 3 NASA Goddard Space Flight Center, Greenbelt, Maryland, USA, 4 Department of Meteorology, Stockholm University, Stockholm, Sweden
2 Department
Abstract Earth’s equilibrium climate sensitivity (ECS) and forcing of Earth’s climate system over the industrial era have been re-examined in two new assessments: the Fifth Assessment Report (AR5) of the Intergovernmental Panel on Climate Change (IPCC), and a study by Otto et al. (2013). The ranges of these quantities given in these assessments and also in the Fourth (2007) IPCC Assessment are analyzed here within the framework of a planetary energy balance model, taking into account the observed increase in global mean surface temperature over the instrumental record together with best estimates of the rate of increase of planetary heat content. This analysis shows systematic differences among the several assessments and apparent inconsistencies within individual assessments. Importantly, the likely range of ECS to doubled CO2 given in AR5, 1.5–4.5 K/(3.7 W m−2 ) exceeds the range inferred from the assessed likely range of forcing, 1.2–2.9 K/(3.7 W m−2 ), where 3.7 W m−2 denotes the forcing for doubled CO2 . Such differences underscore the need to identify their causes and reduce the underlying uncertainties. Explanations might involve underestimated negative aerosol forcing, overestimated total forcing, overestimated climate sensitivity, poorly constrained ocean heating, limitations of the energy balance model, or a combination of effects. 1. Introduction Earth’s equilibrium climate sensitivity (ECS), the change in global mean near-surface temperature (GMST) that would ultimately result from a sustained forcing (i.e., imposed perturbation in planetary energy balance) has long been recognized as a key indicator of climate change that would result from future changes in atmospheric composition. Recently, two new assessments of ECS and of forcing of Earth’s climate system over the industrial era have been provided, by the Fifth Assessment Report (AR5) of the Intergovernmental Panel on Climate Change [IPCC, 2013], and by Otto et al. [2013]. These assessments indicate that ECS continues to be quite uncertain, to about a factor of 3; total forcing is likewise quite uncertain. Here we examine the consistency in current understanding of relationships between ECS and forcing with a simple energy balance model, using observationally based data and output of current global climate models (GCMs). By conservation of energy, the imbalance N of energy in Earth’s climate system taken as initially in steady state, subsequent to application of a forcing F can be expressed as N≡
This is an open access article under the terms of the Creative Commons Attribution-NonCommercial-NoDerivs License, which permits use and distribution in any medium, provided the original work is properly cited, the use is non-commercial and no modifications or adaptations are made.
SCHWARTZ ET AL.
dH = F − 𝜆ΔT, dt
(1)
where dH/dt is the rate of change of the heat content of the system, and where the radiative response of the system −𝜆ΔT is assumed, for small perturbation in the radiative budget of the system F, to be linear in the increase in the global surface temperature ΔT (forcing taken as positive, i.e., warming influence). Such a linear response might be thought of as the leading term of a Taylor’s series describing the response of GMST to a radiative perturbation. For a constant forcing indefinitely sustained on an otherwise stable system, the system would ultimately reach a new steady state temperature ΔT ss such that energy balance is restored (N = 0) and ΔT ss = F/𝜆, from which the equilibrium sensitivity is identified as Seq = 𝜆− 1 and in principle might be determined from the steady-state temperature change in response to a sustained forcing as Seq = ΔT ss /F. Alternatively, for the climate system not in steady state, the equilibrium sensitivity and forcing can be related [Gregory et al., 2002] through observations of the planetary heating rate Nobs and © 2014 The Authors.
601
Earth’s Future
10.1002/2014EF000273
change in GMST ΔT obs as Seq =
ΔTobs . F − Nobs
(2)
Here ΔT obs represents the temperature change of the climate system initially in a steady state in response to the forcing F, and Nobs represents the net energy imbalance (planetary heating rate) at the time of observation. Equation 2, which is widely used in interpretation of observed planetary temperature change [AR5, §10.8.1, p. 920; Knutti and Hegerl, 2008; Hansen et al., 2011] and which is found to hold to good accuracy in analyses of climate model responses [e.g. Andrews et al., 2012; Forster et al., 2013], serves as the basis for our examination of consistency in estimates of equilibrium sensitivity and forcing over the industrial period. As our analysis consists of an examination of consistency of climate sensitivity and forcing within the several assessments, we restrict consideration of the pertinent quantities to values given in these assessments, rather than independently assessing these quantities. For forcing we use the time periods and values given in the several assessments; the total or net forcing consists principally of positive forcing (warming influence) by incremental greenhouse gases (GHGs) and negative forcing (cooling influence) by anthropogenic aerosols. AR5 gives forcings for the period 1750–2011; these forcings are exerted predominantly after 1850. For ΔT obs we use the observed increase in GMST between 1850–1900 and 2003–2012, 0.78 [0.72–0.85] K as given in AR5 (§2.4.3, p. 294), where, as specified in AR5 (p. 5), the range denoted by the square brackets is expected to have a 90% likelihood of covering the value that is being estimated. For the heating rate Nobs AR5 gives estimates (Box 3.1, p. 264) that are based mainly on the increase in heat content of the global upper ocean (0–700 m) as inferred from ocean temperature measurements over two time periods, 1971–2010 and 1993–2010, which yield 0.43 [0.30–0.55] W m−2 , and 0.60 [0.46–0.73] W m−2 , respectively, suggesting a possible increase in heating rate over the time period. In principle the latter value would be a better estimate of the heating rate at the end of the time period, but because it relies on the difference in heat content over a shorter time period, it is more uncertain. In view of these considerations in the present analysis we use a central value and range that encompass both estimates, 0.51 [0.30–0.73] W m−2 . As the conventional measure of ECS corresponds to the steady state increase in GMST that would result from a sustained doubling of CO2 , for which the forcing is generally taken as 3.7 W m−2 [AR5, §TFE4, p. 68; Myhre et al., 1998], we present equilibrium climate sensitivity in the unit K/(3.7 W m−2 ) evaluated numerically as ECS =3.7 Seq . The unit K/(3.7 W m−2 ) preserves the familiar numerical values associated with climate system response to doubled CO2 while removing ambiguity due to differences in values of this forcing used in the several studies examined.
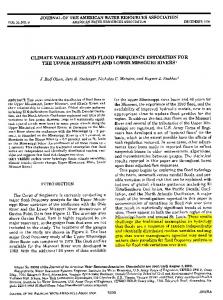
2. Forcing and Equilibrium Sensitivity The estimates of ECS and of forcing over the industrial period given in the two recent assessments [AR5 and Otto et al., 2013] and in the IPCC [2007] Fourth Assessment Report (AR4) are compared in Figure 1; numerical values and explicit citations to the sources of quantities shown in the figures are given in the Supporting Information. The black diagonal line in Figure 1 (slope: −1 on log-log plot) shows the relationship between ECS and F − N given by Equation (2). The observed increase in GMST and planetary heating rate together with Equation (2) constrain the values of ECS and forcing; if the value of one is known or assumed, then the value of the other is determined. The best estimates and likely ranges of total forcing over the industrial period as given by the three assessments are shown at the top of the figure. (Here we use the term "likely" in the sense of recent IPCC reports, namely as signifying that the probability of the true value of the quantity being within the indicated range exceeds 66%; AR5, p. 4, note 2.) Attention is called particularly to the increase in the estimate of forcing over the industrial period between AR4 and AR5; note that the best estimate of total forcing given in the AR5 assessment is not even within the likely range of forcing given in AR4. The change in forcing is due largely to a reduction in the magnitude of the negative aerosol forcing between AR4 and AR5, −1.2 W m−2 in AR4 versus −0.9 W m−2 in AR5; there is as well an increase in forcing by GHGs, from 2.63 to 2.83 W m−2 , that reflects the increases in their mixing ratios over the time between the two reports. The best estimate of forcing from the two IPCC assessments and from the assessment of Otto et al. [2013] and A. Otto (personal communication, 2013) each gives rise, within the energy balance model represented by Equation (2), to a value of ECS that would be consistent with that value of forcing. This is obtained in Figure 1 by projecting the forcing value onto the diagonal SCHWARTZ ET AL.
© 2014 The Authors.
602
Earth’s Future
10.1002/2014EF000273
7 6
ECS, K / (3.7 W m-2)
5 4
Otto et al
3
2
AR4 CMIP5 models
1 0.25
0.5
AR5
1.0
F - N, W
1.5
m-2
2.0
2.5 3.0
4.0
Range and best estimate of equilibrium climate sensitivity
Range and best estimate of forcing minus heating rate AR4 AR5 Otto et al
Figure 1. Equilibrium climate sensitivity ECS versus global-mean forcing F minus planetary heating rate N (log-log plot). Black diagonal line, slope = −1, denotes the relation ECS = 3.7 ΔT obs /(F − Nobs ), where values for the change in global mean surface temperature between 1850–1900 and 2003–2012 ΔT obs = 0.78 K and the global heating rate Nobs = 0.51 W m−2 , based on observations, are from best estimates given by the IPCC Fifth Assessment Report, AR5; dashed curves above and below black line, denote uncertainty in ECS propagated in quadrature from 5 to 95% likelihood ranges in ΔT obs , 0.72–0.85 K, and Nobs , 0.30–0.73 W m−2 as described in the text. Horizontal red, blue, and green line segments and circles at top of figure denote assessed "likely" range (central 66% of probability distribution function) and best estimate for global-mean forcing over the period (1750 to present) as given by the Fourth and Fifth IPCC Assessment Reports and by Otto et al. [2013] and A. Otto (personal communication), respectively, minus observed global heating rate, 0.51 W m−2 . Diagonal red, blue, and green line segments and circles denote projections of these ranges and best estimates onto the equilibrium sensitivity line. Vertical red, blue, and green line segments and circles at right denote "likely" range and best estimate from the several assessments (no best estimate given in AR5); sensitivity values for Otto et al. are increased from those given by those investigators by the factor 3.7/3.44 = 1.08 to account for the lower value of forcing of doubled CO2 employed in that study. Thin blue lines illustrate projection of forcing onto ECS and (dashed) associated uncertainty. Magenta circles denote F - N over the 20th century and Seq in current climate models as inferred by Forster et al. [2013] from twentieth century climate runs and abrupt 4 × CO2 experiments; for these points N is evaluated as ΔT in 20th century runs times ocean uptake efficiency obtained for the individual models in runs with CO2 increase rate 1% yr−1 ; see Table S2, Supporting Information.
line representing Equation 2. Each of the values of ECS obtained in this way is less than the corresponding best estimate of sensitivity; in AR5 no best estimate is given for ECS, but the value of ECS corresponding to the best estimate of forcing, 1.62 K/(3.7 W m−2 ), is nearly equal to the lower bound of the likely range given for ECS, 1.5 K/(3.7 W m−2 ). The values of ECS corresponding to the upper bound of the likely range of forcings, 1.21 and 1.71 K/(3.7 W m−2 ) are similarly well below (AR5) to essentially equal to (Otto et al.) the lower bounds of the corresponding likely ranges of sensitivities given in these assessments 1.5 and 1.61, K/(3.7 W m−2 ). In contrast, in AR4 the range of ECS obtained by projecting the upper and lower bounds of the likely forcing range, 1.80–5.73 K/(3.7 W m−2 ) is much more consistent, from an energy balance perspective, with the range of ECS given in that assessment, 2–4.5 K/(3.7 W m−2 ), raising the question why such consistency is lacking in AR5. Also shown in Figure 1 are values of F − N and ECS of 23 coupled atmosphere-ocean general circulation models (GCMs) that participated in the CMIP5 model intercomparison [Taylor et al., 2012] conducted in conjunction with the IPCC AR5 Assessment, as inferred by Forster et al. [2013] from twentieth century climate runs and 4 × CO2 experiments. The GCMs all employed forcings over the twentieth century (up to 2005) that resulted in values of F − N that were less, to substantially less, than those given by the AR5 and Otto et al. assessments. All values of F − N as inferred from the model runs are less than the value for the SCHWARTZ ET AL.
© 2014 The Authors.
603
Earth’s Future
10.1002/2014EF000273
best estimate forcing given by the AR5 assessment, and all but three are less than the value for the best estimate forcing given by Otto et al. ECS and F − N must be negatively correlated across climate models in order for the modeled increase in GMST to be more or less equal to the observed increase [Kiehl, 2007] and as exhibited in Figure 1. Hence, as the forcings employed in the model runs are in general lower than the ranges given by the two recent assessments, the values of ECS characterizing the GCM runs tend to exceed those given in those assessments. Of the 23 GCMs examined by Forster et al. [2013] all but one exhibited values of ECS that exceed the Otto et al. best estimate, and more than half exceed the upper end of the likely range of ECS given by Otto et al. Of the 23 GCMs, 5 GCMs exhibited sensitivities greater than the upper end of the likely range of ECS given by AR5, 4.5 K/(3.7 W m−2 ), with none below the lower end of that range and with the lowest value for the GCMs, 2.07 K/(3.7 W m−2 ) considerably exceeding the lower end of the AR5 likely range, 1.5 K/(3.7 W m−2 ). The discrepancy is even greater when values of ECS of the climate models are compared to values that are consistent with the best estimates and ranges of forcings given in these assessments. All the equilibrium sensitivities of the models exceed the values that are consistent with the best estimate forcings as given both by AR5 and Otto et al., 1.62 and 2.01 K/(3.7 W m−2 ), respectively; all but five exceed the upper bound ECS consistent with the likely range of forcing given by AR5, 2.89 K/(3.7 W m−2 ), and all but four exceed that for the Otto et al. likely forcing range, 2.65 K/(3.7 W m−2 ). In contrast the range of equilibrium sensitivities characterizing the GCMs is more consistent with the lower range of forcings and higher range of equilibrium sensitivities given in AR4 (all but three and two values, respectively, within the stated likely ranges). It is thus clear that there are discrepancies, relative to expectation based on energy-balance considerations, between the range of forcings employed in the CMIP5 twentieth century model runs and the best estimates and ranges of forcings given in the AR5 and Otto et al. assessments, and that these discrepancies lead to even greater discrepancies in sensitivities among the several assessments and between the GCMs and the assessments.
3. Conclusions The present analysis shows systematic differences among the several assessments and apparent inconsistencies within individual assessments. As seen in Figure 1, the likely range of climate sensitivity as given in each of the recent assessments extends to values greater than the range that would be consistent, within the framework of a global energy-balance model, with the range of forcings given in the assessments. This situation is especially evident for AR5, for which the likely range of ECS, 1.5 to 4.5 K/(3.7 W m−2 ) is considerably greater than the range, 1.2 to 2.9 K/(3.7 W m−2 ), inferred from the assessed likely range of forcing. These differences and inconsistencies give rise to several questions: 1. What degree of confidence can be placed in the large reduction in the magnitude of negative aerosol forcing and resultant increase in total forcing over the industrial period, as assessed in AR5 versus AR4? 2. Given the increase in forcing adopted by AR5 relative to that of AR4, why is there so little decrease in the assessment of ECS adopted by AR5 relative to that of AR4, as would be expected from energybalance considerations? 3. Why, especially in AR5, is there such a great difference between the likely range of ECS given in the assessment, 1.5–4.5 K/(3.7 W m−2 ), and that inferred from the likely range of forcing over the industrial period, together with observed increase in GMST and planetary heating rate, 1.2–2.9 K/(3.7 W m−2 )? 4. Why are the values of F – N in the CMIP5 model calculations of climate change over the twentieth century systematically lower than the range of this quantity determined as the AR5-assessed likely range of forcing minus the observed planetary heating rate (Figure 1)? One possible explanation for the apparent inconsistencies between estimated forcing and sensitivity in the recent assessments may be that the measurements leading to best estimates of increase in GMST and/or planetary heating rate are erroneous or have not sufficiently sampled the planet to provide an adequate assessment. Second, it might be argued that the global energy balance model used here does not accurately reflect climate response to forcing. In this regard, we note that this model, which is rooted in conservation of energy in the climate system, has been successfully used to interpret the output of more complex climate models, including GCMs, [e.g., Forster et al., 2013], and is widely used not just in the interpretation of anthropogenic climate change but also in the interpretation of paleoclimate change SCHWARTZ ET AL.
© 2014 The Authors.
604
Earth’s Future
10.1002/2014EF000273
[e.g., Hansen et al., 2013]. To the extent that the energy balance model holds, the forcings and equilibrium sensitivities must be consistent with the planetary heating rate and increase in global temperature; as noted above such consistency is exhibited in the AR4 estimates. Resolution of these apparent inconsistencies will require careful re-examination of total forcing and, as aerosol forcing is the most uncertain component of that forcing, more accurate estimates of aerosol forcing, as has been emphasized previously [e.g., Ramanathan and Feng, 2008; Schwartz et al., 2010; Hansen et al., 2011]. Recent re-examination of model-based estimates of aerosol direct forcing [Samset et al., 2014] has led to a slight increase in the estimated uncertainty over that given in AR5, but this increase (presented as a lower bound) does little to resolve the inconsistencies highlighted here. Reducing the uncertainty in aerosol forcing is a daunting challenge [e.g., Kahn, 2012], but given the importance of accurate knowledge of this quantity to interpretation of climate change and projections of future climate change this would seem essential. In summary, examination of estimates of climate sensitivity and forcing over the twentieth century in recent assessments in the framework of a global energy balance model shows apparent inconsistencies relative to measurements of the increase in global mean surface temperature over this time and the net heat flux into the planet. Potential contributing factors are underestimated negative aerosol forcing, overestimated total forcing, overestimated climate sensitivity, poorly constrained ocean heating, and limitations of the energy-balance model. However, determining the contributions of each does not seem possible at present. We hope that calling attention to these apparent inconsistencies will stimulate investigation of the reasons for them and, ultimately, their resolution, leading to enhanced confidence in the quantitative understanding of the response of the climate system to past perturbations and to estimates of future response to past and prospective future emissions of GHGs and aerosols. Acknowledgments We thank several referees for valuable comments and Editor Guy Brasseur for encouragement. SES was supported by the U.S. Department of Energy’s Atmospheric System Research Program (Office of Science, OBER) under Contract No. DE-AC02-98CH10886. All data and sources are given in Supporting Information.
SCHWARTZ ET AL.
References Andrews, T., J. M. Gregory, M. J. Webb, and K. E. Taylor (2012), Forcing, feedbacks and climate sensitivity in CMIP5 coupled atmosphere-ocean climate models, Geophys. Res. Lett., 39, L09712, doi:10.1029/2012GL051607. Forster, P. M., T. Andrews, P. Good, J. M. Gregory, L. S. Jackson, and M. Zelinka (2013), Evaluating adjusted forcing and model spread for historical and future scenarios in the CMIP5 generation of climate models, J. Geophys. Res.: Atmos., 118, 1139–1150, doi:10.1002/jgrd.50174. Gregory, J. M., R. J. Stouffer, S. C. B. Raper, P. A. Stott, and N. A. Rayner (2002), An observationally based estimate of the climate sensitivity, J. Clim., 15, 3117–3121, doi:10.1175/1520-0442(2002)0152.0.CO;2. Hansen, J., M. Sato, P. Kharecha, and K. von Schuckmann (2011), Earth’s energy imbalance and implications, Atmos. Chem. Phys., 11, 13421–13449, doi:10.5194/acp-11-13421-2011. Hansen, J., M. Sato, G. Russell, and P. Kharecha (2013), Climate sensitivity, sea level and atmospheric carbon dioxide, Phil. Trans. R. Soc. A, 371, 20120294, doi:10.1098/rsta.2012.0294. IPCC (2007), Climate Change 2007: The Physical Science Basis (AR4), in Intergovernmental Panel on Climate Change, edited by S. Solomon, D. Qin, M. Manning, Z. Chen, M. Marquis, K. B. Averyt, M. Tignor, and H. L. Miller, Cambridge University Press, Cambridge, U. K. http://www.ipcc.ch/publications_and_data/ar4/wg1/en/contents.html. IPCC (2013), Climate Change 2013: The Physical Science Basis (AR5), edited by T. F. Stocker, D. Qin, G.-K. Plattner, M. Tignor, S. K. Allen, J. Boschung, A. Nauels, Y. Xia, V. Bex, and P. M. Midgley, Cambridge University Press, Cambridge, U. K. http://www.climate2013.org/images/report/WG1AR5_ALL_FINAL.pdf. Kahn, R. A. (2012), Reducing the uncertainties in direct aerosol radiative forcing, Surv. Geophys., 33, 701–721, doi:10.1007/s10712-011-9153-z. Kiehl, J. T. (2007), Twentieth century climate model response and climate sensitivity, Geophys. Res. Lett., 34, L22710, doi:10.1029/2007GL031383. Knutti, R., and G. C. Hegerl (2008), The equilibrium sensitivity of the Earth’s temperature to radiation changes, Nat. Geosci., 1, 735–743, doi:10.1038/ngeo337. Myhre, G., E. J. Highwood, K. P. Shine, and F. Stordal (1998), New estimates of radiative forcing due to well mixed greenhouse gases, Geophys. Res. Lett., 25, 2715–2718, doi:10.1029/98GL01908. Otto, A., et al (2013), Energy budget constraints on climate response, Nat. Geosci., 6, 415–416, doi:10.1038/ngeo1836. Ramanathan, V., and Y. Feng (2008), On avoiding dangerous anthropogenic interference with the climate system: Formidable challenges ahead, Proc. Natl. Acad. Sci. U. S. A., 105, 14245–14250, doi:10.1073/pnas.0803838105. Samset, B. H., G. Myhre, and M. Schulz (2014), Upward adjustment needed for aerosol radiative forcing uncertainty, Nat. Clim. Change, 4(4), 230–232, doi:10.1038/nclimate2170. Schwartz, S. E., R. J. Charlson, R. A. Kahn, J. A. Ogren, and H. Rodhe (2010), Why hasn’t Earth warmed as much expected?, J. Clim., 23, 2453–2464, doi:10.1175/2009JCLI3461.1. Taylor, K. E., R. J. Stouffer, and G. A. Meehl (2012), An overview of CMIP5 and the experiment design, Bull. Am. Meteorol. Soc., 93, 485–498, doi:10.1175/BAMS-D-11-00094.1.
© 2014 The Authors.
605