Ballard, W. B., J. S. Whitman, and D. J. Reed. 1991. Population ...... Hendee, J. C. 1974: A multiple-satisfaction approach to game management. - Wildlife ... McCullough, D. R. 1979: The George Reserve deer herd: population ecology of a.
ECOLOGICAL AND SOCIAL INFLUENCES ON POPULATION DYNAMICS AND GENETICS OF MOOSE IN ALASKA
By Jennifer Irene Schmidt
RECOMMENDED: ____________________________________________ ____________________________________________ ____________________________________________ ____________________________________________ Advisory Committee Chair ____________________________________________ Assistant Chair, Department of Biology and Wildlife
APPROVED:
Dean, College of Natural Science and Mathematics ____________________________________________ Dean of the Graduate School ____________________________________________ Date
ECOLOGICAL AND SOCIAL INFLUENCES ON POPULATION DYNAMICS AND GENETICS OF MOOSE IN ALASKA
A THESIS
Presented to the Faculty of the University of Alaska Fairbanks in Partial Fulfillments of the Requirements for the Degree of
DOCTOR OF PHILOSOPHY
By Jennifer Irene Schmidt, B.S.
Fairbanks, Alaska August 2007
iii ABSTRACT I examined social and ecological influences on moose (Alces alces gigas) in Alaska, USA, with respect to hunting success, antler size, and population genetic structure. Catch per unit effort (CPUE) is frequently used to assess hunter success; thus I hypothesized that landscape characteristics and moose density would affect success. Using hunter harvest tickets returned to the Alaska Department of Fish and Game, I modeled CPUE with Weibull regression. I determined success is significantly predicted by hunt location, mode of transportation, hunting regulations, use of commercial services (i.e., guides), year, road density, hunter-to-moose ratio, moose density, and hunter residency status. Antler size is an important factor for hunters and for mating potential in male moose. I hypothesized that moose density, habitat, and use of guides would correlate with antler size of harvested moose. I also predicted that guides would harvest moose with larger antlers and avoid areas where the hunter-to-moose ratio is high compared to nonguided hunters. Results indicated that antler size decreases with increases in moose density and harvest intensity due to density-dependent processes and a younger age structure in heavily harvested areas. Guided hunts tended to harvest larger antlered bulls and avoided areas of high hunter-to-moose ratios. In addition to age and nutrition, genetics influences antler size. I used eight microsatellites and five sample areas to resolve whether population structure exists among moose in Alaska. I hypothesized that population structure does exist given the intense harvest rates, polygynous mating style of moose, and heterogeneous landscape present in Alaska. Dispersal and gene flow between populations was proposed to occur
iv via isolation-by-distance (IBD) with a positive linear relationship between geographic and genetic distance. Results indicated weak but significant population structure for moose in Alaska, and IBD was supported. Pairwise comparisons between populations indicated that moose have established separate populations except for between Tanana Flats and Koyukuk and Koyukuk and the Seward Peninsula. Lastly, I hypothesized incorporation of landscape characteristics and subsequent least-cost path would strengthen the significance of IBD. With an additional population, Tetlin, the significance of IBD as a mechanism for dispersal/gene flow for moose in Alaska was improved.
v TABLE OF CONTENTS Page Signature Page ..................................................................................................................... i Title Page ............................................................................................................................ ii Abstract .............................................................................................................................. iii Table of Contents.................................................................................................................v List of Figures .................................................................................................................... ix List of Tables .......................................................................................................................x Acknowledgements............................................................................................................ xi Introduction..........................................................................................................................1 CHAPTER 1 Catch per unit effort for moose: a new approach using Weibull regression 1.1 Abstract ..........................................................................................................................5 1.2 Introduction....................................................................................................................7 1.3 Materials and Methods...................................................................................................9 1.31 Databases and Study Extent.............................................................................9 1.32 Rivers and Roads ...........................................................................................10 1.33 Landscape and Habitat Characteristics ..........................................................10 1.34 Surveys and Moose Densities ........................................................................11 1.35 Kriging ...........................................................................................................12 1.36 Human Indices ...............................................................................................13 1.37 Statistical Analyses ........................................................................................14
vi Page 1.4 Results..........................................................................................................................16 1.41 Characteristics of Hunts and Success of Hunters ..........................................16 1.42 Models for Catch per Unit Effort...................................................................16 1.5 Discussion ....................................................................................................................19 1.6 Management Implications............................................................................................23 1.7 Acknowledgements......................................................................................................24 1.8 References....................................................................................................................25 CHAPTER 2 Antler size of Alaskan moose: effects of population density, hunter harvest, and use of guides 2.1 Abstract ........................................................................................................................43 2.2 Introduction..................................................................................................................45 2.3 Materials and Methods.................................................................................................49 2.31 Locality and Data...........................................................................................49 2.32 Statistical Analyses ........................................................................................52 2.4 Results..........................................................................................................................54 2.41 Moose Density, Habitat, and Use of Guides..................................................54 2.42 Selectivity and Intensity of Harvest...............................................................55 2.5 Discussion ....................................................................................................................56 2.51 Antler Size and Population Density...............................................................56 2.52 Effects of Habitat ...........................................................................................58
vii Page 2.53 Selectivity of Harvest.....................................................................................59 2.54 Harvest Intensity and Antler Size ..................................................................61 2.55 Genetics and Harvest .....................................................................................62 2.6 Acknowledgements......................................................................................................62 2.7 References....................................................................................................................63 CHAPTER 3 Population structure and genetic diversity of moose in Alaska 3.1 Abstract ........................................................................................................................82 3.2 Introduction..................................................................................................................83 3.3 Materials and Methods.................................................................................................86 3.31 Tissue Collection and DNA Extractions........................................................86 3.32 Genotyping.....................................................................................................87 3.33 Statistical Analysis.........................................................................................87 3.4 Results..........................................................................................................................89 3.5 Discussion ....................................................................................................................92 3.6 Acknowledgements......................................................................................................98 3.7 References....................................................................................................................98 CHAPTER 4 Effects of Landscape Characteristics on Population Connectivityof Alaskan moose: a comparative test 4.1 Abstract ......................................................................................................................114
viii Page 4.2 Introduction................................................................................................................115 4.3 Methods......................................................................................................................118 4.31 Samples and Genotyping .............................................................................118 4.32 Genetic Statistical Analysis .........................................................................119 4.33 Study Area and Landscape Features ............................................................122 4.34 Friction Maps and Population Connectivity ................................................125 4.35 Landscape Interpretation of Paths................................................................127 4. 4 Results.......................................................................................................................129 4.5 Discussion ..................................................................................................................134 4.6 Acknowledgements....................................................................................................144 4.7 Literature Cited ..........................................................................................................145 4.A Appendix...................................................................................................................176 Conclusions......................................................................................................................178 Literature Cited ................................................................................................................184
ix LIST OF FIGURES Page Figure 1.1 Predicted moose hunt success for a 6-day hunt................................................32 Figure1.2A Linear regression model of catch per unit effort ............................................33 Figure1.2B Weibull regression model of catch per unit effort. .........................................34 Figure 1.3 Models of catch per unit effort (CPUE) for guided and nonguided hunts .......35 Figure 2.1 Study area where moose were harvested in interior Alaska, USA...................77 Figure 2.2 Mean (cm ± SD) antler size of moose harvested by guided and nonguided ....78 Figure 2.3 Hunter-to-moose ratio in areas used by guided and nonguided .......................79 Figure 2.4 Mean (cm ± SD) antler size of moose by harvest intensity..............................80 Figure 3.1 Moose populations used for microsatellite analysis in Alaska.......................109 Figure 3.2 Pairwise population comparisons with FST† values, RST§ values, and............110 Figure 3.3 Estimated number of populations (k) from STRUCTURE versus.................111 Figure 3.4 Ln of geographic distance versus FST/1-FST (Rousset 1997) for moose.........112 Figure 4.1A Least-cost path three based on friction costs among six moose ..................162 Figure 4.1B Least-cost path four based on friction costs among six moose....................163 Figure 4.2 Neighbor-joining tree (Saitou & Nei M 1987) based on unbiased Nei’s .......164
x LIST OF TABLES Page Table 1.1 Average success for moose hunters from 1997 to 2001 ....................................36 Table 1.2 Predicted success coefficients from Logistic Regression and Weibull models.38 Table 2.1 Proportion of guided, unguided, transporter, and nontransported hunts and.....81 Table 3.1 Sample size, mean number of alleles (NA), private alleles, expected heterozygosity (HE),.........................................................................................................113 Table 4.1 Results from Mantel tests and linear regression (RADJ2)..................................165 Table 4.2 Percentage of the top two least-cost path models for moose in Alaska...........168 Table 4.3 Sample size, number of alleles (NA), allelic richness, number of private .......174 Table 4.4 Results from Bayesian dispersal proportions (BAYESASS; Wilson & Ranalla 2003) for moose in Alaska...............................................................................................175
xi ACKNOWLEDGEMENTS Credit for this achievement belongs to my dearly beloved Mother who unfortunately passed away just over of a year before my graduation. She provided and continues to provide me strength and guidance. I truly wish her physical presence was here and can only hope that she is looking down from a peaceful place. In addition, I would like to acknowledge the support, strength, and incredible stability and wise enlightenment provided by my brother, Brian Paul Schmidt, and father, Raymond Paul Schmidt. I am forever in debt to the family members mentioned above. I also would like to thank my current and past committee members who have provided guidance and support along this arduous journey. I would like to thank Dr. Kevin McCracken and Dr. Terry Bowyer, who have provided a source of stability, familiarity, and wisdom over the years. Valuable insights from Dr. McCracken and Dr. Bowyer have certainly benefited the fields of moose population dynamics and genetics. A past committee member I would like to give thanks to is Jay VerHoef who helped me struggle through statistics, and his brilliance formed the novel foundation and valuable insight in Chapter One. Funding for my education was largely provided by the interdisciplinary graduate and research education (IGERT) and regional resilience and adaptation (RAP) programs. I am very thankful for not only for financial support, but the holistic ideology and philosophy of this program at the University of Alaska Fairbanks. A majority of my laboratory research was funded by an Alaska EPSCoR seed grant. In addition, attendance to conferences was provided by Alaska EPSCoR, IGERT, and the Biology
xii and Wildlife Department at the University of Alaska Fairbanks. Due to the dedication of the professors in IGERT and RAP, especially Terry Chapin and Gary Kofinas, and the extremely insightful social, economical, and biological required courses I have been bestowed with the ability to communicate more effectively with researchers from other disciplines, become a passionate researcher with a sense of humility, and overall strive to become a more well-rounded individual.
1 INTRODUCTION One recent shift in biological research and wildlife management is the recognition that humans are a part of the ecosystem and their environment. In the context of this shift in thinking, research in wildlife management and conservation needs to incorporate social and ecological issues, regardless of whether species or ecosystem processes are the focus of the research. Clearly, wildlife managers can incorporate both ecology and relevant societal issues into their research designs and management plans. My dissertation incorporates both ecological and social influences to improve knowledge for effective wildlife management of large ungulates such as moose (Alces alces). Population dynamics and life-history characteristics including physical attributes, reproduction, mating strategies, the role of density-dependent processes, predator-prey interactions, and dispersal patterns of moose all necessitate a holistic perspective. Furthermore, moose are a keystone species and can play a dominant role in the boreal-forest ecosystems in Alaska (Molvar et al. 1993; Simberloff 1998). Moose influence many ecological processes such as rates of nutrient cycling and composition of plant and animal communities (Pastor et al. 1993, Kielland et al. 1997, Kielland and Byrant 1998). Moose are also important culturally and provide a vital dietary source of protein for many people (Ballew et al. 2006). Through consumptive (i.e., hunting) and non-consumptive (i.e., viewing) uses, moose are an important economic component of Alaska (Snepenger and Bowyer 1990). In summary, moose are important ecologically, socially, and economically.
2 The research design and hypotheses of my dissertation included both ecological and social effects on various facets the population ecology of moose (Alces alces gigas) in Alaska. My first two chapters focused on social questions relating to moose and their harvest and management; insights from these chapters enabled me to better formulate and understand results from the latter two chapters, which are more ecological and molecular in their orientation. In Chapter One, I investigated the influence of moose-hunter characteristics and landscapes on harvest success and catch per unit effort (CPUE). Success and CPUE are influenced by the characteristics and motivations of hunters. I predicted that success provided via type of transportation, employment of a guide, moose density, and landscape features would result in spatial variation of harvest and hunter success. In addition, I evaluated whether CPUE could be modeled more effectively with Weibull regression than with previously acknowledged inadequate methods, such as linear regression (Stankey et al. 1973; Solberg et al. 2000), which indicate decreased success with increased effort. In Chapter Two, I explored the relationship between moose density, harvest intensity, habitat, and antler size. I hypothesized that increased moose density and harvest intensity result in smaller size of moose antlers as a result of lower nutrition available to moose and reduced age of males by intense harvests. Larger-antlered moose would be more likely to occur in areas of good habitat with nutritious foods rather than inareas of low habitat quality and nutrition for moose. I also predicted that guided moose hunts would harvest larger antlered moose than would nonguided hunts in areas with the
3 same moose density because of the hunting skills of guides. Furthermore, guides would selectively hunt in areas of low hunter-to-moose ratios to meet desires of their clients for harvesting moose with a large antler size. Chapter Three explored the genetic population structure of moose in Alaska. Even though moose colonized Alaska recently (in evolutionary time), I predicted that population structure of moose in Alaska would occur because of the vast and heterogeneous area, variable selective pressures from hunting, and life-history characteristics such as male-biased dispersal (Hundertmark 1998) and polygamous mating (Schwartz and Hundertmark 1993). In addition, I hypothesized that isolation by distance (IBD) would partially explain observed structure with closer populations more related than more distant populations. Lastly in Chapter Four, I inferred that incorporation of ecological and social landscape features such as vegetation, fire, past and present glaciers, roads, and railways would improve the positive relationship between geographic and genetic distance. I modeled four different least-cost paths connecting moose populations based on four different friction surfaces that incorporated landscape features with assigned cost values according to four different models. With these four models, I tested whether good or bad moose habitat would be a likely dispersal corridor. I also tested whether the incorporation of habitat and permanent landscape features or only permanent landscape features where effects of habitat were minimized would better improve the relationship between geographic and genetic distance. In my dissertation I have explored the social, ecological, and genetic components
4 life-history of a quintessential Alaskan ungulate, the moose. In order to obtain insightful and useful knowledge, one must approach a problem from multiple aspects and disciplines. Scientific research with this approach can address broader and more insightful issues that can be utilized by a wider audience. In the end, my dissertation based on this approach will most certainly improve understanding of the population dynamics, genetics, and wildlife management of not only moose, but other ungulates.
5 CHAPTER 1 CATCH PER UNIT EFFORT FOR MOOSE: A NEW APPROACH USING WEIBULL REGRESSION 1 1.1 ABSTRACT The relationship between hunters and their environment is a key component in managing wildlife populations. Hunters’ characteristics, motivations, and efforts are crucial to understanding if a hunt will be successful. We predicted that landscape characteristics and moose (Alces alces) densities would affect success of hunts. Similar to wildlife management elsewhere, moose hunters in interior Alaska, USA, must return harvest tickets to the Alaska Department of Fish and Game. These tickets provide location of hunts (Uniform Coding Units) and other details. Our modeling of responses (1997–2001) from harvest tickets indicated that location of hunts, mode of transportation, hunting regulations, use of commercial services, year, density of roads, hunter-to-moose ratio, moose density, and residency of hunters were important predictors of success. In addition, we documented that the linear-regression approach to measuring catch per unit effort (CPUE) was inadequate because it produced an inverse, but not significant, relationship between hunting effort and success. This outcome occurred because most hunts, particularly for large mammals, ended with the harvesting of an animal. Likewise, modeling hunter success with logistic regression was similarly biased by measures of hunter effort. We established that a time-to-event Weibull regression provided 1
Schmidt, J.I., Ver Hoef, J.M., Maier, J.A.K., Bowyer, R.T. 2005. Catch per unit effort for moose: a new approach using Weibull regression. Journal of Wildlife Management 69:1112-1124.
6 substantial improvement over standard models of CPUE. Weibull regression accurately represented the positive relationship between effort and success, and it can be used to model length of hunt and other covariates related to hunters and landscape characteristics for predicting success.
7 1.2 INTRODUCTION Rates of hunter success are influenced by characteristics, motivations, and degree of satisfaction of those seeking to harvest animals (Stankey 1973, Albert et al. 2001, Hayslette et al. 2001). Research related to social aspects of hunting ungulates has focused on satisfaction of hunters in relation to management (McCullough and Carmen 1982; Rollins and Romano 1989; Lauber and Knuth 1997, 1999; Fulton and Hundertmark 2004) or on general characteristics of hunters and their hunts (Miller et al. 1994, Ericsson et al. 2000). Preferences, motivations, and effort levels of hunters directly influence harvest success, selection of a particular species, animal harvested, and areas hunted (Stankey et al. 1973, Getz and Haight 1989, Ericsson et al. 2000, Solberg et al. 2000, Albert et al. 2001, Hayslette et al. 2001, Frey et al. 2003). Previous approaches to modeling hunter effort typically have used regression to analyze catch per unit effort (CPUE; Seber 1992, Lancia et al. 1996, Maunder and Starr 2003, Smith et al. 2003). CPUE is used commonly by the fishing industry to assess status of populations (Dupont 1983, Richards and Schnute 1992, Gould and Pollock 1997, Maunder 2001, Goodyear 2003), and to aid development of fishing and hunting regulations (Lancia et al. 1988, Sigler and Lunsford 2001). Results from the fishing industry indicate assessment of populations is strengthened when independent estimates of population size are used in combination with CPUE (Worthington et al. 1998, Maunder and Starr 2003). Nonetheless, CPUE for big game often is calculated as the number of animals killed per days hunted without incorporation of independent estimates of population size (Laake 1992, Lancia et al.
8 1996, Bowyer et al. 1999, Hatter 2001, Van Deelen and Etter 2003). Indeed, this metric has been used to detect changes in moose population sizes (Mercer and Manuel 1974; Crête et al. 1981; Crête and Dussault 1987; Crichton 1993; Hatter 1998, 2001). Bowyer et al. (1999) and Hatter (2001) agree, however, that CPUE is not always reliable and can overestimate increases in population size and underestimate population decreases. Moreover, Bowyer et al. (1999) reported an unexpected inverse relationship between harvest and effort when moose densities were low. Despite some shortcomings, CPUE is still used widely by wildlife managers (Novak et al. 1991, Laake 1992, Lancia et al. 1996, Cooper et al. 2003). When the bag limit is only a single animal, however, traditional approaches for calculating CPUE may be inadequate. Uncertainty about the expected linear relationships between effort and hunting success has been expressed previously (Bowyer et al. 1999, Lancia et al. 1996, Hatter 2001, Maunder 2001, Van Deelen and Etter 2003), which we believe is related to the all-or-none nature of harvesting of large mammals. Moreover, uncertainty in estimates of CPUE may be associated with changes in regulations, (particularly those affecting size limits), and with a nonlinear relationship between catch and effort (Worthington et al. 1998, Solberg et al. 2000). Understanding how characteristics of hunters and landscapes influence harvest is equally important in understanding the relationship between effort and success. We predicted that: 1) choice of transportation would influence rates of success because of access, 2) increased motivation and effort of hunters, as measured by employment of guides, would increase hunt success, 3) spatial variation between game management units
9 (GMU) would affect harvest, and 4) density of moose and the hunter-to-moose ratio would influence success, with areas of high moose density experiencing higher rates of success and reduced effort and areas of high hunter-to-moose ratio experiencing lower rates of success and more effort. Moreover, we used Weibull regression to assess CPUE, by modeling the length of a successful hunt directly. We compared standard methods used to evaluate CPUE, and illustrated the inability of those procedures to cope with the censored nature of harvesting a moose. These analyses enable prediction of future demand for resources related to moose hunting, and provide insights into the motivation of individuals who hunt. 1.3 MATERIALS AND METHODS 1.31 Databases and Study Extent Licensed moose hunters in Alaska must obtain a harvest tag that is returned to ADF&G whenever a moose is killed. We analyzed data from 1997 to 2001 hunting seasons. Several characteristics of moose hunting, such as transportation, residency, use of commercial services (i.e., transporter or registered guide), and length of trip were recorded on harvest tickets. Registered guides in Alaska must pass certification and become registered with the State, whereas, transporters do not require certification and include anyone who provides travel assistance during a hunt. Returned tickets were coded by Uniform Coding Units (UCU )that established the sampling units for most of our analyses. Although we have no independent method to verify the accuracy of moose-harvest tickets, previous research in Alaska indicates that such tickets provide a reasonable indication of characteristics of most hunters and their harvest (Albert et al.
10 2001). However, given the remoteness and isolation of many rural villages, a potential bias in our dataset exists in that rural or Native hunters may be underreported in our dataset. Maps for analyses of landscapes, hunter access, and management units were provided by the Alaska Department of Natural Resources and Division of Wildlife Conservation of ADF&G. 1.32 Rivers and Roads Rivers provide an index of how drainages influence moose habitat and access for hunters via boats during autumn. Rivers also provide trails for snowmobiles and dogsleds and landing strips for aircraft in winter and autumn. Geographic information system (GIS) coverage of rivers was extensive and included all navigable and unnavigable waters within interior Alaska. Roads strongly affect human presence and access. Roads included primary and secondary highways, those under construction, as well as tracks, trails, and footpaths. We calculated density values for rivers and roads by totaling the length (km) of rivers or roads encompassed by an UCU, divided by the area (km2) of the UCU. Alaska contains few roads, so density estimates would have resulted in many zeros. Consequently, we represented the potential effects of roads by estimating the distance from the center point of a UCU to the nearest road. To scale and aid comparisons of model coefficients for roads and river density values, we divided values by 100 and 1,000, respectively. 1.33 Landscape and Habitat Characteristics Landscape characteristics included slope, aspect, and vegetation, which we obtained from the Spatial Ecology Laboratory at the University of Alaska Fairbanks.
11 Aspect was sine and cosine transformed for subsequent analyses (Zar 1999). We used variation in aspect and slope to calculate terrain variability (Nicholson et al. 1997). The terrain index, as used by Nicholson et al. (1997) for modeling habitat selection by mule deer (Odocoileus hemionus), is a function of the deviation of the mean angular aspect multiplied by the standard deviation of slope. Hence, a higher value for terrain implies an increase in ruggedness, thereby hindering mobility and decreasing the likelihood of ungulate dispersal. Terrain grids were generated at numerous scales based on various pixel sizes. We used the grid with pixel scale of 114 km2 for assessing terrain characteristics because that size was more representative of the average UCU and was likely the maximal extent to which a hunter would consider terrain when moose hunting. 1.34 Surveys and Moose Densities We estimated moose densities via ADF&G aerial surveys during autumn from 1997 through 2001. We based areas selected for aerial surveys on management needs and intensity of hunter use. Survey methods involved counting all moose in randomly selected sample units of 2’ latitude and 5’ longitude (~12 km2) within survey areas (Ver Hoef 2001, 2002). Use of this survey method helped us establish the spatial extent of our study area. We surveyed 39,332 km2, with some sample units within the region were sampled for multiple years. We sampled 2,665 units; when density was estimated in >1 year in a unit, we used the average. We only used female moose in population density estimates because they show more site fidelity than males (Ballard et al. 1991). We also chose female moose because surveys were conducted after hunting season when estimates of moose density are less
12 affected by the autumn hunt that targets mostly males (Schwartz et al. 1992). We acknowledge that moose density estimates were based on female moose when males were most likely to be harvested; however, because surveys were conducted after the autumn hunting season, estimates of males would have been confounded by hunter selection, alterations in the sex ratio, and variation in success rates. Because surveys are conducted in autumn shortly after the rut, males are likely to have been congregated around females. Thereby, sexes of moose were aggregated during autumn, and we hypothesize that the extent of females best represents the spatial distribution of both sexes prior to the hunt (Miquelle et al. 1992). We also admit that sex-ratios within interior Alaska were likely to vary. We assume, however, that our estimation of moose density based on female moose was valid given the previously mentioned drawbacks of including males in estimates and our goal of quantifying overall population density of moose. Raw estimates of density were determined by totaling the number of adult females surveyed in sample units, adding 1, and dividing by the area (m2) within the sample unit. The addition of 1 was necessary because we used a natural-log transformation to normalize data (McKenney et al. 1998, Rew et al. 2001, Ver Hoef 2001) and stabilized variance. 1.35 Kriging We used ArcGIS 8.3 Geostatistical Analysis Program (Johnston et al. 2001) to krig estimates of moose densities across interior Alaska. Our sample units for hunter characteristics were UCUs, which was larger than moose survey sample units. To aggregate to the UCU scale, we kriged all unsampled moose survey units and then averaged them for each UCU. Kriging has also been used to estimate other populations
13 of moose (McKenney et al. 1998). The geographic area kriged was formed by all the UCUs that contained moose-survey sample units along with their adjacent UCUs (i.e., those sharing a border with an UCU that contained at least 1 sample unit). We estimated moose densities using ordinary kriging with an exponential variogram model. Because of the abundance of sample units, we used the 20 nearest neighbors of a unit to make predictions that formed a raster-based map. We overlaid predicted values of the raster map on UCUs and then averaged them within each UCU. Values then represented average moose density over our 5-year study in interior Alaska; annual surveys by ADF&G indicated that moose density was relatively stable during our study. 1.36 Human Indices We examined hunter density as an index to the presence of hunters and their potential interactions with moose. We calculated the number of hunters in a UCU by totaling the number of attempted hunts, regardless of success, for each year. We divided this value by area (km2) to calculate yearly density of hunters in a particular UCU. We examined the influence of the ratio of hunter-to-moose density when predicting success (Cooper et al. 2003). We based predictions of moose density on a 5-year mean, so we used an equivalent 5-year average of hunter density for determining that ratio. We also explored the influence of residency of hunters on success. We assigned hunters to three categories related to residency: urban, rural, and nonresident (based on postal zip codes). Urban or rural communities were defined as areas with a population of 2,500 to 7,000 residents and considered dependency on the community, utilization of surrounding ecosystem services, and development in the local area according to the joint agreement
14 between the Subsistence Management for Federal Public Lands in Alaska, the U.S. Department of the Interior, and the U.S. Forest Service (for additional information see ADF&G 2000 subsistence technical document at http://www.state.ak.us/adfg/subsist/download/ tecdoc00.pdf.) 1.37 Statistical Analyses We truncated the number of days hunted at 30 because of extreme outliers in our data, but 99% of our samples were retained. We also examined a Spearman rank correlation matrix to remove potentially correlated variables (Zar 1999). Hunter success is a binary response; consequently, we used stepwise logistic regression with PROC LOGISTIC and GENMOD (α =0.15 to enter, α = 0.10 to remove) to select significant variables for predicting success (SAS Institute 1999). During stepwise logistic regression, we based model selection on Akaike Information Criterion (AIC; Zar 1999). We determined goodness-of-fit with the Pearson Chi-Square value divided by the degrees of freedom, for which a value near 1 indicated a good fit (Zar 1999). Of 21 GMUs available to enter the model, we excluded three because of incomplete data (19A, 19B, and 21E). We used the same variables from logistic regression for modeling success and effort with Weibull regression. We assumed a Weibull distribution for CPUE. Weibull regression incorporated censored data and covariates such as landscape and hunter characteristics to estimate both time to achieve a particular rate of success and the proportion of hunters likely to succeed within an area given a specified length of hunting trip. We modeled time to success with PROC LIFEREG (SAS Institute 1999) as the
15 probability density function. The probability of success is a function of time and is the cumulative distribution function (CDF). We treated unsuccessful hunts as censored values at the time the hunt ended. Survival models based on a Weibull distribution are 1-CDF. Parametric modeling such as Weibull regression can better handle covariates, potential interactions, and provides an approach superior to nonparametric models (i.e., Kaplan-Meier) when parametric assumptions are met (Dupont 1983, Efron 1988). Keech et al. (2000) used this parametric approach to model survivorship of moose, which also has applicability to modeling CPUE. Catch per unit effort was modeled as: Probability of success = 1 − S (t ) = 1 − exp( −(te − β′x )1 / σ ) , where t is time, the values of the covariates are contained in the vector x, the regression coefficients are contained in the vector β, and σ is a shape parameter (Allison 1995). For model diagnostics, we examined the relationship between residuals and a negative log-survivorship distribution (Allison 1995), with a linear relationship indicating a good fit. We fit all models with PROC LIFEREG (SAS Institute 1999). We used the estimated regression coefficients to examine relative effects of independent variables related to hunters and amount of time expended to kill a moose. To examine spatial patterns, we needed to hold nonspatial effects constant; thus, we created the typical hunter. For continuous hunter variables, we used the mean, and for categorical variables, we used the most frequent category. By fixing typical characteristics of a hunter and nonspatial coefficients, we analyzed effects of site-specific landscape characteristics (UCUs) on success. We also used the Weibull regression to evaluate hunter success based on use of guides to illustrate its flexibility. In addition, we used the standard approach to
16 model CPUE and success with linear regression (PROC REG, SAS Institute 1999), with success averaged for each day hunted. 1.4 RESULTS 1.41 Characteristics of Hunts and Success of Hunters Characteristics of moose hunters, their hunts, and subsequent success were affected by type of hunt, residency, whether they hunted on state or federal lands, their mode of transportation, whether they hired a guide, and the year during which they hunted (Table 1). Success was most variable among GMUs (range = 2-43%), and among modes of transportation used for hunting moose (Table 1). Use of GMUs differed with residency; 19B, 20B, and 20D were used most often by nonresidents, urban residents, and rural residents, respectively. Harvest levels remained relatively constant with a high in 1998 of 3,889 moose to a low of 3,204 moose in 2001 with 18,177 moose harvested during our 5-year study. Surprisingly, median length of hunt did not differ greatly for successful (5 days) and unsuccessful (6 days) hunters; overall the median length of a hunt was 6 days. Median days hunted was shortest for residents with urban hunters spending 5 days and rural hunters 6 days; nonresidents hunted for a median of 7 days. 1.42 Models for Catch per Unit Effort We modeled hunter success using logistic regression with successful hunts coded 1 and unsuccessful hunts coded 0. Pearson Chi-Square divided by the degrees of freedom, was near 1 (n = 23,956, Concordance = 69.5, χ2/DF = 1.01), indicating a good fit. Remarkably, length of hunt entered the regression model with a negative coefficient (Table 2), demonstrating lower success associated with more effort. This outcome is an
17 artifact of the successful harvest of a moose ending the hunt, and it illustrates the danger of calculating CPUE in this way. Indeed, when success was regressed with days hunted, we observed a slightly negative, but not significant, trend (Fig. 2A, P = 0.45). Lack of a clear relationship between effort and success further illustrates the inability to accurately depict the relationship between success and effort with this traditional approach. When we modeled hunter success with Weibull regression, a plot of residuals resulted in a linear relationship, indicating a Weibull distribution fit the data well. Weibull regression illustrated increased success with increased time to harvest, with a curvilinear and a positive relation between success and effort (Fig. 2B). The five most influential variables for predicting hunter success from stepwise logistic regression were GMU, type of transportation, length of trip, type of hunt, and whether a guide was used (Table 2). Coefficient estimates computed by logistic regression also indicated increased success with increased density of moose and distance from roads. Moreover, a negative coefficient for days hunted indicated success decreased with additional days hunted. In 1997, rural residency, transportation via snowmobile, and use of a guide and transporter resulted in the highest predicted success (Table 2). The five most influential variables for Weibull regression included type of hunt, mode of transportation, GMU, year, and the hunter-to-moose ratio (Table 2). Length of hunt was the response variable. Positive values for coefficients of the logistic model indicated increased success; whereas, negative values for coefficients of the Weibull regression indicated shortened time to kill a moose (Table 2). Weibull regression indicated reduced time to achieve success with increased moose density, distance to road,
18 and river density (Table 2). Attributes that decreased time to success included hunting in 1997, urban residency, use of a snowmobile, use of guide, and transporter usage (Table 2). Coefficients for GMUs in both models varied widely and reflected a strong spatial component to hunter success in interior Alaska. Major differences between the two regressions (i.e., logistic and Weibull) were for residency and success among years. Urban residents had the shortest time to achieve a successful hunt in the Weibull regression; whereas, for logistic regression, rural hunters were most successful. Variables that did not enter the step-wise model consisted of whether a hunt was managed by Federal or State agencies, amount of spruce or deciduous vegetation, slope, aspect, and ruggedness of terrain. We used Weibull regression coefficients (Table 2) to create a map of standardized hunter success (Fig. 1A and B) by selecting characteristics of a typical hunter and variation from significant spatial components (i.e., GMU, hunter/moose ratio, moose density, distance to road, presence of low shrub vegetation, river density). Landscape and spatial dynamics strongly influenced predicted success for a 6-day hunt in interior Alaska by a typical moose hunter in 2001 (Fig. 1A and B). A typical moose hunter was an urban resident who used a boat, participated in a general hunt, and contracted no guide or transporter services (Table 1). Hunter success varied markedly within interior Alaska. Success was high near the rural communities of Huslia and Galena, approximately 50 km south of McGrath, and a 100 km east and northeast of Circle (Fig. 1A and B). Moderate levels of hunter success occurred south of Fairbanks, southwest from Wiseman toward Huslia, and southwest
19 from Tanana to McGrath. The poorest hunting success was in the area between Circle and 100 km east of Wiseman (Fig. 1A and B). Although densities of moose south of Fairbanks in GMU 20A were among the highest in the state ( X = 0.43 moose/km2, SE = 0.08), hunting success was only moderate when compared to other areas of the State such as Huslia which experienced higher rates of success (Fig. 1A and B). This area also possessed the second highest hunter-to-moose ratios in the State ( X = 0.16, SE = 0.03); only the bordering GMU 20B had higher ratios ( X = 0.37, SE = 0.07). The increase in success near the southern boundary of 20A and below McGrath in 19B corresponded with increased guiding activity. For example, the percent of hunts guided was 748 of 8,074 vs. 1,391 of 31,479 hunts guided for the rest of interior Alaska (n = 32,227). in these two GMUs. The area around Huslia also was also more frequently used by guides compared to other places in interior Alaska. Clearly, a guided hunt was more successful than unguided hunt (Fig. 3). 1.5 DISCUSSION We hypothesize that increased effort (i.e., days spent hunting) for moose in interior Alaska was associated with lack of success, rather than the standard interpretation of effort associated with increasing success. The negative trend between days hunted and CPUE (Fig. 2A) is counter-intuitive. More important is the lack of a significant relationship between effort and success that we assume resulted from a single kill ending the hunt, which occurs frequently for harvests of large mammals. Length of a hunt was a key component of success, and it was used to quantify effort and as an index of hunt quality and status of wildlife populations (Eberhardt 1976, Novak et al. 1991, Laake
20 1992, Lancia et al. 1996, Bowyer et al. 1999, Van Deelen and Etter 2003). Clearly, a new approach is needed to model CPUE for moose hunting. Logistic regression models also may not accurately represent the relationship between effort and success (Table 2). Days hunted was estimated with a negative coefficient, again indicating an unrealistic reduction in success associated with longer hunts. Because days hunted is a covariate in the logistic regression model, the negative coefficient for days hunted also influences all other covariates in the model. This outcome can confound the interpretation of other parameters in the model, including those indicated as important in predicting hunting success. Nonetheless, amount of effort expended is an important component of hunting (Table 2). Models should reflect this key variable. We therefore chose Weibull regression to evaluate the relationship between effort and success for moose hunters within interior Alaska, and we observed a strong relationship between hunter effort and time to success (Fig. 2B). We modeled CPUE using a Weibull distribution that has been commonly used to predict rates of failure over time (Keech et al. 2000) or, in a few instances, catch-effort models (Dupont 1983, Novak et al. 1991). Nonetheless, to our knowledge a Weibull regression approach has never been taken to evaluate hunter success for large mammals. Weibull modeling of CPUE better reflected effort by placing length of a hunt as an outcome rather than a predictor in the model. Consequently, Weibull regression addressed and effectively removed the inherent bias resulting from confounding effects when we included length of hunt as a predictor (Fig. 2A and B). This approach depicted
21 a more realistic relationship between CPUE and success, with increases in effort that lead to improved rates of success (Fig. 2B). Weibull regression further allowed for two examinations of success. First, success can be predicted based on characteristics of hunters and a specified length of time in the field. For example, choosing length of hunt on the x-axis yields a prediction of success on the y-axis (Fig. 2B). Conversely, because CDFs are monotonic functions, length of time required to achieve a desired rate of success or harvest level can be predicted. For example, choosing a success rate on the y-axis yields a predicted length on the x-axis (Fig. 2B). Success based on residency provides an example of different performance by logistic and Weibull models towards predicting success, with rural hunters being most successful in the logistic model and urban hunters more successful in the Weibull model (Table 2). We conjecture this outcome occurred for urban hunters because of the necessary preparation and expense to travel outside of the town or employment constraints. Also rural hunters could have multiple attempts to hunt, thereby reducing the time and effort to structure a hunt. Consistent with our first prediction, rates of success were associated with modes of transportation and were extremely variable (Table 1). Transportation modes that allow access to more remote areas (i.e., boats, airplanes, and snowmachines) offer greater rates of success compared with travel via roads (Table 1and 2). The model already has corrected for hunter-to-moose ratio, so this effect could be explained by more inexperienced moose in less-accessible areas. Our prediction that motivations and characteristics of hunters would influence hunting success was supported by the variability of success rates associated with different
22 attributes of hunters (Table 1). Results indicate that increased effort improved success (Fig. 3). When modeling success and CPUE, Weibull regression exemplified the importance of hunter motivation and effort, with use of a guide or transporter strongly influencing hunting success (Table 2, Fig. 3). Covariate influences in Weibull regression indicated decreased time to success for hunters using guides and provided a quantifiable measure of the increase in effort necessary to influence success. Game Management Unit was the most important component in predicting success (based on χ2 values). Why GMU is so important is unclear and may reflect unmeasured local spatial effects. We speculate that variability of sex-ratios among GMUs could explain some of the spatial variation. Year was also important in predicting success (Table 2). Even with use of 5-year means for some parameters, year still clearly had a significant effect on success. Such year effects may be related to fluctuations in weather, access, or regulations. In addition, this outcome implies that success is not solely driven by hunter attributes (Stankey et al. 1973). In our data, numbers of reporting hunters steadily increased (Table 1); if the number of harvested animals was constant, then rates of success decreased. Consistent with our last prediction, density of moose significantly affected success, with increased densities improving rates of success (Table 2). Our results support Van Deelen and Etter (2003), who illustrated a linear response between deer density and effort, with hunter effort increasing as density of deer decreased. Nonetheless, they questioned whether increased effort resulted in increased success because of small sample sizes and the perception gap by hunters between actual and
23 perceived density of deer, with hunters increasingly overestimating effort (i.e., underestimated densities of deer) as deer density decreased (Van Deelen and Etter 2003). Our results are similar, although an increase in density of moose was not the best predictor of success. Hunter-to-moose ratio was much more predictive than moose density alone (Table 2). For example, moose were at high density south of Fairbanks but did not yield increased rates of success. This area has high densities of moose, but it also has easy access and close proximity to a substantial human population; consequently, this area attracted many moose hunters. Interference among hunters may decrease rates of success regardless of high moose densities. Other studies also report increases in density of roads and hunter interference associated with decreased rates of success (Cooper et al. 2002, Heberlein and Kuentzel 2002). Several authors have undertaken research incorporating hunter characteristics, motivation, and effort into management schemes (Miller et al. 1994, Albert et al. 2001, Hayslette et al. 2001, Miller and Graefe 2001, Heberlein and Kuentzel 2002); however, more research in this area is needed (Ericsson et al. 2000, Bulte and Horan 2002, Fulton and Hundertmark 2004). Moreover, Ericsson et al. (2000) stated that a better understanding of hunter characteristics could produce hunting regulations that are both economically and biologically sustainable. 1.6 MANAGEMENT IMPLICATIONS Our regression approach to modeling hunter success with a Weibull distribution allows for more realistic and informative predictions that wildlife managers can use to better estimate harvest levels and structure of hunts. Catch per unit effort is used widely in wildlife management, including detecting changes in population size of moose (Mercer
24 and Manuel 1974; Crête et al. 1981; Crête and Dussault 1987; Hatter 1998, 2001). Because days hunted is more a result of success, rather than a reliable predictor of success, wildlife managers should use caution when estimating effort levels or population size based on days hunted. Weibull estimates for CPUE provide a flexible approach to model success and harvest levels either by predicting the number of days hunted necessary to achieve a desired rate of harvest or by allowing predictions about rates of success for a particular length of trip. Predicting time needed to harvest at a particular rate provides a promising approach for managers when setting hunting seasons. Use of coefficients and covariates from Weibull regression also provides managers with a spatially explicit model that will help establish local regulations and improve site-specific conservation efforts. In addition, we suggest that to understand harvest patterns and effectively manage wildlife, information on combined effects of hunter characteristics, effort, and success are necessary. Weibull regression combines these variables into a unified statistical analysis. 1.7 ACKNOWLEDGMENTS We thank the ADF&G for use of their hunter-harvest database and moose-survey estimates. The Spatial Ecology Laboratory of A. D. McGuire at the University of Alaska Fairbanks (UAF) provided landscape data. We also thank H. A. Maier for his help with GIS analysis and K. M. Stewart for statistical advice. We obtained maps at the Alaska State Geospatial Data Clearinghouse website (http://agdc.usgs.gov/). Maps representing the UCUs and GMUs were provided by ADF&G, Division of Wildlife Conservation. Maps representing rivers and roads were produced by the Land Records Information
25 Section of Alaska Department of Natural Resources. Residency was assessed through the Alaska Community Database maintained by the Department of Community and Development and is available at: http://www.state.ak.us/adfg/subsist/geninfo /publctns /cpdb.htm. This research was funded, in part, by the Interdisciplinary Graduate Education and Research Training Program (IGERT) of the National Science Foundation, ADF&G, the Institute of Arctic Biology at UAF, and the Department of Biological Sciences at Idaho State University. 1.8 REFERENCES Albert, D. M., R. T. Bowyer, and S. D. Miller. 2001. Effort and success of brown bear hunters in Alaska. Wildlife Society Bulletin 29:501-508. Allison, P. D. 1995. Survival analysis using the SAS system: a practical guide. SAS Institute, Cary, North Carolina, USA. Ballard, W. B., J. S. Whitman, and D. J. Reed. 1991. Population dynamics of moose in southcentral Alaska. Wildlife Monographs 114 Pages 49. Bowyer, R. T., M. C. Nicholson, E. M. Molvar, and J. B. Faro. 1999. Moose on Kalgin Island: are density-dependent processes related to harvest? Alces 35:73-89. Bulte, E. H., and R. D. Horan. 2002. Does human growth increase wildlife harvesting? An economic assessment. Journal of Wildlife Management 66:574-580. Cooper, A. B., R. Hilborn, and J. W. Unsworth. 2003. An approach for population assessment in the absence of abundance indices. Ecological Applications 13:814-828.
26 ____, J. C Pinheiro, J. W. Unsworth, and R. Hilborn. 2002. Predicting hunter success rates from elk and hunter abundance, season structure, and habitat. Wildlife Society Bulletin 30:1068-1077. Crête, M., and C. Dussault. 1987. Using hunting statistics to estimate density, cow-calf ratio and harvest rate of moose in Quebec. Alces 23:227-242. ____, R. J. Taylor, and P. A. Jordan. 1981. Optimization of moose harvest in southwestern Quebec. Journal of Wildlife Management 45:598-611. Crichton, V. 1993. Hunter effort and observations—the potential for monitoring trends of moose populations: a review. Alces 29:181-186. Dupont, W.D. 1983. A stochastic catch-effort model for estimating animal abundance. Biometrics 39:1021-1033. Eberhardt, L. L. 1976. Quantitative ecology and impact assessment. Journal of Environmental Management 4:27-70. Efron, B. 1988. Logistic regression, survival analysis, and the Kaplan-Meier curve. Journal of the American Statistical Association 83:414-425. Ericsson, G., M. Bowman, and L. Mattsson. 2000. Selective verses random moose harvesting: does it pay to be a prudent predator? Journal of Bioeconomics 2:117-132. Frey, S. N., M. R. Conover, J. S. Borgo, and T. A. Messmer. 2003. Factors influencing pheasant hunter harvest and satisfaction. Human Dimensions of Wildlife 8:277-286.
27 Fulton, D. C., and K. J. Hundertmark. 2004. Assessing the effects of a selective harvest system on moose hunters’ behaviors, beliefs, and satisfaction. Human Dimensions of Wildlife 9:1-16. Getz, W. M., and R. G. Haight. 1989. Population harvesting. Demographic models of fish, forest, and animal resources. Princeton University Press, Princeton, USA. Goodyear, C. P. 2003. Tests of the robustness of habitat-standardized abundance indices using simulated blue marlin catch-effort data. Marine and Freshwater Research 54:369-381. Gould, W. R., and K. H. Pollock. 1997. Catch-effort maximum likelihood estimation of important population parameters. Canadian Journal of Fish and Aquatic Sciences 54:890-897. Hatter, I. W. 1998. A Bayesian approach to moose population assessment and harvest decisions. Alces 34:47-58. ____. 2001. An assessment of catch per unit effort to estimate rate of change in deer and moose populations. Alces 37:71-77. Hayslette, S. E., J. B. Armstrong, and R. E. Mirarchi. 2001. Mourning dove hunting in Alabama: motivations, satisfactions, and sociocultural influences. Human Dimensions of Wildlife 65:81-95. Heberlein, T. A., and W. F. Kuentzel. 2002. Too many hunters or not enough deer? Human and biological determinants of hunter satisfaction and quality. Human Dimensions of Wildlife 7:229-250.
28 Keech, M. A., R. T. Bowyer, J. M. Ver Hoef, R. D. Boertje, B. W. Dale, and T. R. Stephenson. 2000. Life-history consequences of maternal condition in Alaskan moose. Journal of Wildlife Management 64:450-462. Laake, J. L. 1992. Catch-per-unit-effort models: an application for an elk population in Colorado. Pages. 16-30 in D. R. McCollough and R. H. Barretts, editors. Wildlife 2001: populations. Elsevier Science, London. Lancia, R. A., J. W. Bishir, M. C. Conner, C. S. Rosenberry. 1996. Use of catch-effort to estimate population size. Wildlife Society Bulletin 24:731-737. ____, K. H. Pollock, J. W. Bishir, and M. C. Conner. 1988. A white-tailed deer harvesting strategy. Journal of Wildlife Management 52:589-595. Lauber, T. B., and B. A. Knuth. 1997. Fairness in moose management decision-making: the citizens' perspective. Wildlife Society Bulletin 25:776-787. ____, and ____. 1999. Measuring fairness in citizen participation: a case study of moose management. Society and Natural Resources 12:19-37. Maunder, M. N. 2001. A general framework for integrating the standardization of catch per unit of effort into stock assessment models. Canadian Journal of Fisheries and Aquatic 58:795-803. ____, and P. J. Starr. 2003. Fitting fisheries models to standardized CPUE abundance indices. Fisheries Research 63:43-50. McCullough, D. R., and W. J. Carmen. 1982. Management goals for deer hunter satisfaction. Wildlife Society Bulletin 10:49-52.
29 McKenney, D. W., R. S. Rempel, L. A. Venier, Y. Wang, and A. R. Bisset. 1998. Development and application of a spatially explicit moose population model. Canadian Journal of Zoology 76:1922-1931. Mercer, W. E., and F. Manuel. 1974. Some aspects of moose management in Newfoundland. Naturaliste Canadien 101:657-671. Miller, C. A., and A. R. Graefe. 2001. Effect of harvest success on hunter attitudes towards white-tailed deer management in Pennsylvania. Human Dimensions of Wildlife 6:189-203. Miller, S. D., R. Sinnott, and D. W. McCollum. 1994. Differentiating among wildlife-related attitudinal groups in Alaska. Transactions of the North American Wildlife and Natural Resources Conference 59:512-523. Miquelle, D. G., J. M. Peek, and V. Van Ballenberghe. 1992. Sexual segregation in Alaskan moose. Wildlife Monographs 122. Nicholson, M. C., R. T. Bowyer, and J. G. Kie. 1997. Habitat selection and survival of mule deer: tradeoffs associated with migration. Journal of Mammalogy 78:483-504. Novak, J. M., K. T. Scribner, W. D. DuPont, and M. H. Smith. 1991. Catch-effort estimation of population size. Journal of Wildlife Management 55:31-38. Rew, L. J., B. Whelan, and A. B. McBratney. 2001. Does kriging predict weed distributions accurately enough for site-specific weed control? Weed Research 41:245-263.
30 Richards, L. J., and J. T. Schnute. 1992. Statistical-models for estimating CPUE from catch and effort data. Canadian Journal of Fisheries and Aquatic Sciences. 49:1315-1327. Rollins, R., and L. Romano. 1989. Hunter satisfaction with the selective harvest system for moose management in Ontario. Wildlife Society Bulletin 17:470-475. SAS Institute. 1999. SAS/STAT guide for personal computers. Version 8. SAS Institute, Cary, North Carolina, USA. Schwartz, C. C., K. J. Hundertmark, and T. H. Spraker. 1992. An evaluation of selective bull harvest on the Kenai Peninsula, Alaska. Alces 28:1-13. Sigler M. F., and C. R. Lunsford. 2001. Effects of individual quotas on catching efficiency and spawning potential in the Alaska sablefish fishery. Canadian Journal of Fisheries and Aquatic Sciences 58:1300-1312. Seber, G. 1992. A Review of Estimating Animal Abundance II. International Statistical Review 60:129-166. Smith M., K. J. Budd, and C. Gross. 2003. The distribution of Blanford's fox (Vulpes
cana Blanford, 1877) in the United Arab Emirates. Journal of Arid Environments 54:55-60. Solberg, E. J., A. Loison, B. E. Sæther, and O. Strand. 2000. Age-specific harvest mortality in a Norwegian moose Alces alces population. Wildlife Biology 6:41-52.
31 Stankey, G. H., R. C. Lucas, and R. R. Ream. 1973. Relationship between hunting success and satisfaction. Transactions of the North American Wildlife and Natural Resource Conference 38:235–245. Van Deelen, T. R., and D. R. Etter. 2003. Effort and the functional response of deer hunters. Human Dimensions of Wildlife 8:97-108. Ver Hoef, J. M. 2001. Predicting finite populations from spatially correlated data. Pages 93-98 in 2000 Proceedings of the Section on Statistics and the Environment of the American Statistical Association. Indianapolis, Indiana, USA. _____. 2002. Sampling and geostatistics for spatial data. Écoscience 9:152-161. Weixelman, D. A., R. T. Bowyer, and V. Van Ballenberghe. 1998. Diet selection by Alaskan moose during winter: effects of fire and forest succession. Alces 34:213-238. Worthington D. G., N. L. Andrew, and N. Bentley. 1998. Improved indices of catch rate in the fishery for blacklip abalone, Haliotis rubra, in New South Wales, Australia. Fisheries Research 36:87-97. Yarie, J., and S. Billings. 2002. Carbon balance of the taiga forest within Alaska: present and future. Canandian Journal of Forest Research 32:757-767. Zar, J. H. 1999. Biostatistical analysis. Second edition. Prentice Hall, Englewood Cliffs, New Jersey, USA.
32
Figure 1.1 Predicted moose hunt success for a 6-day hunt in 2001 by an urban, Alaskan resident with a boat, using no commercial services in interior Alaska, USA, based on hunter-harvest tickets from 1997 to 2001.
33
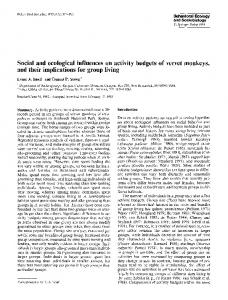
0.45
Mean Success (kill/hunt)
0.40 0.35 0.30 0.25 0.20 y = -0.0014x + 0.3601 r s = -0.0147 n = 29 P = 0.45
0.15 0.10 0.05 0.00 1
3
5
7
9
11
13
15
17
19
21
23
25
27
29
Days Hunted
Figure1.2A Linear regression model of catch per unit effort (CPUE) for moose hunters in interior Alaska, USA, based on hunter-harvest tickets from 1997 to 2001.
34
Proportion of Hunters Likely to Succeed
1.00 0.90 0.80 0.70 0.60 0.50
mean
0.40
95% CI
0.30 0.20
n = 23,956 P