an exercise of ecological inference and disaggregate these margins to recover individual data. Keywords: entropy econometrics, ecological inference; Mexico.
Ecological inference with Entropy Econometrics: using the Mexican Census as a benchmark Esteban Fernandez-Vazquez University of Oviedo, Spain Rafael Garduño-Rivera University of Illinois at Urbana-Champaign, U.S. Abstract: Most regional empirical analyses are limited by the lack of data. Researchers have to use information that is structured in administrative or political regions which are not always economically meaningful. The nonavailability of geographically disaggregated information prevents to obtain empirical evidence in order to answer some relevant questions in the field of urban and regional economics. The objective of this paper is to suggest an estimation procedure, based on entropy econometrics, which allows for inferring disaggregated information from more aggregated data. In addition to a description of the main characteristics of the proposed technique, the paper illustrates how the procedure works taking as an empirical application the estimation of income for different classes of Mexican municipalities. It would be desirable to apply the suggested technique to a study case where some observable data are available and confront the estimates with the actual observations. For this purpose, we have taken the information contained in the Mexican census as a benchmark for our estimation technique. Assuming that the only available data are the income aggregates per type of municipality and State, we make an exercise of ecological inference and disaggregate these margins to recover individual data.
Keywords: entropy econometrics, ecological inference; Mexico.
1
1. Introduction. One relatively frequent limitation for empirical economics is the lack of data available at an appropriate spatial scale. Although the target, in principle, would be to work at a smaller geographical scale, the non-availability of geographically disaggregated information usually limits the conclusions of the analysis at an aggregate level. To overcome this problem, a process of Ecological Inference (EI) is required in order to recover the information at the required spatial scale.
Generally speaking, EI is the process of estimating disaggregated information from data reported at aggregate level. Research in this area has grown enormously in recent years, given its usefulness in many academic disciplines of social science as well as in policy analysis. The foundations of EI were introduced in the seminal works by Duncan and Davis (1953) and Goodman (1953), whose techniques were the most prominent in the field for more than forty years, although the work of King (1997) supposed a substantial development by proposing a methodology that reconciled and extended previously adopted approaches. An extensive survey of recent contributions to the field can be found in King, Rosen and Tanner (2004).
The objective of this paper is to explore the potential of an estimation procedure based on entropy econometrics to recover disaggregated information from more aggregated data. The paper is divided into four further sections. Section 2 provides a picture of the availability of information in Mexico at small scale (municipalities). Section 3 presents the entropy econometrics solution to the estimation problem. In section 4, the performance of the technique is evaluated by applying to a real-world problem where the disaggregated data are observable. Specifically we take the Mexican 2009 Censos Económicos as a benchmark. This database is 2
published every five years and contains information about gross value added, wages and salaries and labor by industry disaggregated at the level of municipalities. The data contained in this census will be confronted with estimates obtained assuming
that only aggregated information is
observable. The main conclusions and possible further lines of research complete the paper.
2. Ecological Inference as a matrix balancing problem The problem of estimating spatially disaggregated data can be described in the same terms as on the matrix-balancing problem depicted in Golan (2006, page 105), where the goal is to fill the (unknown) cells of a matrix using the information that is contained in the aggregate data of the row and column sums.
Graphically, the point of departure of our problem is a matrix where the cells
are the unknown elements we would like to estimate and we define
the following sums ∑
=
·,
∑
=
·
, and ∑
∑
= . The
elements can be expressed as a bi-dimensional probability distribution simply dividing the quantities of the matrix by the sum ∑
∑
= . In
such a case, the previous matrix can be rewritten in terms of a new matrix where the
′ are defined as the proportions
margins defined as
=
·
and
=
followings equalities are fulfilled by the
=
·;
·
respectively. Consequently, the elements:
∀ = 1, …,
3
, with new row and column
(1)
=
·
(2)
; ∀ = 1, …,
These two sets of equations reflect all we know about the elements of matrix . Equation (1) shows the cross-relationship between the (unknown) ′
in the matrix and the (known) sums of each row and column.
Additionally, equation (2) indicates that the
′ can be viewed as (column)
probability distributions. In such a situation, the Cross Entropy (CE) principle can be applied to recover the unknown available a prior distribution the target matrix probability matrix vectors
probabilities if we have
that reflects our initial assumptions about
. In other words, we want to transform an a priori into a posterior matrix
that is consistent with the
and .
The solution to this type of problems is obtained by minimizing a divergence measure with the prior probability matrix
subject to the set of constraints
(1) and (2), which can be written in the following terms:
( ‖ )=
(3)
The divergence measure ( ‖ ) is the Kullback-Liebler entropy divergence
between the posterior and prior distributions. The entropy-based estimation techniques outlined above can be directly applied to the field of Ecological Inference (EI). Judge et al. (2004) suggested the use of information-based estimation techniques for EI problems, although in a different context (the estimation of individual voters’ behavior from aggregate election data). In this paper we suggest an application of CE following the line of Judge et al. (2004) and posing the EI as a particular case of the more general matrix balancing problem. 4
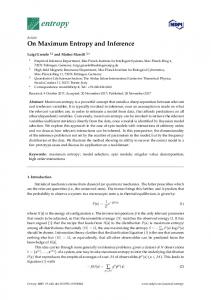
Consider a geographical area that can be divided in T smaller spatial units (regions). Besides this first geographical partition, suppose that there is another dimension on which we would like to observe some variable. Consider that this second dimension is the classification into K different industries on which the economic activity can be divided. The objective of the estimation exercise would be to recover the values of the variable disaggregated by regions and industries from aggregate information at the industrial and regional scale. Graphically, this estimation problem can be represented by Figure 1.
Figure 1: The matrix balancing problem. …
11
…
…
…
Each one of the
… …
1
… …
·
1·
…
·
…
… …
1
…
…
1
·1
…
1
…
· ·
elements is defined as the proportion of the variable
allocated in region i and industry j, forming a ( × ) matrix values. The ( × 1) row vector
of unknown
and the (1 × ) column vector
contain
respectively the regional and sectoral shares of the variable across the country. If an a priori probability distribution
is also available, the Cross
Entropy procedure outlined previously can be directly applied.
5
3. The case of Mexico: available data for economic analysis at small-scale Availability of economic data at small-scale varies very much depending on the country studied. In the specific case of Mexico both aggregated (at state level) and disaggregated (at municipal level) economic information is available in several surveys published by the Mexican Statistical Agency INEGI. If the researcher is interested in information observable at a municipal level, but not classified into industries, the most appropriate source of information is the Sistema Estatal y Municipal de Bases de Datos (SIMBAD). This database puts together information from several different surveys elaborated by INEGI and provides information of prices, GDP, unemployment, etc. on a yearly basis for every municipality in the country. This information, however, does not allow for an industry classification and if we are interested in analysing the figures for some specific industry, the SIMBAD system only provides information at the State level (on a yearly basis as well).
If the research we want to conduct implies the observation of data at a municipal level and also classified by industry, the reference is the Censo
Economico. The National Economic Census in Mexico is the main source of economic data for the National System of Statistical and Geographical Information, and gives the basis for the development of many other economic measures. The information contained in the economic census refers to every economic unit in the country and it provides data for every level of geographic disaggregation, for each one of the more than 950 NAICS activities. Given the enormous amount of resources required to elaborate it, INEGI publishes one economic census every five years, corresponding the most recent one to 2009.
6
4. Estimates versus “real data”: municipal GVA in the state of Aguascalientes As commented in the previous section, state and industry aggregates are much easier to observe than the disaggregated data by industry and municipality contained in the Census. In this context, it would be interesting the application of an estimation procedure that produce disaggregated values quicker than the official ones. For practical purposes, we have focused on one specific Mexican state, Aguascalientes, although our analysis can be easily extended to other cases. This state is composed by eleven municipalities and we use a classification into five industries (we exclude agriculture). Table 1 presents the figures of gross value added by industry and municipality published in the Mexican Economic Census 2009 (the most recent one):
Table 1. Census data of gross value added by municipality and industry (thousands Mexican pesos) Energy
Manufact.
Commerce
Services to companies
Other services
Total ( )
3759828
19433189
5392094
4331919
1981483
34898513
Asientos
9180
3877
14126
18608
5014
50805
Calvillo
1935
199359
100619
11013
37053
349979
Cosío
3293
24473
7187
139
1506
36598
Aguascalientes
Jesús maría
17235
3519467
903192
177524
220660
4838078
Pabellón de arteaga
35516
185209
83707
18732
27129
350293
Rincón de romos
38647
653079
147031
10299
35608
884664
San José de Gracia
1713
11364
10085
456
3396
27014
Tepezalá El llano S. Francisco de los romos Total ( )
19821
208825
11244
87206
5902
332998
183
11494
15195
792
2718
30382
10784
2344789
154763
272580
17613
3898135
26595125
6839243
4929268
2338082
2800529
In our estimation problem we assume that not the individual cells, but only some aggregated information (the column and row totals in bold) is observable. More specifically, vector R with dimension (11 × 1), contains the municipal shares of gross value added across the state (row sums of Table 1). Moreover, vector
(1 × 5) is given by the proportion of gross value added
by industry at the state level (column sums of Table 1). From these aggregates, we will apply the entropy-based estimation strategy explained 7
in previous sections to recover the distribution of gross value added by municipality and industry.
From this point of departure, the following CE problem can be written as: ( ‖ )=
(9)
Subject to:
· ·
=
; ∀ = 1, … ,11
(10)
=
; ∀ = 1, …,5
(11)
Although several options are possible for the specification of an a priori distribution , we opted for taking as reference the values published in the previous Economic Census in 2004. This has the disadvantage that the estimates obtained for those cases (one specific industry in one municipality) where in 2004 there was no economic activity will be equal to zero. In other words, since the zeros in the
matrix are kept, this means that the CE
estimation cannot predict the “birth” of new industries in one municipality.1
The solution to this CE program is presented in Table 2. The figures have been obtained as the respective estimate of
multiplied by the total value
added for the state of Aguascalientes as a whole ( ).
1
This problem can be solved, on the other hand, by specifying a prior different form the example used in our empirical analysis. 8
Additional columns have been included, in order to have indicators of the accuracy of our estimates by municipality and industry. Specifically, we obtained the mean absolute error percentage -MAPE-, given that is frequently used in the studies that evaluate the performance of matrix adjustment techniques. The municipal ( (
), industry (
) and total
) error indicators are defined as:
=
=
100
=
100 100
∑ ∑ ∑
− ̂
(12a)
− ̂
(12b)
− ̂ ∑
where the ̂ elements denote the estimated gross values added.
9
(12c)
Table 2. CE estimates of gross value added by municipality and industry (thousands Mexican pesos) Energy
Manufact.
Commerce
Services to companies
Other services
Asientos
3454271 12681
19105700 5217
5638718 15772
4493164 14075
2206661 3059
3.63 25.54
Calvillo
155883
91397
65224
19401
18073
92.77
Cosío
20738
12931
2561
61
307
95.33
Jesús maría Pabellón de arteaga
15304
3983304
579815
212370
47284
20.61
54668 146151
111256 555790
162125 136687
7062 19163
15182 26873
55.70 26.31
----
19914
5045
158
1898
63.23
---976
321877 28142
8659 1205
1506 ----
956 54
67.90 114.83
37461
2359598
223431
162302
17736
7.87
16.88
4.65
11.56
8.66
19.27
Aguascalientes
Rincón de romos San José de Gracia Tepezalá El llano S. Francisco de los romos
7.99
From the figures in Table 2 we can see a huge variability in the accuracy of the CE estimates, but under the general rule that the largest cells produce comparatively smaller errors. At a industry dimension, the manufacturing activities (with a share in 2009 of approximately 60% over the gross value added of the state) is the branch with the smallest error. Oppositely, “Other services” with a GVA that weighted less than 6% in the 2009 state aggregate, was the industry with the largest error. At a geographical dimension, this same pattern is observed as well, even to a greater extent. The errors range from more than 100% for the municipality of “El llano” (a very small municipality) to less than 4% for the capital city of Aguascalientes., which concentrated more than 78% of the state GVA according to the 2009 Economic Census. There are other medium-size towns like “Jesús María” or “San Francisco de los Romos”, which weighted 11% and 6% respectively on the total GVA, where the errors are relatively low as well. Finally, is for the cases of small municipalities (with a weight of less than 2% over the total GVA according to the 2009 Economic Census) where the error figures increase dramatically. All in all, 10
the average absolute error is around 8%, which seems a quite good indicator of the estimates obtained.
5. Conclusions and future research. This paper applies a methodology based on Entropy Econometrics to estimate data at a municipal scale and classified into industries. The methodology proposed is evaluated with observable data from the Mexican Economic Census. This is an especially useful case because official data are available in a level of disaggregation not usual in other countries. Specifically, our objective was to estimate, by means of the CE procedure, municipal GVA data by industry published by INEGI in the Economic Census of 2009 for the state of Aguascalientes. In spite of some cases where the errors are exceptionally large, the general performance of the method seems to yield quite moderate errors suggesting that the CE approach can be taken as reasonably reliable.
References. Duncan, O. D. and Davis B., 1953. An Alternative to Ecological Correlation, American Sociological Review, 18, pp. 665–666. Golan, A., 2006. Information and Entropy Econometrics. A review and synthesis, Foundations and Trends in Econometrics, 2, pp. 1-145. Golan, A., Judge, G. and Miller, D., 1996. Maximum Entropy Econometrics: Robust Estimation with Limited Data, New York, John Wiley & Sons. Goodman, L., 1953. Ecological Regressions and the Behavior of Individuals, American Sociological Review, 18, pp. 663–666. Judge, G., Miller, D. J. and Cho W. T. K., 2004. An Information Theoretic Approach to Ecological Estimation and Inference, in King, G., Rosen, O. and M. A. Tanner (Eds. Ecological Inference: New Methodological Strategies, Cambridge University Press, pp. 162-187).
11
Kapur, J. N. and Kesavan H. K., 1992. Entropy Optimization Principles with Applications. Academic Press. New York. King, G., Rosen, O. and Tanner M. A., 2004. Ecological Inference: New Methodological Strategies, Cambridge University Press. Cambridge, UK. King, G., 1997. A solution to the Ecological Inference Problem: Reconstructing individual behavior from aggregate data. Princeton, Princeton University Press. Peeters, L. and Chasco, C., 2006. Ecological inference and spatial heterogeneity: an entropy-based distributionally weighted regression approach, Papers in Regional Science, 85(2), pp. 257-276, 06. Robinson W.S. (1950) Ecological correlations and the behavior of individuals. American Sociological Review,15, pp. 351–357
12