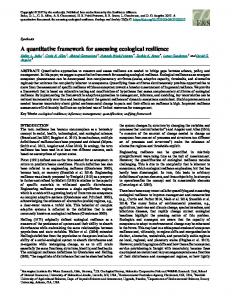
ECOSIMNET: A FRAMEWORK FOR ECOLOGICAL SIMULATIONS António Pereira, Luís Paulo Reis NIAD&R–LIACC / DEI-FEUP Faculty of Engineering of the University of Porto Rua Dr. Roberto Frias, s/n 4200-465 Porto, Portugal E-mails: {amcp, lpreis}@fe.up.pt
KEYWORDS Ecological Simulations, Intelligent Agents.
Optimization
Algorithms,
ABSTRACT Simulating ecological models is always a difficult task, not only because of its complexity but also due to the slowness associated with each simulation run as more variables and processes are incorporated into the complex ecosystem model. The computational overhead becomes a very important limitation for model calibration and scenario analysis, due to the large number of model runs generally required. This paper presents a framework for ecological simulations that intends to increase system performance through the ability to do parallel simulations, allowing the joint analysis of different scenarios. This framework evolved from the usage of one simulator and several agents, that configure the simulator to run specific scenarios, related to possible ecosystem management options, one at a time, to the use of several simulators, each one simulating a different scenario concurrently, speeding up the process and reducing the time for decision between the alternative scenarios proposed by the agents. This approach was tested with a farmer agent that seeks optimal combinations of bivalve seeding areas in a large mariculture region, maximizing the production without exceeding the total allowed seeding area. Results obtained showed that the time needed to acquire a “near” optimal solution decreases proportionally with the number of simulators in the network, improving the performance of the agent’s optimization process, without compromising its rationality. This work is a step forward towards an agent based decision support system to optimize complex environmental problems. INTRODUCTION Ecological models are simplified views of nature, used to solve scientific and/or management problems. These models can be seen as geographical maps (which themselves can be seen as models) - different types of maps serve different purposes: for cars, for railways, for airplanes, for pedestrians, for geologists, and so on. They focus on different objects, so they have different layouts and they exist also in different scales intending to be used in different applications. Proceedings 23rd European Conference on Modelling and Simulation ©ECMS Javier Otamendi, Andrzej Bargiela, José Luis Montes, Luis Miguel Doncel Pedrera (Editors) ISBN: 978-0-9553018-8-9 / ISBN: 978-0-9553018-9-6 (CD)
Pedro Duarte CIAGEB – UFP, University Fernando Pessoa Praça 9 de Abril, 349, 4249-004 Porto, Portugal E-mail:
[email protected]
Ecological models contain only the characteristic features that are essential in the context of the problem to be solved or described. They may be considered a synthesis of what is known about the ecosystem with reference to the considered problem. As opposed to a statistical analysis based on empirical relationships between the data, a model is able to translate the modeller’s knowledge about a system, formulated in mathematical equations and component relationships (Jørgensen and Bendoricchio 2001). For the same ecosystem there may be different ecological models, selected in accordance to the model’s goals. Coastal ecosystems always played an important role in the life of human beings. They allow an enormous amount of possible activities (such as fishing, aquaculture, harbour activities, tourism, etc.), and guarantee several basic services to humanity, but they are also the final destination of many pollutants generated by agriculture and other human activities (Duarte et al. 2007). In the last century, human population migrated intensively from inland to coastal boundaries and, nowadays, the World Bank estimates that 50% of the world’s population lives within 60km from the sea (Watson et al. 1996). These numbers are more relevant in Portugal where almost 89% of the population lives within 50km from the sea and occupies only 39% of the territory (INE 2008). The occurrence of ecological disasters alerted the scientists and stakeholders to the need of working together towards the sustainable management of coastal ecosystems within the framework of Integrated Coastal Zone Management programs. Realistic simulations of coastal ecosystems require describing several physical, chemical and biological processes in mathematical terms. Physical processes include flow and circulation patterns, mixing and dispersion of mass and heat, settling and resuspension of planktonic organisms and suspended matter, solar radiation and light penetration. Chemical processes include biogeochemical cycles of important elements, such as nitrogen and phosphorus. Biological processes include growth and death rate of any organisms that may alter the concentration of different elements. The accurate simulation of these processes is very important for setting up a realistic model of the whole ecosystem. Detailed representations of these processes can be found in the literature since the 1980’s (Jørgensen and Bendoricchio 2001).
When coastal ecosystems are exploited for shellfish aquaculture one of the issues that always arises is how far the holders can increase the production in their assets without exceeding ecosystem carrying capacity (Duarte et al. 2003). Usually, the balance is maintained by legislation, which limits the areas of exploitation and thus the number of licenses in each area. Stakeholder’s experience, usually acquired by trial and error, successes and failures, leads them to have an empirical perception of what is the optimal exploitation density of each species per unit area, without much consideration for potential environmental impacts.
(corresponding each to a 500m x 500m area) within a large region area of 88 admissible cells to explore oysters – corresponding to more than 39 millions of possible combinations. The long time and the heavy processor power required for one complete simulation, limited the previous experiments to use only 1000 simulation steps in each cycle, extrapolating the results for the complete growth cycle – the simulator runs 1000 steps in about 22 seconds and one experimental round (341 simulations) is completed in approximately 2 hours.
The results of the development of an intelligent bivalve farmer agent to find out the best combination of bivalve seeding areas, within an allowed area of exploitation, were reported in (Cruz et al. 2007) and showed promising guidelines. One of the constraints pointed out in the conclusions of that study was the time consumed by each simulation run. Therefore the usage of a network of simulators was the natural follow up of that study. This paper presents the specification of the network that supports the coexistence of several simulators, the adaptation of the agents’ software to manage the parallel simulation of various scenarios, and the implementation of algorithms for parallel optimization, to integrate the results and decide what the best scenario is. The next section describes the problem in analysis, followed by the presentation of the framework for ecological simulations (EcoSimNet) – its architecture and implementation. The following section refers the experiments done and the results obtained. The paper ends with an analysis of the results, the conclusions and a description of future work to be done.
Figure 1 – Location of Sungo Bay, including model domain and bathimetry (Duarte et al. 2003) with delimited area of exploitation marked
The usage of a computer network allows decreasing the time needed to generate results and performing longer simulations to obtain more realistic results. The approach idealized was: •
Repeat the experiments made by (Cruz et al. 2007) using 1 and using 3 simulators, and compare the results obtained in terms of temporal savings and quality of the final solutions achieved;
•
Increase the number of simulation steps and confirm if the extrapolation, regarding the results achieved, assumed previously, remains valid;
•
Repeat the experiments with more cells to explore, and analyse the results.
PROBLEM STATEMENT A validated ecosystem model for Sungo Bay, People’s Republic of China (Duarte et al. 2003), implemented in the EcoDynamo simulator (Pereira et al. 2006) was used. The lagoon is modelled with a two-dimensional vertically integrated, coupled hydrodynamicbiogeochemical model, based on a finite difference bathymetric staggered grid with 1120 cells (32 columns x 35 lines) and a spatial resolution of 500m - Figure 1. The model has a land and an ocean boundary and the time step used was 30 seconds. One realistic simulation for the complete bivalve culture cycle should cover approximately 1.5 years, equivalent to more than 1 576 800 simulation steps - in a computer with an Intel® Core™ 2 CPU 6300 @ 1.86GHz and 2.00GB of RAM, the time to run the complete simulation rounds 10 hours. A previous bivalve farmer agent was developed by (Cruz et al. 2007) with the objective of finding the best combinations of locations to seed and harvest bivalve species within a delimited area of exploitation, using the previous model, towards bivalve production maximization. In that work the farmer agent had to choose the best 5 cells
The experiments used the algorithms implemented by (Cruz et al. 2007), controlled by a simulated annealing algorithm (Kirkpatrick et al. 1983) modified to support parallelisation and with more flexibility to control the number of simulations in each experimental round. IMPLEMENTATION EcoSimNet Framework The system architecture was designed to perform complex simulations of aquatic ecosystems, to integrate easily new applications in the system, like plug-and-
play hardware in computers,, and enabling communications between different applications. applications
messages. This approach ensures true independence between the simulator and the agents.
The Ecological Simulation Network (EcoSimNet) is based in a multi-agent architecture (Wooldridge 2002; Weiss 1999) where all the applications communicate via TCP/IP with messages formatted according to the specification of the ECOLANG language (Pereira et al. 2005). The framework can support more than one EcoDynamo simulator (Pereira et al. 2006), 2006) to allow parallel or concurrent simulations, and several agents representing senting the human interests over the simulated ecosystem (Figure 2).
Farmer Agent Implemented Algorithms
The ECOLANG language specification forces messages to be simple, expansible, independent from any computational platform or operating system, and readable by the humans, allowing easy traceability. trace This architecture permits the exploitation of machine learning algorithms with the inclusion of agents in the network (Dzeroski 2001; Russel and Norvig 2002; Pereira et al. 2004).
The base algorithm developed for the initial agent was a simple hill-climbing optimization timization algorithm, based on simulated annealing nnealing with Monte Carlo probability (Kirkpatrick ck et al. 1983; Mishra et al. 2005) – the agent seeks iteratively a new solution and saves the one with higher quality as the best. best Several configurable optimizations can be activated to influence the selection logic of the new solutions (Cruz et al. 2007). The generation of the new solutions was facilitated and improved by the inclusion of known algorithms, alg like tabu search (Glover 1986),, genetic algorithms (Holland 1975) and reinforcement learning (Sutton and Barto 1998), that can be triggered ggered at any stage of the optimization process. The novelty of this approach is centred in the system of customizable tactics that enables the activation of any one of the implemented algorithmss during the experiment, and the possibility of having, together, er, the various algorithms involved in choosing the best solution. The initial agent communicates only with one simulator. To manipulate the information of several simulators, it was necessary to generate a new agent, agent extending the former one, and with a decision ecision-making process that should integrate, in real time, the results from the various simulators as they were generated. The choice made was the implementation of a parallel simulated annealing algorithm (Ram et al. 1996). 1996) Parallel Simulated Annealing Algorithm Simulated annealing (SA) is considered a good tool for complex nonlinear optimization problems (Kirkpatrick et al. 1983) but one of its major drawbacks is its slow convergence. One way to improve its efficiency it’s parallelisation (the development of a parallel version of the algorithm).
Figure 2 - EcoSimNet architecture
The simulator has a simple graphical user interface where users can interact with some ecological model properties – the user can select the model to use, which processes to simulate, the period of time simulated, the variables for output, and the output formats such as file or chart. Definitions such as system morphology, geometric representation, dimensions and number of model grid cells and initial values of variables and parameters are fixed when the model is created. created The output files are compatible with major free and commercial software for posterior treatment, and the charts are generated through MatLab® libraries. libraries None of the agents have direct access to the model database.. These models are available only to the simulators. The simulators provide information about the model to the agents through the ECOLANG
Many implementations of this algorithm exist but they are, inherently, problem dependent. dependent (Ram et al. 1996) proposed two distributed algorithms for simulated annealing – the clustering algorithm (CA) and the genetic clustering algorithm (GCA). Both explore the evidence that a good initial solution results r in a faster convergence. The CA technique starts n nodes of the network to run SA algorithm using different initial solutions. After a fixed number of iterations, they exchange their partial results to gett the best one. All the nodes accept that solution and restart the SA based on that solution. This process is repeated a predefined number of times. There must be a coordinator node to choose the best solution and to control the moment to stop and end the process. The process implemented in our agent can be viewed as integrating the CA techniques described: the agent can accumulate the functions of coordinating (coordinator
node) and generating solutions (worker node); the generation of the new solutions is driven by the tactics chosen in each agent taking advantage of their autonomy. The flexibility of the framework allows each agent to control only some simulators.
simulators monitored by it (Figure 4, runSA – line 3), which means that if there is one very fast simulator and other one very slow, it is expectable that the faster one runs more simulations than the slower.
As simulators run in different computers, each one finalizes its simulation independently and the agent compares the result against all results accumulated so far; there is no need to synchronize the simulators. The implementation carried out can work perfectly only with one agent - in this case the coordinator and the worker nodes coincide. The basic algorithm for the coordinator node is presented in Figure 3 and the functions for the worker nodes are presented in Figure 4.
Figure 3 – Parallel SA Algorithm - coordinator node
The number of synchronization points determines the number of times the worker nodes exchange partial results, and this is important to speed up the optimization process. With this process, the number of iterations is distributed uniformly by the agents (worker nodes) but not necessarily by the simulators: while the coordinator node waits for agents synchronization to exchange the partial results (Figure 3, line 3.2), each worker node controls the number of iterations with all
Figure 4 – Parallel SA Algorithm – worker node
EXPERIMENTS AND RESULTS Description The new agent developed extends the previous one created by (Cruz et al. 2007) with the inclusion of the described parallel SA algorithm and a new user-friendly interface to configure and parameterize the implemented algorithms and tactics. All the experiments were done
with only one agent that accumulates the roles of the coordinator and worker nodes.
between the maximum and the minimum production value was less than 0.10% of the minimum.
The first set of experiments tried to reproduce the experiments made by (Cruz et al. 2007) - find the best 5 cells within a large region area of 88 admissible cells to explore oysters. Each simulation runs 1000 steps (about 8 hours of real time). The second set of experiments was performed using 3 distinct simulators; the agent communicates and configures all the simulators. The results were registered when the whole system reached 341 iterations (results collected to compare with the first set). In the third set of experiments the number of simulation steps was increased to cover one month of oysters growth (from 1000 to 86400 steps) to verify if the extrapolation assumed in previous experiments remains valid. For this experiment 4 simulators were used. The fourth set of experiments extended the previous one increasing the number of cells to seed to 50. Table 1 summarizes the experiments done. Table 1 - Experiments summary
Set
Description
1
Reproduces experiences made by (Cruz et al. 2007) with 1 agent and 1 simulator
2
Repeats set 1 using 3 distinct simulators
3 4
Figure 5 - Visualization of the 2 best solutions (exp #1)
The second set of experiments was performed using 3 distinct simulators, and one agent that configures the simulators and accumulates the coordinator and worker roles. As expected, the time needed to achieve 341 iterations was approximately one third (35 minutes) of the initial time and the results (Table 3 and Figure 6) followed the tendency observed previously. In this experiment the difference between the maximum and the minimum production value was 0.16% of the minimum. Table 3 – Results of experimental set 2
Rank
Production Value (Tonnes)
Cells
Extends set 2 to cover one month of simulation – using 4 simulators
1
169.83
71-78 -79-86-87
Extends set 3 with more cells to seed (50)
2
169.82
70-71-79-86-87
3
169.82
62-71-79-86-87
4
169.82
55-71-78-86-87
5
169.81
63-79-85-86-87
The experiments were performed in computers with an Intel® Core™ 2 Quad CPU Q9300 @ 2.50GHz, with 3.25 GB of RAM. The first set of experiments ran in about one hour and a half and the results confirm the tendencies related in (Cruz et al. 2007) – the borders are the best areas to explore: top right corner of the exploitation area is the best one (Table 2 and Figure 5). Table 2 - Results of experimental set 1
Rank
Production Value (Tonnes)
Cells
1
169.82
71-79-85-86-87
2
169.81
39-79-85-86-87
3
169.78
70-78-84-86-87
4
169.78
52-79-85-86-87
5
169.77
31-84-85-86-87
The results showed that the inclusion of parallel SA didn’t influence the results of the other algorithms. Although the results would be predictably different, the trends are comparable. In this experiment the difference
Figure 6 - Visualization of the 2 best solutions (exp #2)
In terms of results quality and time savings, it seems that the parallel SA is working as expected – the results maintain the tendency observed previously by Cruz et al. (2007) - and the time savings are directly related to the number of simulators in the network. In the third set of experiments, the number of simulation steps was increased from 1000 steps to 86400 steps
(from 8h20m till about one month of real time). This experiment took about 1 day and 19 hours to finish and the results are presented in Table 4 and Figure 7. The difference between the maximum and the minimum production value was now 0.83% of the minimum. Table 4 - Results of experimental set 3
Rank
Production Value (Tonnes)
1
7,731.80
5-28-46-50-72
2
7,725.19
19-45-60-67-82
3
7,724.11
28-50-57-61-64
4
7,722.25
27-50-59-60-66
5
7,722.06
27-53-57-58-59
Cells
Table 5 - Results of experimental set 4
Rank
Production Value (Tonnes)
1
77,199.52
2
77,184.49
3
77,177.26
4
77,137.60
5
77,104.35
Cells
Different sequences of 50 cells
Figure 8 - Visualization of the 2 best solutions (exp #4)
Figure 7 - Visualization of the 2 best solutions (exp #3)
The results of this experiment show a spread of solutions that hardly reveals any significant trend. It is important to notice that the ecosystem in question is subjected to tides, which influence how organic substances and phytoplankton are transported along the bay. The availability of these two items – the main bivalve food sources – determines oyster growth and production. It is no surprise that the trends revealed in the initial experiments were not confirmed, due to their very short simulation time. The simulated 8 hours is a very short period when compared to water residence time in the bay – between one and nineteen days (Duarte et al. 2003). Therefore, 8 hours is not enough to simulate properly the mixing processes and the food variability affecting oyster growth. Furthermore, when oyster biomass increases, important feedbacks to available food become apparent where local depletion of food items may limit bivalve growth (Duarte et al. 2005). Even without an obvious tendency in the area occupation, the fourth experimental set was realized to verify if the results were more reliable when the ratio between occupied area vs. exploitation area increases – from 5,7% in the previous experiments to 56,8% in this one (seed 50 cells within the same area of 88 cells to explore). The experiment took about 1 day and 18 hours and the results are presented in Table 5 and Figure 8.
The solutions present different patterns but with a tendency to concentrate oysters in the upper and right sides of the exploitation area. The patterns strengthen the tendency to fill the areas near the open sea, where sea water exchanges are more intense and food tends to be more abundant. Another important result is the coincidence in the occupied areas – the 2 best solutions share 37 cells in 50 (74%) and in the 5 best solutions more than 60% of the cells remain selected. The difference between the maximum and the minimum production value increases to 1.9% of the minimum. CONCLUSIONS AND FUTURE WORK This paper presented a new framework for complex ecological simulations - EcoSimNet. This framework allows the coexistence of multiple simulators in the network, controlled by different agents, enabling the simulation of different scenarios in parallel, increasing the number of simulations and the real time simulated, without compromising the quality of results and ensuring a more complete analysis of scenarios. The results obtained showed that the time needed to reach a “near” optimal solution decreases proportionally to the number of parallel simulators in the network. The strategy followed in the implementation of the parallel simulated annealing algorithm, separating the roles of the coordinator and the worker nodes, allowed the independence of each agent tactics for optimization; the experiments showed that the inclusion of the two roles in the same agent didn’t compromise the agent’s rationality.
This work is a step forward towards an agent based decision support system to optimize complex environmental problems. More experiments need to be done, increasing the number of simulators and agents in the network, in order to have a clear idea of what reasonable limits should be imposed on the size of the EcoSimNet framework. The next steps in this platform will incorporate automatic decision in the coordinator agent, to decide how many simulators and worker agents will be necessary to consider new scenarios, and to determine degrees of similarity with scenarios already exploited. Furthermore, multi-criteria optimization simulations will be tested, where agents will evaluate different scenarios according to environmental and economical objectives. ACKNOWLEDGEMENTS This work was started during the ABSES project – “Agent-Based Simulation of Ecological Systems” (FCT/POSC/EIA/57671/2004) and António Pereira was supported by the FCT scholarship SFRH/BD/1633/2004 during part of its execution. REFERENCES Cruz, F., A. Pereira, P. Valente, P. Duarte, and L. P. Reis. 2007. "Intelligent Farmer Agent for Multi-agent Ecological Simulations Optimization". In Proceedings of the 13th Portuguese Conference on Artificial Intelligence, (Guimaraes, Portugal). 593-604. Duarte, P., B. Azevedo, C. Ribeiro, A. Pereira, M. Falcão, D. Serpa, R. Bandeira, and J. Reia. 2007. "Management oriented mathematical modelling of Ria Formosa (South Portugal)". Transitional Water Monographs, 1 (1): 13-51. Duarte, P., A. J. S. Hawkins, and A. Pereira. 2005. "How does estimation of environmental carrying capacity for bivalve culture depend upon spatial and temporal scales?" In Comparative Roles of Suspension-Feeders in Ecosystems, R. F. Dame and S. Olenin (Eds.). Nida, Lithuania, 121135. Duarte, P., R. Meneses, A. J. S. Hawkins, M. Zhu, J. Fang, and J. Grant. 2003. "Mathematical modelling to assess the carrying capacity for multi-species culture within coastal waters". Ecological Modelling, 168 (1-2): 109-143. Dzeroski, S. 2001. "Applications of symbolic machine learning to ecological modelling". Ecological Modelling, 146 (1-3): 263-273. Glover, F. 1986. "Future paths for integer programming and links to artificial intelligence". Computers & Operations Research, 13 (5): 533-549. Holland, J. H. 1975. Adaptation in natural and artificial systems. Ann Arbor: The University of Michigan Press. INE, I. N. d. E.-. 2008. Statistical Yearbook of Portugal 2007. 1st ed. 1 vols. Lisboa: Instituto Nacional de Estatística, IP. Jørgensen, S. E., and G. Bendoricchio. 2001. Fundamentals of Ecological Modelling. 3rd ed. 1 vols: Elsevier. Kirkpatrick, S., C.D.Gelatt, and M. P. Vecchi. 1983. "Optimization by Simulated Annealing". Science, 220 (4598): 671-680. Mishra, N., Prakash, M. K. Tiwari, R. Shankar, and F. T. S. Chan. 2005. "Hybrid tabu-simulated annealing based
approach to solve multi-constraint product mix decision problem". Expert systems with applications, 29 (2): 446454. Pereira, A., P. Duarte, and A. Norro. 2006. "Different modelling tools of aquatic ecosystems: A proposal for a unified approach". Ecological Informatics, 1 (4): 407-421. Pereira, A., P. Duarte, and L. P. Reis. 2004. "Agent-Based Simulation of Ecological Models". In Proceedings of the 5th Workshop on Agent-Based Simulation, (Lisbon, Portugal). SCS Publishing House, 135-140. Pereira, A., P. Duarte, and L. P. Reis. 2005. "ECOLANG - A communication language for simulations of complex ecological systems". In Proceedings of the 19th European Conference on Modelling and Simulation (ECMS 2005), (Riga, Latvia). 493-500. Ram, D. J., T. H. Sreenivas, and K. G. Subramaniam. 1996. "Parallel Simulated Annealing Algorithms". Journal of Parallel and Distributed Computing, 37 (2): 207-212. Russel, S. J., and P. Norvig. 2002. Artificial Intelligence: A Modern Approach. 2nd ed. New Jersey: Prentice Hall. Sutton, R. S., and A. G. Barto. 1998. Reinforcement Learning: An Introduction. 1 vols: The MIT Press. Watson, R. T., M. C. Zinyowera, and R. H. Moss. 1996. Climate Change 1995 - Impacts, adaptations and mitigation of climate change, Scientific-Technical Analyses. Edited by I.-I. P. o. C. Change. Vol. 1. Cambridge, UK: Cambridge University Press. Weiss, G., ed. 1999. Multiagent Systems: A Modern Approach to Distributed Artificial Intelligence. Cambridge, Massachusetts: MIT Press. Wooldridge, M. 2002. An Introduction to MultiAgent Systems. 1 vols. West Sussex, England: Jonh Wiley & Sons Ltd.
AUTHOR BIOGRAPHIES ANTÓNIO PEREIRA was born in Porto, Portugal, and obtained his degree in Electrical Engineering and his MSc in Artificial Intelligence and Computation in the University of Porto. Since 2003 he is dedicated to research in the field of Agent-Based Simulation and Optimization systems and he is a PhD student in Informatics Engineering. His e-mail address is:
[email protected] and his webpage can be found at http://www.fe.up.pt/~amcp. PEDRO DUARTE was born in Lisbon, Portugal, obtained his degree in Biology at the University of Lisbon and his PhD in Environmental Sciences at the New University of Lisbon, in 1995. He has been involved in several European projects doing research in the field of Ecological Modelling applied to environmental problems such as carrying capacity estimation for aquaculture. His e-mail address is:
[email protected] and is webpage can be found in http://homepage.ufp.pt/~pduarte. LUIS PAULO REIS was born in Porto, Portugal, and has a PhD in Electrical Engineering (Coordination in Multi-Agent Systems) in the University of Porto. He has been researching in the area of (Multi-Agent) intelligent simulation for several years in different projects including FC Portugal simulated robotic soccer team – World and European champion of RoboCup in 2000 and 2006. His e-mail address is
[email protected] and his web-page stays at http://www.fe.up.pt/~lpreis.