In this paper we explore the use of data mining to support group work in the ... mirroring visualization to provide a high-level view of the activity of the group and ...
Educational Data Mining to Support Group Work in Software Development Projects Judy Kay, Irena Koprinska, Kalina Yacef School of Information Technologies, University of Sydney, NSW 2006, Australia {judy, irena, kalina}@it.usyd.edu.au
ABSTRACT In this paper we explore the use of data mining to support group work in the context of a senior level, capstone software development projects. We mined data collected from students working in teams and interacting with online group support tools such as wikis, planning and tracking systems and version control software repositories. We applied three data mining techniques: mirroring visualization to provide a high-level view of the activity of the group and contribution of each member; sequential pattern mining and clustering to identify patterns characterizing the behavior of strong and weak groups. The results are promising and can be used to improve monitoring and self-monitoring of student progress, for early identification of problems in groups and to help students to work more effectively in groups.
I. INTRODUCTION
Educational data mining is the process of converting data from educational systems to useful information to inform pedagogical design decisions and answer educational questions. With the increasing use of technology in education, there is a large amount of content and electronic traces generated by student interaction with computer learning environments such as collaborative learning systems, project management systems, intelligent teaching systems, simulators and
educational game environments. The challenge is how to effectively mine these large amounts of data, find meaningful patterns and present them to teachers and students in a useful form. In this paper we focus on supporting teaching and learning of group work skills. Group work is central in many aspects of life. It is especially important in the workplace where most often the combined efforts of a group of people are required to complete a complex task in a given time. The context of our study is a senior software development project, where students work in groups to develop a software solution for a real industry client over a semester. Students use a state-of-the art online group collaboration environment with tools such as a wiki for sharing web pages, ticketing coordination and planning tool and software repository with version control. Our goal was three-fold: 1.
To provide a high-level overview of the activity of each group member. The teachers
can use this overview at the weekly meetings to provide a starting point for review of the group’s recent progress and also to help identify potential problems early enough for remedial actions to be effective. Individual students can also use the overview for self-monitoring to check if they are contributing effectively and if they are fulfilling their allocated roles, e.g. leader, tracker, software developer. 2.
To identify patterns of activities associated with strong and weak groups. Using historic
data from previous courses, patterns characterizing the behavior of strong and weak groups can be identified at various levels (e.g. individual students or groups) and in different forms (e.g. as a sequence of temporal events or a summary of characteristics, ignoring the time aspect). The teacher monitoring the current group can recognize such patterns and provide timely feedback during the semester, e.g. identify ineffective patterns and work with the group to rectify them; identify positive patterns and reinforce them. These patterns can also
improve the teaching of group skills by providing concrete examples illustrating key principles such as effective leadership and monitoring activity. 3.
To improve our understanding of how the strong groups make use of the online
collaboration tool. This can be used by teachers in future courses to customize the online environment and assessment, in order to improve student learning. To achieve these goals, we applied three approaches: 1) mirroring visualisations to summarise the huge amounts of longitudinal data and give students and teachers a bird eye view of the activity of the group; 2) sequential pattern mining to identify interactions between team members and action sequences characterizing strong and weak groups; and 3) clustering of the students and groups according to their activity to find non-temporal patterns characterizing student and group behavior. The next section describes the theoretical underpinning of our work and the related work. Then we present the context of our study and the data used. The following sections explain the application of the three data mining techniques, highlight the important findings and discuss how the results can be used to improve group work skills.
II. THEORETICAL UNDERPINNING AND RELATED WORK
Our approach was driven by two forms of theoretical underpinning. The first one is the Big Five theory of group work [1]. It states five key factors for success of group work: leadership, mutual performance monitoring, backup behaviour, adaptability and team orientation. Backup behaviour involves reallocating work between members as their different loads and progress becomes recognised. Adaptability is a broader form of changing plans as new information about
group and external issues are identified. Team orientation covers aspects such as commitment to the group. The Big Five theory also identifies three supporting mechanisms: shared mental models (e.g. shared understanding of how the group should operate); mutual trust, closed loop communication (e.g. a person posting a message on any media receives feedback about it and confirms this). This theory provides a language with which to discuss group work and also guides our data mining. The second theoretical underpinning is based on Extreme Programming [2], a successful software development methodology. Some of its key principles are: constant communication within the group and with customers, simple clean design, pair programming, testing the software from day one, delivering the code to customers as early as possible and implementing changes as suggested. These principles helped us identify the features of activity that should be extracted, used in the analysis and presented in the visualizations. Some researchers have investigated the use of data mining to analyze collaborative interactions. Talavera and Gaudioso [3] applied clustering to student interaction data to build profiles of student behaviours in a course teaching the use of Internet. Data was collected from forums, email and chat. The goal was to support evaluation of collaborative activities and although only preliminary results were presented their work confirmed the potential of data mining to extract useful patterns and get insight into collaboration profiles. In [4] a method based on clustering and statistical indicators was proposed. The aim was to infer information about the collaboration process in an online collaborative learning environment. Prata et al. [5] have developed a machine-learned model which automatically detects students’ speech acts in a collaborative learning environment and found a positive correlation between speech acts denoting interpersonal conflict and learning gains. Soller [6] analysed knowledge sharing
conversations using Hidden Markov models and multidimensional scaling. However, her approach required group members to use a special interface using sentence. The DEGREE system [7] allows students to submit text proposals, co-edit and refine them, until agreement is reached. However, it also requires a special interface and user classified utterances and is also limited to a single collaboration medium. By contrast, we wanted to ensure that the learners used collections of conventional collaboration tools in an authentic manner, as they are intended to be used to support group work; we did not want to add interface restrictions or additional activities for learners as a support for the data mining. These goals ensure the potential generality of the tools we want to create. It also means that we can explore the use of a range of collaboration tools, not just a single medium such as chat. Mirroring visualizations to support group collaboration have been used previously [8, 9]. In [10] the goal is to improve participation rate by creating an adaptive rewards system using mirrored group and individual models. However, it significantly differs from our goal of supporting small groups for which learning group work skills is one of the learning objectives and the group work is the key focus. In our previous work we found that mirroring of simple overall information about a group is valuable [11]. The work on social translucence [12, 13] has also shown the value of mirroring for helping group members to realize how they are affecting the group and to alter their behavior.
III. DATA
The context of this study is a senior level capstone software development project course which runs over a semester. There were 43 students, working in 7 groups of 5-7. The task was to
develop a software solution for a client. The topics varied from creating a computer-based driving ability test to developing an object tracking system for an art installation. The groups were required to use Trac [14], an open-source, web-based, project management system for professional software development. It consists of three parts, tightly integrated through hyperlinks: •
A group wiki supporting communication and documentation. It allows the group members to add, remove or edit shared web pages, linked from the main group page.
•
A ticket system supporting task management. A ticket is created for each task that the team has to do and is assigned to a person for completion. The team can also add comments on it, reassign it to somebody else or close it.
•
Subversion (SVN) is for source code management. It provides a repository for the software created by the group and manages the changes. It allows recovery of older versions of the software and a view of the history of how the files and directories were changed. The Trac usage data contained roughly 15,000 events and its size was 1.6 MB in mySQL
format. We also had the progressive and final student marks which take into account both the quality of the product and the group management process followed. Based on them, the groups were ranked and named accordingly - Group 1 is the best group and Group 7 is the weakest.
IV. DATA MINING APPROACHES AND RESULTS
A. Mirroring Visualisations One of the important challenges facing teachers and students in the context of group work is see the big picture - whether group members are all contributing effectively and if they are fulfilling
their allocated roles. During a semester long project, using a system such as Trac, the groups generate a large amount of electronic traces. This data contains rich and valuable information that can help to determine group progress and identify problems early enough to intervene effectively. However, the raw data cannot be used directly by teachers and students due to its large quantities and overwhelming amount of detail. To address this problem, we designed a high-level visual summary (mirror) of the activities of each group member over time. Our goal was to extract an overview of the huge amount of group activity data and present it in a form that is a useful starting point for exploring if the group is working effectively. For example, at the weekly meetings with the groups, the teachers can point to summary and ask students to explain how it relates to the work done. Given the multifaceted nature of group interactions, especially in our context where students work for months on complex projects, we needed to decide what data to mine to provide the information needed for our goals of facilitating group operation, identifying potential group problems early and presenting an effective starting point for review of the group's recent progress. The 5 key factors for success from the analysis of group work and the key elements of group management from Extreme Programming pointed to the key elements that teachers and students should be able to inform from the mirror visualizations We concluded that we should: 1) summarise each student’s activity (daily and cumulatively) on each of the media (wiki, task planning tickets and version control actions in the software repository) and 2) summarise the flow of interaction between the team members. We expected that some group members would have different patterns of activity from others, e.g. the group leader should have appeared more active on planning tasks, reflected in creation of tickets;
the absence of this pattern would suggest that the leader is not doing their job. We also expected that better groups would show a higher interactivity than the weaker ones.
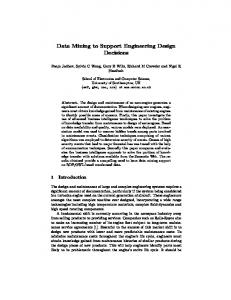
Figure 1. Wattle diagram We designed a set of visualisations to meet these goals. We will describe two of them. Figure 1 shows our main visualisation, the Wattle Tree (named after an Australian native plant with fluffy golden-yellow round flowers). Each person in the team appears as a “tree” that climbs up the page over time. The tree starts when the user first does an action on any of the three media considered. The vertical axis shows the date and the day number. Wiki-related activity is represented by yellow “flowers”, circles on the left of the trees. SVN-related activity is similarly represented, as orange flowers on the right of the trees. The size of the flower indicates the size of the contribution. Ticket actions are represented by leaves – the green lines: a dark green leaf on the left indicates a ticket was open by the user and a light green leaf on the right indicates the user closed a ticket. The length of the left leaf is proportional to the time it remained opened.
Those still open are shown at a standard, maximal size (e.g. the ones around day 41 in Figure 1). As already discussed, a good team leader will typically take the responsibility for opening most of the tickets. We see that the leftmost person in Figure 1 has opened many tickets while the closing of tickets is more evenly distributed across the team. Although these visualizations are intended to be meaningful for the team, rather than the outsider viewing them, there are some features we can identify in Figure 1. The two students at the left appear to have been the most active in management aspects at the wiki and tickets: knowledge of the group bears this out. The fourth student from the left is particularly active on SVN corresponding to a larger role in the technical development. The fifth student from the left has a hiatus from about Day 27 corresponding too little activity. This group had times when several members were ill or had other difficulties and they could see the effect of these problems in the Wattle diagram. The team member with responsibility for tracking progress could use the Wattle tree to get an overview of activity at a glance. This serves as a starting point for delving into the details, as needed, by checking individual tickets, wiki pages and SVN documents and their histories. Wattle trees do not contain information on who issued tickets to whom, and who contributes to a wiki page. In order to visualise these activities, we use what we call an interaction network, inspired by the graphical notations used in Social Network Analysis [15], and showing relationships and flows between entities. An example for one group is shown in Figure 2. The nodes represent team members and the lines between them indicate interaction between the team members, as they modify the same wiki page, SVN file or ticket. The width of the edge is proportional to the number of interactions between them. These interaction graphs can be used for reflective group activities in class. They may indicate different patterns and require deep knowledge for interpretation. For example, a tick line
may correspond to a group member writing poor code with the others having to fix it or a group member who doesn’t trust the others and frequently edits their code.
Figure 2. Interaction network The Wattle tree and interaction networks were available during the semester and were used in the weekly meetings between student groups and teachers. Individual students found that they could see what they and the other students in the group have been doing and whether they have been performing at appropriate levels. Teachers found that they could identify group problems very early and help address them. The visualization tools we developed were also used successfully in the context of postgraduate courses in educational technology where groups worked collaboratively to write essays. Thus, they have a broader value. Future work will include making the Wattle trees and interaction networks interactive. We have recently developed an interactive visualization, called Narcissus [16]. It supports views at three levels: group, project and ticket, and the user can also click on the components and see the supporting evidence.
B. Sequential Pattern Mining The temporal order of events is an important aspect of group work. We investigated if there are recurrent sequences of events distinguishing the stronger from the weaker groups. For instance, we expected to see the following pattern in the strong groups: the leader amends a wiki page, creates tickets, allocates them to group members who accept the ticket, act on it (activity on the wiki and/or the SVN), then comment on the ticket and close it. To find such temporal patterns we used sequential pattern mining [17]. A sequence is defined as an ordered set of elements (events). Given a sequence dataset and a threshold s (called support), it finds all sequences that occur at least s times in the dataset. Sequential pattern mining has been previously used in elearning although for different goals than ours: to support personalised course delivery based on the learner characteristics [18] and to recommend sequences of resources for users to view in order to learn about a given topic [19]. We used the Generalized Sequential Pattern Mining (GSP) algorithm [17] which is a multiple-pass, candidate generation-and-test approach, based on the so called apriori property. We have slightly modified the standard GSP, as described in [20], to better suit our context. Before the sequential pattern mining can be performed, the data needs to be suitably preprocessed. This involved three critical steps summarised below (for more details see [20]): 1) Abstraction of the raw data into a list of events for each group (a unique, chronological sequence of events). The resulting sequence for each group consisted of 1416 - 3395 events. 2) Splitting these long sequences into a dataset of several meaningful sequences. We formed three types of sequences: (i) for the same resource (e.g. the same wiki page or ticket); (ii) for a group session (a session is formed by cutting the group event sequence where gaps of
minimum length of time occurred) and (iii) for the same task (a task is defined by a ticket and comprising all events linked from and to that ticket). 3) Encoding the events suitably to facilitate data mining. We developed and used several alphabets to describe our events in a way that could compress our data meaningfully and ran the GSP algorithm using all these alphabets. Table 1 summarises some of the distinctive patterns we found for the strong and weak groups and their explanation. Table 1. Sequential patterns for best and weak groups Patterns Patterns found in best groups Frequent alternation of SVN and wiki events Frequent alteration of SVN and ticket events Tickets used more often than wiki, and many consecutive ticket events
Many consecutive SVN events Many SVN events on the same files High ticketing activity for Leaders - tickets created by Leader, accepted by another member, Leaders commenting on tickets and following up assigned work. Patterns found in weak groups Frequent alternation of wiki and ticket events and lack of sequences containing SVN events Lack of SVN events Wiki used more often than tickets
Explanation Documentation in wiki about SVN commits to group repository Tickets being updated following SVM commits Higher and better use of the ticketing system; tickets are more-task oriented than wiki and ticketing system is better indicator of the work actually done Work more often committed to group repository Regular commits to the repository (software development done) Effective leadership
The wiki and tickets were not used to support software development Less actual work done Wikis are less focused and task-oriented than tickets Less effective leadership.
Leaders involved in too much technical work. Tickets created by Leader, followed by ticketing events by other members (e.g. open, edit, close), before completing work. Tracker rather than Leader creating and Tracker performing leadership duties editing many tickets
After the extraction of these patterns, the teachers examined in detail the actions on Trac and confirm the meaningfulness of the results. The results can be used in future teaching to provide concrete examples of patterns associated with good and poor practice, e.g. to illustrate general principles such as effective leadership and monitoring in terms of wikis, tickets and SVN activity. The patterns can also be extracted and presented to students during the semester as formative feedback to help rectify poor group operation and encourage effective practices.
C. Clustering We applied clustering to find patters characterising the student behaviour at two levels: groups of students and individual students. Clustering is an unsupervised method for finding groups of similar objects using multiple data attributes. We used the classical k-means clustering algorithm as it is simple, effective and relatively efficient [21].
1. Clustering groups
Two key issues critically affect the performance of clustering algorithms: attribute selection and number of clusters. We experimented with various sets of attributes [20] and found a set of 11 attributes based on all media (wiki, ticket and SVN) to be the most informative. These attributes were derived from the number of events per ticket, number of days ticketing occurred, number of events per wiki page, wiki page usage span, number of lines edited/deleted per wiki edit, number of days SVN activity occurred and others.
The number of clusters was set to 3 based on our knowledge about the groups, e.g. their progressive and final marks which reflected the quality of the processes followed and the quality of the final product. The resulting clusters for k-means and their distinguishing characteristics are shown in Table 2. It should be noted that we also experimented with hierarchical clustering and EM for k=3 and obtained the same clusters.
Table 2. Clustering groups of students Cluster 1: Group 1
2: Groups 5 &7 3: Groups 2, 3, 4 & 6
Distinguishing characteristics Tickets Wiki - Very frequent activity; - High edits per wiki page; - High events per ticket; - High wiki page usage span; - High % of ticket update and ticket accepting events; - Moderately frequent activity; - High edits per wiki page; - Low number of events per - Low number of lines added/ ticket and low % of ticket deleted per wiki edit; update events; - Infrequent activity; - Moderate number of lines added/ deleted per wiki edit; - Moderate number of events per ticket and moderate % of ticket update events;
SVN - Very frequent activity;
- Moderately frequent activity; - Infrequent activity;
The first cluster contains only Group 1 (the top group) and is characterised with active use of the three media and high number of active events such as ticket acceptance and update, wiki page edits and SVN activities. The second cluster contains Groups 5 and 7 and it is characterized with moderately frequent use of tickets and SVN and low number of active events. Although there were many edits of wiki pages as in cluster 1, they involved small modifications (lines added/deleted). The third cluster contains the remaining groups and is characterised by overall low ticketing and SVN activity. While low ticketing activity is typically associated with weaker groups, Group 2, the second best group, also showed this characteristic as it was reluctant
to use the ticketing system. These results were useful for the teachers. For example, the teachers had some sense that Group 1 was well managed but this cluster analysis pointed to some interesting behaviors distinguishing this group that we didn’t noticed before. For example, we found that the group made extensive use of the wiki on each ticket for communication about the task associated with it, which is a novel and effective way to use TRAC. This new understanding was used in subsequent teaching and was evaluated by the teachers as helpful.
2. Clustering students To gain insight in the group composition, we also conducted clustering of the individual students. We selected 14 attributes, similar to the attributes used in the clustering of the groups but characterising individual not group activity; for more details see [20]. Table 3 shows the clusters obtained with k-means for k=4 (set empirically), together with their characteristics. Based on our interpretation of the cluster characteristics, a cluster label was assigned (“Managers”, “Ttacoriented developers”, “Loafers” and “Others”). We then looked at the group composition, taking into account the labels assigned to each student; see Table 4. The stars (*) show where the group’s designated manager (leader) was placed by the clustering. This role was allocated to one person after the initial start-up period. For example, Group 7 consisted of 7 students; 1 of them was clustered as “Manager”, 0 as “Trac-oriented developer”, 2 as “Loafers” and 4 as “Others”; the designated manager was clustered as “Manager”.
Table 3. Clustering individual students Cluster label Managers
Cluster size 8 students
Trac-Oriented Developers
9 students
Loafers
11 students 15 students
Others
Distinguishing Characteristics Tickets Wiki SVN - Moderate SVN - High ticketing activity - High wiki activity activity - Involved in many tickets; - Moderately high - Moderate wiki Very high SVN ticketing activity activity activity - Ticketing occurring on many different days - Low ticketing activity - Low wiki - Low SVN activity activity -Moderately low - Moderately low - Many SVN ticketing activity wiki activity events on days which SVN events - Many wiki occurred events on days which wiki events occurred Table 4. Group Composition Managers
Group 1 Group 2 Group 3 Group 4 Group 5 Group 6 Group 7
*1 *1 0 *1 3 *1 *1
Trac-Oriented Developers 3 0 1 3 *1 1 0
Loafers
Others
1 1 2 2 0 3 2
1 3 *3 0 3 1 4
Some new interesting differences between the groups emerged. Groups 2 and 3 (placed in the same cluster, see Table 2) differ by Group 3’s lack of a manager and Group 2’s lack of Tracoriented developers. The first finding was consistent with our knowledge of the leadership problems this group encountered, with the original manager leaving the course and another student taking over. The second finding was validated in a group interview where the main developers expressed a reluctance to use Trac. Group 5 is also distinctive in its excess of
managers which was further complicated by their designated manager being placed in the “Tracoriented developers” cluster. It appears that this weak leadership resulted in others reacting to fill the manager’s role, with their technical work subsequently being compromised, which is a pattern to be aware of in future groups. To verify if these patterns were evident earlier, we ran the clustering using the data only from the first seven weeks. We found that already some of these key results had emerged. For example, the Group 5 leader was already showing the developer’s behaviours. Had the teachers been aware of this, they may have been able to help this group deal with this problem, early enough to have made a difference. The presence of three loafers was also apparent in Group 6. The early data also showed leadership’s behaviours by all other leaders at that stage. These results have great value not only for the teachers but also for the individuals to understand their behaviour and change it, if needed. In conclusion, we found clustering to be useful, revealing interesting patterns characterising the behaviour of the groups and individual students. Strong groups are characterised by effective group leadership and frequent use of the three media, with high number of active events. Some important results are evident in early data, in time for timely problem identification and intervention.
D. Limitations The data has several limitations that affected the results. First, the Trac data doesn’t capture all group communication. In addition to Trac, students collaborated and communicated via other media to which we don’t have access, such as face-toface meetings twice a week, instant messaging, telephone conversations, SMS. An addition of a
chat tool to Trac can capture some of this communication and also increase the use of Trac. Second, the data mining results revealed insufficient use of Trac by some of the groups (e.g. Group 2) and subsequent interviews revealed that they were reluctant to use Trac as they felt it was cumbersome and preferred to communicate by other means. Third, there were not enough instances for the cluster analysis, especially for the clustering of groups. Although our data contained more than 15000 events, there were only for 7 groups and 43 students to cluster. Nevertheless, we think that clustering using the collected data and selected attributes allowed for uncovering useful patterns characterising the work of stronger and weaker students as already discussed. The follow-up interviews were very helpful for interpreting and validating the patterns.
V. CONCLUSIONS
This paper describes our work on mining of student group interaction data. Our goal was to improve teaching and learning of group work skills in the context of a capstone software development project course. Students used Trac, a state-of-the art collaborative platform for software development which includes wiki for shared web pages, ticket task management system and software repository system. We applied three data mining approaches: mirroring visualisation, sequential pattern mining and clustering. We found that they enabled us to achieve the goals of early identification of problems in groups, improving monitoring and selfmonitoring of student progress throughout the semester and helping students to learn to work effectively in groups.
More specifically, mirroring visualizations such as Wattle trees and interaction networks helped to understand how well individual members are contributing to the group and can be used for reflective activities in class. The clustering and sequential mining results revealed interesting patterns distinguishing between the strong and weak groups, and we also found that some of them can be mined from early data, in time to rectify problems. The next step will be to automate the discovery of patterns during the semester, match them with the patterns we validated and present regular formative feedback to students, including useful links and remedial exercises. Future work will also include systematic evaluation of the impact of the results on student learning in future cohorts. Our work also highlighted some of the challenges in analysing and visualising educational data. Educational data is temporal, noisy and lacking enough data for some tasks. For example, one of the groups was reluctant to use the ticket system which resulted in non-representative ticket data; there were not enough samples for the clustering of the groups (i.e. many events but a small number of students and groups). Good understanding of the educational domain and data and using suitable pre-processing for data abstraction, representation and feature selection are critical for the success. Our approach and results may be valuable not only for software development projects using online collaboration systems similar to Trac, but also to the much broader area of Computer Supported Collaborative Learning where teachers need to address many of the same concerns that were drivers for this work, e.g. to identify groups that are functioning poorly, whether individuals are not contributing or are doing so in ways that do not match their assigned group role and responsibilities.
REFERENCES 1. 2. 3.
4.
5.
6.
7.
8.
9.
10 .
11 .
12 .
13 .
14 . 15 . 16 .
Salas, E., D.E. Sims, and C.S. Burke, Is There a "Big Five" in Teamwork? Small Group Research, 2005. 36: p. 555-599. www.extremeprogramming.org. XP - Extreme Programming. [cited 2007; Available from: www.extremeprogramming.org. Talavera, L. and E. Gaudioso. Mining Student data to Characteroze Similar Behavior Groups in Unstructured Collaboration Spaces. in European Conference on Artificial Intelligence. 2004. Anaya, A.R. and J.G. Boticario, A data mining approach to reveal representatative collaboration indicators in open collaboration frameworks, in Educational Data Mining Conference. 2009: Cordoba, Spain. p. 210-219. Prata, D.N., R.S.d. Baker, E.d.B. Costa, C.P. Rose, Y. Cui, and A.M.J.B.d. Carvalho, Detecting and Understanding the Impact of Cognitive and Interpersonal Conflict in Computer Supported Collaborative Environments, in Educational Data Minig, T. Barnes, M. Desmarais, C. Romero, and S. Ventura, Editors. 2009: Cordoba, Spain. p. 131-140. Soller, A., Computational Modeling and Analysis of Knowledge Sharing in Collaborative Distance Learning. User Modeling and User-Adapted Interaction, 2004. 14(4): p. 351381. Barros, B. and M.F. Verdejo. Analysing Student Interaction Processes in Order to Improve Collaboration. The DEGREE Approach. . International Journal of Artificial Intelligence in Education 2000 [cited 11; 221-241]. Jermann, P., A. Soller, and M. Muehlenbrock. From Mirroring to Guiding: A Review of State of the Art Technology for Supporting Collaborative Learning. in First European Conference on Computer-Supported Collaborative Learning. 2001. Maastricht, The Netherlands. Bratisis, T., A. Dimitracopoulou, A. Martinez-Mones, J.A. Marcos-Garcia, and Y. Dimitriadis, Supporting members of a learning community using interaction analysis tools: the example of the Kaleidoscope NoE scientific network, in International Conference on Advanced Technologies (IICALT). 2008: Santander, Spain. p. 809-813. Cheng, R. and J. Vassileva, Design and Evaluation of an Adaptive Incentive Mechanism for Sustained Educational Online Communities. User Modeling and User-Adapted Interaction, 2006. 16(3): p. 321-348. Kay, J., P. Reimann, and K. Yacef. Mirroring of group activity to support learning as participation. in International Conference on Artificial Intelligence in Education (AIED'07). 2007. Los Angeles, USA: IOS Press. Erickson, T., C. Halverson, W.A. Kellogg, M. Laff, and T. Wolf, Social translucence: designing social infrastructures that make collective activity visible Communications of the ACM, 2002. 45(4): p. 40-44. Erickson, T. and W.A. Kellogg, Social translucence: An approach to designing systems that mesh with social processes. ACM transactions on computer-human interaction, 2000. 7(1). http://trac.edgewall.org/. TRAC. 2007 [cited; Available from: http://trac.edgewall.org/. Scott, J., Social network analysis: A handbook. 1991, London: Sage. Upton, K. and J. Kay, in International Conference on User Modelling, Adaptation and Personalisation. 2009: Italy. p. 54-65.
17 .
18 .
19 .
20 .
21 .
Srikant, R. and R. Agrawal. Mining sequential patterns: Generalizations and performance improvements. in Fifth Int'l Conference on Extending Database Technology (EDBT). 1996. Avignon, France. Wang, W., J.-F. Weng, J.-M. Su, and S.-S. Tseng. Learning Portfolio Analysis and Mining in SCORM Complaint Environment. in 34th ASEE/IEEE Frontiers in Education Conference. 2004: IEEE. Cummins, D., K. Yacef, and I. Koprinska, A Sequence Based Recommender System for Learning Resources. Australian Journal of Intelligent Information Processing Systems, 2006. 9(2): p. 49-56. Perera, D., J. Kay, I. Koprinska, K. Yacef, and O. Zaiane, Clustering and Sequential Pattern Mining of Online Collaborative Learning Data. IEEE Transactions on Knowledge and Data Engineering, 2009. 21(6): p. 759-772. Tan, P.-N., M. Steinback, and V. Kumar, Introduction to Data Mining. 2006: Pearson Addison Wesley.