Sep 1, 2016 - Far Eastern State University of Transportation, Khabarovsk, Russia. Abstract. Angular intensity distribution of radiation in incident converging ...
Home
Search
Collections
Journals
About
Contact us
My IOPscience
Effect of angular intensity distribution of radiation on a conoscopic pattern of crystal
This content has been downloaded from IOPscience. Please scroll down to see the full text. 2016 J. Phys.: Conf. Ser. 735 012061 (http://iopscience.iop.org/1742-6596/735/1/012061) View the table of contents for this issue, or go to the journal homepage for more
Download details: IP Address: 181.214.69.153 This content was downloaded on 01/09/2016 at 04:24
Please note that terms and conditions apply.
You may also be interested in: On the estimate of effective optical parameters of close-packed fibrillar media D A Zimnyakov, L V Kuznetsova, O V Ushakova et al. Light Extraction from Organic Light Emitting Diode Substrates: Simulation and Experiment Horst Greiner X-Ray Scattering from Liquid Helium J Reekie, T S Hutchison and C F A Beaumont Laser conoscopy of large-sized optical crystals A I Kolesnikov, R M Grechishkin, S A Tretiakov et al. Investigation of a system for beam deflection by means of lithium niobate crystals A L Mikaélyan, M M Koblova and É A Zasovin Diffraction Patterns of Self-Phase-Modulated Laser Beams F. Bloisi, S. Martellucci, J. Quartieri et al. Polarization opticsof GRIN lenses Javier Camacho and Diana Tentori
International Conference of Young Scientists and Specialists "Optics-2015" IOP Publishing Journal of Physics: Conference Series 735 (2016) 012061 doi:10.1088/1742-6596/735/1/012061
Effect of angular intensity distribution of radiation on a conoscopic pattern of crystal O Y Pikoul, L L Kovalenko Far Eastern State University of Transportation, Khabarovsk, Russia Abstract. Angular intensity distribution of radiation in incident converging beam effects on the appearance of a conoscopic pattern of optical crystal. The peculiarities of a «Maltese cross» formation in the conoscopic patterns of optical crystals are considered.
1. Introduction Conoscopic pattern of the crystal is determined by the spatial distribution of differences of course and direction of the vectors E at the output of the crystal in different areas of the cone and becomes visible to the analyzer. 2. Analysis The intensity of radiation in the incident beam Gaussian distribution, that is,
I I0e k
2
, (1) where I0 - intensity of radiation along the axis of the beam; k - coefficient characterizing the radiation intensity distribution in the beam; β - the angle of incidence on the plate. Fig. 1 shows the intensity distribution for the three cases differing in the value of the coefficient k. In the case of k = 0, the intensity of radiation in the beam is distributed uniformly. I/I0, отн. ед.
1 2 3 , град.
Figure 1. The intensity distribution of the radiation in a converging beam. The values of the coefficient k: 1 - 0.0; 2 - 0.05; 3 - 0.1 After passing through the beam of rays converging system consisting of a polarizer, crystal plate and the analyzer, the radiation intensity is given by
I1 I0e k
2
1 (1 cos ) sin 2 2 , 2
(2)
Content from this work may be used under the terms of the Creative Commons Attribution 3.0 licence. Any further distribution of this work must maintain attribution to the author(s) and the title of the work, journal citation and DOI. Published under licence by IOP Publishing Ltd 1
International Conference of Young Scientists and Specialists "Optics-2015" IOP Publishing Journal of Physics: Conference Series 735 (2016) 012061 doi:10.1088/1742-6596/735/1/012061
where Δ - the phase difference between the ordinary and extraordinary rays, which depends on the angle β; φ - the azimuth angle measured, for example, the transmission axis of polarizer (from one of the branches of the "Maltese Cross" in the conoscopic pattern). Equation (2) allows you to build a conoscopic pattern in polar coordinates, putting the angle of incidence β of the radius vector. The angle φ - the azimuth angle (the angle of rotation of the radius vector). Figure 2 shows the conoscopic pattern under certain simplifying assumptions. The black circle correspond to minima conoscopic pattern (Δ = 2πn, where n = 0, 1, 2, ...). If you increase the thickness of the crystal plate diameter of these circles is reduced. When building a "Maltese cross" (figure 2), it was assumed that the boundary of visibility of the picture. That is, the intensity values in the conoscopic picture shown in black; values are shown in white. It is clearly seen that a uniform distribution of intensity on the corner angular width "Maltese cross" is the smallest and does not depend on the values of β (figure 2a). а
c
b
Figure 2. Conoscopic pattern, designed for radiation beams with different angular distribution of intensity. The coefficient k: a - 0; b - 0.05; c - 0.1 The faster decreases the intensity of radiation in a converging angle of the beam, the greater the "Maltese cross" (figure 2b, c). The width and the type of "Maltese cross" does not depend on the thickness of the crystal plate. Calculation of the borders "Maltese cross" is implemented on the basis of the expression (2), converted to the following form: 2 1
sin 2 (I1 / I0e k ) 2 .
(3)
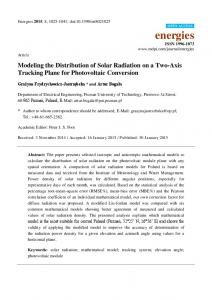
If necessary, by the form "Maltese cross" in conoscopic pattern can be used to evaluate the structure of the convergent beam. The literature indicated the existence of black "Maltese cross" in the conoscopic pattern and light "Maltese cross" [2]. However, the description of the kind of "Maltese cross" at arbitrary angles between the axes of the polarizer and analyzer transmission is omitted. Study changes in the intensity of radiation on the rings-isochromen conoscopic pattern at different positions of the transmission axes of the polarizer and analyzer showed that all the charts there are corners φ, in which all isochromen with different phase shifts have the same intensity. When the polarizer and analyzer are parallel (χ = 0°), there are four such radial directions and are located through 90˚ (figure 3,a). The intensity of izohrom crossing with these directions is the same, that is formed by the light "Maltese cross." When the polarizer and analyzer are crossed, then there are also four such radial direction and they are arranged as through 90˚, but the intensity izohrom in these areas is equal to zero, that is, formed black "Maltese cross" (figure 3, e).
2
International Conference of Young Scientists and Specialists "Optics-2015" IOP Publishing Journal of Physics: Conference Series 735 (2016) 012061 doi:10.1088/1742-6596/735/1/012061 When the angle χ between the axes of the polarizer and analyzer transmission is arbitrary, then there
are 8 of these radial directions in which the intensity izohrom same (figure 3, b, c, d). I 1
χ = 0°
1
0,8
2 3
0,6
(a)
4
0,4
5 6 φ, град.
0,2 0 0
90
180
270
360
I
χ =30º
1
1
0,8
2 3
0,6
(b)
4
0,4
5 6
0,2 0 0
50
100
150
200
250
300
350
I
χ =45º
1 1
2
0,8
3 4 5 1 6
0,6
(c)
φ, degr.
0,4 0,2 0 0
50
100
150
200
250
300
350
1 φ, degr. 1
I
χ =60º
0,4
6 5 4 3 6 26
0,2
16
1 0,8
(d)
0,6
0 0
χ =90º
50
100
150
200
250
300
350
6 degr. φ, 6
I (e)
1
6
0,8
5 4 63 62
0,6 0,4 0,2
61 φ, degr 6 0 90 180 270 360 Figure 3. Conoscopic pattern of lithium iobate (LiNbO3), designed to Maple at 6 0
respective angles between the axes χ transmission polarizer and analyzer. The arrows indicate the "Maltese cross." On the right side - the intensity of the radiation transmitted polarizer - crystal plate - the analyzer angle φ. The values of the phase difference Δ, degrees: 1 - 0; 2 - 45; 3 - 60; 4 - 90; 5 - 135; 6 - 180. 3
International Conference of Young Scientists and Specialists "Optics-2015" IOP Publishing Journal of Physics: Conference Series 735 (2016) 012061 doi:10.1088/1742-6596/735/1/012061
With further increase of the angle between the transmission axes of the polarizer and analyzer highs and lows on the chart are reversed. In all cases, there are four fixed radial direction: 0˚, 90˚, 180˚ and 270˚, forming one fixed "Maltese cross" with a gradually varying intensity. The remaining four radial direction form the second "Maltese cross", which rotates around a fixed cross at an angle corresponding to the angle of rotation of the analyzer. The change in the angle between the polarizer and analyzer from 0˚ to 90˚ leads to the same change in the intensity of both crosses in the range of zero. The intensity in the center of the conoscopic pattern corresponds to the intensity of "Maltese cross." Similar changes, only in reverse order, occur during rotation of the analyzer from a position in which the transmission axis of the polarizer and analyzer are parallel. Bright "Maltese cross" is divided into two cross, the intensity of which gradually decreases, reaching a minimum value at the time of the merger of the two crosses in the dark "Maltese cross" with the axes of the orthogonal transmittance of the polarizer and analyzer. The results of experiment on the "Maltese cross" shown in figure 4. (а)
(d)
(b)
(e)
(c)
(f)
Figure 4. Photos "Maltese cross" on the conoscopic pattern of lithium niobate. The angle between the transmission axes of the polarizer and analyzer, degrees: a - 0; b - 20; c - 30; d - 45; e - 60; f - 90.
4. Conclusion For crystal plate TeO2 (uniaxial gyrotropic crystal) such a change conoscopic pattern while rotating analyzer much more worse. The reason for this is the lack of a "Maltese cross" in the center of the picture due to the optical activity [2, 3]. The peripheral part of the picture, where the branches of "Maltese Cross" there, quickly obscured, making it difficult for observation. 5. References [1] [2]
[3]
Pikoul O, Alekseyeva L, Povkh I et al. 2004 IVUZ. Priborostr. 12 53 Stoiber R and Morse S 1972 Microscopic identification of crystals (New York: The Ronald Press Company) Pikoul O 2010 Appl. Cryst. 43 955
4