ISIJ International, Advance ISIJ Publication International, by Advance J-STAGE,Publication DOI: 10.2355/isijinternational.ISIJINT-2017-688 by J-STAGE ISIJ International, J-Stage Advanced ISIJ International, Publication, ISIJ International, DOI: Advance http://dx.doi.org/10.2355/isijinternational.ISIJINT-2015-@@@ Vol.Publication 58 (2018), No. ISIJ by J-Stage 9International, Vol. 58 (2018), No. 9, pp. 1–9
Effect of Annealing Temperature on the Selective Oxidation and Reactive Wetting of a 0.1C-6Mn-2Si Advanced High Strength Steel During Continuous Galvanizing Heat Treatments Maedeh POURMAJIDIAN and Joseph Robert MCDERMID* McMaster Steel Research Centre, McMaster University, 1280 Main Street West, Hamilton, ON L8S 4L7 Canada. (Received on November 29, 2017; accepted on January 30, 2018; J-STAGE Advance published date: March 23, 2018)
The effects of peak annealing temperature and annealing time on the selective oxidation and reactive wetting of a prototype medium-Mn Fe-0.1C-6Mn-2Si third generation advanced high strength steel were investigated. Annealing heat treatments were carried out in a N2-5 vol% H2 243 K ( − 30°C) dew point process atmosphere at 963 K (690°C) and 1 073 K (800°C) for 120 s and 600 s. TEM observations of the sample cross-sections revealed internal oxidation of the subsurface grains and grain boundaries. EELS results showed that the internal oxide network had a multi-layered structure with SiO2 at the oxide core and MnSiO3 as the surrounding shell; however, MnO was the only species detected at the surface of all samples. The effect of annealing temperature on the surface structure development and its impact on reactive wetting of the substrates annealed for 120 s at both peak annealing temperatures by a Zn-0.20 wt% Al (dissolved) galvanizing bath was also determined. In contrast to the 1 073 K steel, the 963 K substrate showed superior reactive wetting, owing to the much thinner, finer and wider spacing of the MnO nodules on the pre-immersion surface. TEM + EELS analysis of the coated steels showed that infiltration of the bath alloy and partial reduction of MnO resulted in lift-off of the surface oxides and partial formation of Fe2Al5ZnX interfacial layer, indicating that reactive wetting had occurred for the 963 K × 120 s substrate. KEY WORDS: 3G AHSS; selective oxidation; dew point controlled annealing; continuous galvanizing.
layer during dipping, known to be essential for achieving a high quality, adherent zinc alloy coating. It has been reported in several studies that reactive wetting can take place in the galvanizing bath despite the presence of Mn and Si containing oxides on the steel surface.10–16) The formation of the desired Fe2Al5ZnX interfacial layer and complete reactive wetting in these studies has been explained by differences in surface oxide chemistry, thickness and morphology. Furthermore, it has been established that MnO can decompose during immersion in the zinc bath through in-situ aluminothermic reduction.6,15,17) In other cases, reactive wetting of surfaces comprising widely spaced oxide nodules has been reported.13,14,18) It has also been reported that infiltration and lift-off of the oxides by the bath alloy through cracks at the oxide/substrate interface can aid in the reactive wetting process.13,14,19) Thus, the objective of the present study is to quantify the effects of surface oxide morphology, distribution and chemistry on the reactive wetting of a prototype Fe-0.1C-6Mn2Si prototype third generation advanced high strength steel (3G-AHSS) during continuous austenitic and intercritical annealing followed by hot-dip galvanizing.
1. Introduction Medium-Mn advanced high strength steels are amongst the most promising candidates being investigated for future vehicle Body In White (BIW) applications in the automotive industry due to their superior combination of high specific strength and ductility versus the first generation advanced high strength steels (AHSS).1–4) Adoption of these materials has the potential to allow manufacturers to move towards safe, lighter vehicle designs in line with legislated fuel efficiency guidelines.1,5) The corrosion protection of these steels is essential for ensuring the long-term structural integrity of the vehicle and to meet consumer durability expectations, for which the preferred production route is the continuous hot-dip galvanizing process. However, selective oxidation of the main alloying elements envisaged for use in these steels, namely Mn and Si, can cause problems with reactive wetting by the continuous galvanizing zinc alloy bath.6–9) The presence of these thermodynamically stable oxides can prevent the substrate from being reactively wetted by the molten zinc alloy, thus preventing the formation of the desired Fe2Al5ZnX interfacial * Corresponding author: E-mail:
[email protected] DOI: http://dx.doi.org/10.2355/isijinternational.ISIJINT-2017-688
1
© 2018 ISIJ
ISIJ International, Advance Publication by J-STAGE ISIJ International, ISIJ International, Advance Vol.Publication 58 (2018), No. by J-Stage 9
by a 4 s immersion in the galvanizing bath and a final cool to 343 K at − 10 K/s via N2 gas quenching. The simulated galvanizing bath comprised a 50 kg melt containing 0.20 wt% dissolved Al and was Fe saturated.22) In all cases, the sample thermal cycle was controlled via a 0.5 mm type K thermocouple welded directly to the samples. All selective oxidation tests were carried out in triplicate to ensure repeatability of the experimental results, whereas the reactive wetting experiments were run in duplicate due to limited availability of the experimental substrates. Selective oxidation samples were stored in 99.9% purity anhydrous grade isopropanol immediately after removal from the MGS in order to minimize additional oxidation prior to analysis. The galvanized panels were wrapped and stored separately such that the zinc surface was protected from scratches. All material for reactive wetting analysis were cut from the 80 mm × 80 mm uniform temperature and coating area centered 50 mm from the bottom edge of the panel. Surface oxide distribution and morphology was studied using a JEOL 7000F field emission gun scanning electron microscope (FEG-SEM) operated in secondary electron imaging mode with an acceleration voltage of 5 keV. SEM analysis was also performed on the galvanized samples to study the interfacial reaction products. The interfacial layer was exposed by stripping the zinc overlay by two methods: (i) fuming nitric acid (HNO3) and (ii) 10 vol% H2SO4 in water. The latter technique left both the Fe–Zn and Fe–Al intermetallics intact whereas stripping with HNO3 dissolved everything except the Fe2Al5ZnX layer. The surfaces of all SEM samples were coated with C to avoid charging of the specimen during SEM analysis. X-ray photoelectron spectroscopy (XPS) of the selective oxidation samples prior to galvanizing was performed using a PHI Quantera SXM (Scanning XPS Microprobe) using an Al Kα X-ray source (1 486.7 eV). The spot size was 100 μm, the take-off angle was 45°, the pass energy was 140 eV and step size 0.25 eV for all analyses. Elemental depth profiles of the steel surface were obtained by Ar ion sputtering a 2 mm × 2 mm area. All data processing was performed using MultiPak 6.0 software. The obtained binding energies are accurate to ± 0.1 eV and all spectra were calibrated using the metallic iron binding energy of 706.62 eV. Depth measurements are considered to be accurate within ± 10% of the sputtered depth.
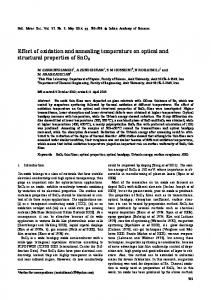
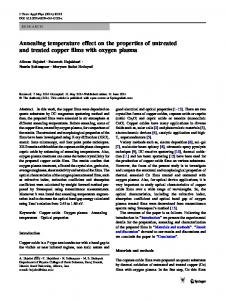
2. Experimental Procedures The chemical composition of the medium-Mn steel is given in Table 1. All substrates were received in the cold rolled condition with a thickness of 1.2 mm. All experiments were carried out in the McMaster Galvanizing Simulator (MGS, Iwatani-Surtec), full details of which are provided elsewhere.20) Two types of samples were cut from the asreceived substrates. Selective oxidation samples comprised of 10 mm × 50 mm coupons such that the rolling direction was parallel to the longitudinal axis of the sample. In the case of the selective oxidation samples only, the sample surfaces were polished with 4 000 grit SiC paper prior to annealing in order to minimize the effects of surface roughness on the subsequent surface analyses. Reactive wetting samples comprised of 120 mm × 200 mm panels with the longitudinal axis perpendicular to the rolling direction. Prior to dipping, these larger panels were degreased in a 353 K (80°C) 2 vol% NaOH solution, rinsed in an stagnant DI water bath followed by a second rinsing step with running DI water, cleaned with isopropanol in an ultrasonic bath and were finally dried with warm air. All samples were cleaned with acetone wipes immediately prior to being loaded in the MGS. Austenitic and intercritical annealing heat treatments were carried out at 1 073 K (800°C) and 963 K (690°C), respectively, in a 243 K ( − 30°C) dew point N2-5 vol% H2 process atmosphere. It should be noted that the 963 K intercritical annealing temperature was chosen to yield equal fractions of intercritical austenite and ferrite. A summary of the corresponding values of process atmosphere oxygen partial pressure (pO2) at each peak annealing temperature (PAT) along with the pH2O/pH2 ratio are provided in Table 2. All of the values listed in Table 2 were derived from the thermodynamic database of Fine and Geiger.21) A schematic of the thermal cycle used for the selective oxidation and reactive wetting tests is shown in Fig. 1. The thermal cycle for the selective oxidation tests comprised heating at 15 K/s to 773 K (500°C), heating at 5 K/s to the PAT, followed by an isothermal hold at the PAT for 120 s and 600 s followed by cooling to 343 K (70°C) at a rate of − 10 K/s using N2 gas quenching. The reactive wetting of the steel substrates by the zinc bath was also explored, where the 120 mm × 200 mm steel panels heat treated at the PAT for 120 s were cooled to the zinc bath temperature of 733 K (460°C) at − 10 K/s, held at 733 K for 10 s to achieve thermal homogeneity through the substrate thickness, followed
Table 1. Chemical composition of the experimental steel (wt%). C
Mn
Si
Al
Mo
Ti
N
S
0.106
6.241
2.023
0.040
0.072
0.011
0.003
0.003
Table 2. Experimental process atmosphere specifications as a function of peak annealing temperature (PAT). PAT
Dew Point
pH 2O/pH 2
pO2 at PAT (atm)
1 073 K (800°C)
243 K (−30°C)
0.00820
4.60 × 10 − 23
963 K (690°C)
243 K (−30°C)
0.00820
8.05 × 10 − 26
© 2018 ISIJ
Fig. 1. Schematic of selective oxidation (dotted line) and hot-dip galvanizing (solid line) heat treatments.
2
ISIJ International, Advance Publication by J-STAGE ISIJ International, ISIJ International, Advance Vol.Publication 58 (2018), No. by J-Stage 9
Due to the relatively low spatial resolution across the sample surfaces available from XPS, direct measurement of the thickness of any external or internal oxide layers as a function of annealing time and PAT was performed using two 10 μm wide trench cuts made through Focussed Ion Beam (FIB) milling using a NVision 40 by Zeiss. W and C coatings were deposited prior to FIB milling in order to protect the surface oxides from damage during Ga-ion milling. It should be noted that the thickness measurements were taken using a grid system at a minimum of 100 locations over the overall 20 μm trench length to ensure representative sampling and increase confidence in the average values of the oxidation zone thicknesses obtained. In the below text, mean oxide thicknesses are reported along with the 95% confidence interval of the mean. High resolution scanning transmission electron microscopy (HR-STEM) on cross-sections of the selective oxidation samples as a function of PAT and annealing time was performed using a FEI Titan 80-300HB TEM operated at 300 keV, where FIB milling was used to prepare the TEM cross-sections. W and C coatings were deposited prior to FIB milling in order to protect the surface oxides from damage during milling. In order to study any wetting reactions at the steel/coating interface and any morphological changes thereon, TEM lift-outs were also taken from as-coated sample cross-sections using FIB milling. Quantitative electron energy loss spectroscopy (EELS) chemical analysis was used during HR-STEM examination of the selective oxidation and galvanized samples using a Gatan Quantum GIF where Digital Micrograph 2.3 software was used to extract elemental maps from the EELS data cubes.
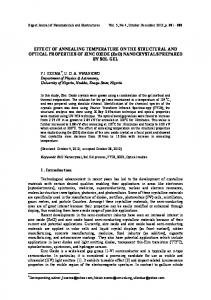
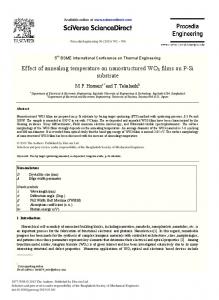
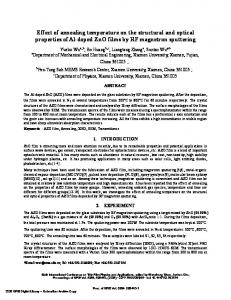
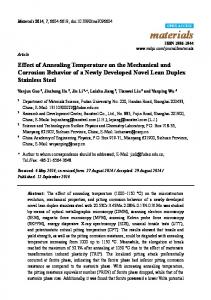
at the 1 073 K PAT due to the faster diffusion rates of both oxygen and the alloying elements at the elevated temperature (Figs. 2(c) and 2(d)). It is worth noting that, after annealing at 1 073 K, the surface of the steel was almost fully covered with a thick, compact external oxide layer for the shorter 120 s hold. In contrast, samples annealed at 963 K for 120 s displayed significant area fractions where thin or no apparent surface oxides could be observed (Figs. 2(a) vs 2(c)). Furthermore, the oxides present after the 963 K treatments had a dispersed nodular morphology in contrast to the compact nodular films formed during the 1 073 K austenitic anneal. The former surface structure is known to be more amenable to reactive wetting,8,18,19) whereas the latter has been shown previously to be detrimental to the promotion of reactive wetting.6,7) Mn and Si XPS elemental depth profiles of the oxidized samples are presented in Figs. 3(a) and 3(b), respectively, as a function of PAT and annealing time. Figure 3(a) shows a considerable surface enrichment of Mn during the annealing heat treatments prior to galvanizing, while only a very thin Si-enriched layer was detected at the surface (Fig. 3(b)). As can be seen from Fig. 3(a), the thickness of the 1 073 K × 600 s Mn-rich surface oxide was significantly greater than the other three experimental conditions, in accordance with the SEM observations of Fig. 2 and the expected time-temperature trends. The effect of peak annealing temperature on the Mn depth profiles for the 120 s annealing time samples does not seem to have been significant based on the XPS results. However, it can be seen that the 600 s annealing
3. Results Secondary electron images obtained from sample surfaces annealed for 120 s and 600 s at the 963 K and 1 073 K PAT are shown in Fig. 2. Coarsening of the surface oxides as a result of extended annealing can clearly be seen from these micrographs (i.e. Figs. 2(a) vs 2(b) and Figs. 2(c) vs 2(d)). This effect was more pronounced for the samples annealed
Fig. 2. Secondary electron images from the surface of the samples annealed under the 243 K dew point atmosphere at (a) and (b) 963 K, (c) and (d) 1 073 K peak annealing temperatures.
Fig. 3. XPS depth profiles of (a) Mn and (b) Si as a function of PAT and annealing time.
3
© 2018 ISIJ
ISIJ International, Advance Publication by J-STAGE ISIJ International, ISIJ International, Advance Vol.Publication 58 (2018), No. by J-Stage 9
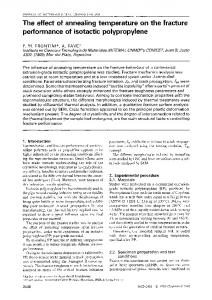
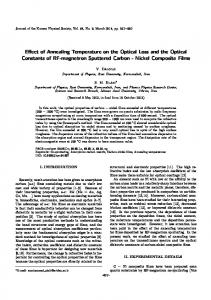
time resulted in a thicker surface Mn oxide for both annealing temperatures. Furthermore, significant Mn enrichment in the subsurface of the 600 s samples at both PATs can be identified from the depth profiles, characterised by Mn contents being greater than the bulk concentration (Fig. 3(a)) to extended depths into the sample. Binding energies were also measured from 5 nm below the steel surface for the O1s, Mn2p3/2 and Mn2p1/2 peaks and these correlated with those reported in the literature for MnO, with values of 530.3 eV, 641.4 eV and 654.1 eV, respectively.23,24) It should be pointed out that the very low signal-to-noise ratio of Si2p peaks did not allow for accurate measurement of the binding energies. Cross-sectional secondary electron FIB (SE-FIB) images of the samples annealed for 120 s at 963 K and 1 073 K are shown in Figs. 4(a) and 4(b), respectively, to detail the thicknesses and morphology of the oxidation zones present in the as-annealed samples prior to immersion in the simulated galvanizing bath. From Fig. 4, it can be seen that both external and internal oxidation zones were present, where zone I is the bulk internal oxidation zone, zone II is the grain boundary internal oxidation zone and the external oxidation zone is demarcated using the annotated arrows. It is apparent from Fig. 4 that the external oxide layer formed for the
1 073 K × 120 s sample was significantly thicker than that formed at 963 K. Using the measurement technique specified above, it was determined that the average external MnO thickness was 44 ± 2 nm and 121 ± 8 nm for the 963 K × 120 s and 1 073 K × 120 s samples, respectively. In the case of the samples annealed for 600 s, it was determined that the external MnO thickness was 105 ± 3 nm for the 963 K PAT and 296 ± 11 nm for the 1 073 K PAT samples. The internal oxide network observed for the 1 073 K × 120 s sample penetrated significantly deeper below the surface in comparison with that of the 963 K × 120 s sample, reaching a depth of 2 μm for the 1 073 K sample versus approximately 0.4 μm for the 963 K sample. As stated above, the internal oxidation network was demarcated into two zones based on the morphology of the oxides observed. Zone I comprised fine, spherical oxides formed immediately in the subsurface both in the bulk grains and on their grain boundaries, while, beneath this region, zone II was associated with a continuous grain boundary oxide network. It should be noted that this difference in external oxide thicknesses for the 120 s samples was not readily apparent from the XPS analysis in Fig. 3(a), given the much lower surface spatial resolution of this technique (i.e. 100 μm spot size in the XPS versus 0.8 nm in the FIB) and also the fact that the presence of internal oxides, as confirmed by Fig. 4, affected the width of the XPS profiles and, therefore, did not allow for an accurate estimation of the external oxide layer thickness. Electron energy loss spectroscopy (EELS) was used in combination with TEM to identify the fine scale microstructure and chemistry of the external and internal oxides present in the as-annealed samples. This data is presented in Figs. 5 through 7 and are representative of all of the annealing conditions studied. Figure 5 shows the Fe, O, Mn and Si EELS elemental maps acquired from an area representative of the external oxide layer along with the zone I internal oxides from the 963 K × 120 s sample. The elemental maps revealed that the surface oxide layer was composed largely of Mn and O, where no significant Si signal was detected. However, the internal oxides showed significant Mn and Si enrichments. This analysis was true for both of the fine circular oxides and the grain boundary oxides. It should be pointed out that the nodular morphology of the external oxides can be clearly identified from the STEM image in this figure. Similarly, EELS elemental maps were acquired from the grain boundary oxide network that was formed in zone II of the samples, per Fig. 4. Figure 6 shows a grain boundary oxide combined with a nearby bulk oxide formed in zone II of a 1 073 K × 600 s sample. The STEM image shows areas with varying contrast within the oxide. From the elemental
Fig. 4. SE-FIB images from the cross-sections of the samples annealed for 120 s at (a) 963 K and (b) 1 073 K revealing the surface oxide configuration and the internal oxide networks.
Fig. 5. DF-STEM image along with EELS elemental maps of Fe, O, Mn and Si, showing the external and zone I internal oxides formed in the sample annealed at 963 K for 120 s. (Online version in color.)
© 2018 ISIJ
4
ISIJ International, Advance Publication by J-STAGE ISIJ International, ISIJ International, Advance Vol.Publication 58 (2018), No. by J-Stage 9
Fig. 6. DF-STEM image along with EELS elemental maps of Fe, O, Mn and Si, showing the cored structure of a grain boundary oxide formed in the sample annealed at 1 073 K for 600 s. (Online version in color.)
Fig. 7. O-K, Mn-L2,3 and Si-K edges electron energy loss spectra acquired from the external and internal oxides from the 1 073 K × 600 s. (Online version in color.)
maps, it can be seen that both the grain boundary and bulk oxides comprised a multi-layer configuration, where Si was enriched at the oxide core while both Mn and Si were present in the outer shell, surrounding the Si-rich core. To quantitatively determine the chemistry of the oxide species present in all of the zones demarcated in Fig. 4, the O, Si and Mn edges of the high-resolution EELS spectra were analysed. Figure 7 presents the O–K, Mn-L2,3 and Si–K edge EELS spectra acquired from the external and internal oxides observed in the 1 073 K × 600 s sample. A comparison of the fine structures observed in the EELS spectra with those available from the literature allowed for an accurate identification of the oxide compositions.25–27) From these spectra, the external oxide was identified as MnO, the outer shell of the grain boundary and bulk internal oxides as MnSiO3 and the oxide cores as SiO2. These findings were consistent for all annealing conditions explored. It should be noted that the EELS spectrum for the external oxide layer correlated well with the XPS binding energy results, confirming that MnO was the external oxide species for all samples. Figures 8(a) and 8(b) show macroscopic views of the uniform temperature and coating area of the as-galvanized steel surfaces for the samples annealed at 963 K and 1 073 K, respectively, under the N2-5H2 (vol%) 243 K dew point process atmosphere. Significant differences were observed in the degree of reactive wetting as a function of the PAT. As can be seen in Fig. 8(a), despite the presence of some minor coating defects, the 963 K × 120 s substrate surface was completely coated with the zinc alloy, while, in contrast to this, no evidence of reactive wetting was observed for the 1 073 K × 120 s steel (Fig. 8(b)). Since no integral Zn coating was obtained for the 1 073 K × 120 s samples, the as-dipped surface was observed under SEM in
Fig. 8. Photographs from the surface of the panels immersed for 4 s in a 0.20wt%Al (dissolved) zinc bath at 733 K after annealing under a 243 K dew point atmosphere at (a) 963 K × 120 s and (b) 1 073 K × 120 s; secondary electron images of the Fe–Zn interface of the (c) 963 K × 120 s sample stripped with fuming HNO3 and (d) as-dipped 1 073 K × 120 s sample.
order to determine the fine-scale surface morphology of this sample post-immersion. In the case of the 963 K × 120 s sample, however, the zinc overlay was stripped using two acid solutions: 10 vol% H2SO4 (in water) and fuming HNO3. No evidence of Fe–Zn intermetallics were observed at the interface after removal of the zinc overlay with the sulfuric acid solution. However, removal of the Zn overlay of the 963 K × 120 s sample using fuming nitric acid revealed the presence of reactive wetting products at the Fe–Zn interface, as shown in Fig. 8(c). In contrast, as can be seen in Fig. 8(d), 5
© 2018 ISIJ
ISIJ International, Advance Publication by J-STAGE ISIJ International, ISIJ International, Advance Vol.Publication 58 (2018), No. by J-Stage 9
a significant amount of oxides were present on the surface of the 1 073 K × 120 s steel after immersion along with some isolated solidified metallic nodules. However, it should be noted that this surface oxide layer was significantly different from that observed prior to immersion, as shown in Fig. 2(c), indicating that some interaction between the external oxide and zinc alloy bath had occurred. Given the fine scale of the features present at the Fe– Zn interface of the post-immersion 963 K × 120 s and 1 073 K × 120 s samples pictured in Figs. 8(c) and 8(d) and in order to determine the underlying mechanisms responsible for the observed differences in reactive wetting behavior of the two substrates, TEM cross-sections were made across the coating/steel interface of the samples by FIB milling. The results of this analysis are shown in Figs. 9 and 10. Figure 9 shows the SE-FIB image of the coating/ steel interface of the 963 K × 120 s steel along with the corresponding TEM + EELS elemental maps. Although no significant change in thickness of the pre-immersion and post-immersion external oxides was found; the post-immersion surface oxide film exhibited a broken-up appearance at some sites. It is interesting to further note that, aside from the surface and subsurface oxides, the interface of the galvanized steel exhibited some nodule-like features, marked by arrows in Fig. 9(a), which did not exist at the oxide/metal interface of this sample prior to immersion (Figs. 4(a) and 5). It also appears that these nodules separated the original external oxide/steel interface such that the surface oxides are at the outer side of them. Figures 9(b) and 9(c) show a higher magnification image of an interfacial nodule along with the corresponding elemental EELS overlays; the colours assigned to each element in the map can be seen in the legend to the right. Quantitative spot analyses were conducted at several points in this fine-scale cross-section and are labeled A through E in Fig. 9(c), where the results of these analyses are documented in Table 3. It was found that the nodules pictured in Fig. 9(a), in fact, correspond to reaction sites with a relatively complex morphology arising from the infiltration of the zinc alloy through the surface oxides and into the underlying steel substrate, which explains the delaminated appearance of the original oxide/steel interface pictured in Fig. 9(a). It is also noteworthy that while Mn and O were present in the oxides within both the bulk steel and those embedded in the infiltrated reaction sites, the surface scale was detected to be an oxygen depleted MnO as the colour overlay map of these areas appeared yellow rather than orange. This finding is further confirmed by the chemical analysis of point A (Fig. 9(c)) in Table 3. It was also observed that in the vicinity of these areas, a strong Al signal was observed, corresponding to the Fe–Al interfacial layer (point B, Table 3). Table 3 lists the chemical compositions that were extracted from the labeled features of Fig. 9(c), which shows that the oxides in point C were likely Mn-silicates and that points D and E correspond to an Fe and Al-enriched Zn alloy. In this case, the higher Fe and Al contents of this phase likely stem from background signals from surrounding Fe–Al intermetallics and the substrate itself. The results of TEM + EELS analysis of the 1 073 K × 120 s sample are presented in Fig. 10. The cross-sectional SE-FIB image in Fig. 10(a) captures an uncoated area with © 2018 ISIJ
Fig. 9. (a) SE-FIB image, (b) DF-STEM image and (c) color overlay EELS map of a nodule-like reaction site formed at the coating/steel interface of the 963 K × 120 s galvanized steel showing different reaction products formed after 4 s immersion in a 0.20wt%Al dissolved zinc bath at 733 K. (Online version in color.)
Fig. 10. (a) SE-FIB image, (b) DF-STEM image and (c) color overlay EELS map of the 1 073 K × 120 s steel after 4 s immersion in a 0.20wt%Al dissolved zinc bath at 733 K showing a zinc droplet and the post-immersion surface oxides at the interface. (Online version in color.) Table 3. Quantitative EELS analysis results corresponding to points A to E in Fig. 9(c) (at%). Point
6
Zn
Al
Mn
O
A
1.6
12.9
42.9
25.1
B
10.1
61.2
2.3
0.0
C
1.8
10.3
17.6
43.7
D
81.6
5.9
1.6
E
62.3
9.3
5.2
Fe
Si
Phase Present
17.5
–
(Mn,Fe) sub-oxide
26.4
–
Fe2Al5Zn
1.8
24.8
Mn–Si oxide
0.0
10.9
–
Zn alloy
0.0
22.3
0.9
Zn alloy
ISIJ International, Advance Publication by J-STAGE ISIJ International, ISIJ International, Advance Vol.Publication 58 (2018), No. by J-Stage 9
identified as MnSiO3 and the inner core as SiO2. It should be noted that the SiO2 core was thicker and the MnSiO3 outer shell thinner with increasing depth into the sample, indicating that the MnSiO3 outer shell grew by consuming the SiO2 core, which formed first and at greater depths into the substrate. These findings were consistent for all annealing conditions studied. The variation of oxide chemistries from surface to subsurface of the steel can be explained by the oxygen available at each region of the sample, the relative thermodynamic stability and solubility of the oxides and the relative diffusivities of the species. Thermodynamic calculations clearly show that all the above-mentioned oxides were stable under the process atmospheres employed in this study. However, SiO2 and MnSiO3 are more thermodynamically stable than MnO – i.e. they have a more negative Gibbs free energy,28,29) while also having a significantly lower solubility product in α-Fe.30) Under such conditions, SiO2 will form first at the grain boundaries; followed by the formation of MnSiO3 in the surrounding shell, driven by the slower diffusion of Mn and the higher thermodynamic stability and lower solubility product of MnSiO3 in α-Fe. At the surface, however, since most of the Si was already bound to the internal oxides and also due to the continuous supply of O from the process atmosphere, the competition between Mn and Si for O was less than in the subsurface, enabling the formation of MnO in the lower Si/Mn ratio environment.9,31) As discussed above, of particular interest was the exploration of the effect of the surface oxide microstructural development in relation to its impact on reactive wetting of the steel by the 0.20 wt% Al (dissolved) continuous galvanizing bath. As was seen in Figs. 8(a) and 8(b), the reactive wetting of the steel was significantly affected by the oxide morphology in the case of the 120 s annealing times. The compact or film-like 121 nm thick MnO layer observed on the external surface of the 1 073 K × 120 s (Figs. 2(c) and 4(b)) showed no significant reactive wetting compared to the 44 nm thick MnO external oxide surface observed on the 963 K × 120 s samples (Figs. 2(a), 4(a) and 5). This result was not unexpected and correlates well with the observations of several authors on the effects of surface oxide chemistry, morphology, distribution and thickness on the reactive wetting mechanisms of TRIP steels.12–14,16,19) For example, it is generally acknowledged that the presence of compact or film-forming oxides, in particular amorphous SiO2 and manganese silicates, are detrimental to the formation of the Fe2Al5ZnX interfacial layer. However, in the case of the external MnO layer observed for all annealing conditions in the present study, it has been shown that MnO can be reduced by Al in the galvanizing zinc bath through aluminothermic reduction.15,17) Based on the kinetic model proposed by Kavitha and McDermid,17) it is expected that MnO layers with a thickness less than 85 nm can be aluminothermically reduced during a 4 s immersion in a 0.20 wt% Al (dissolved) galvanizing bath. Thus, the widely spaced 44 nm external MnO on the 963 K × 120 s sample could be reduced by the bath whereas the thicker 121 nm compact morphology of the 1 073 K × 120 s sample could not. This assertion is a partial explanation to the reactive wetting differences observed, and is further supported by the changes in the interfacial microstructures observed,
a solidified zinc droplet on the surface of the sample. The high magnification STEM image and EELS overlay map shown in Figs. 10(b) and 10(c) were acquired from the edge of the droplet in Fig. 10(a). It can be seen that underneath the zinc droplet, a relatively thick, continuous external Mn oxide layer remained at this interface as these oxides appear orange rather than yellow, as would be the case for reduced Mn-oxides. Furthermore, inspection of the EELS spectra of these oxides determined that they were comprised of MnO. A detailed discussion of these findings is provided in the following section. 4. Discussion As shown in the SEM images from the as-annealed steel surfaces (Fig. 2), significant external oxide coverage was observed for all combinations of annealing temperature and time, where the oxides coarsened with increasing holding time at both annealing temperatures. The measured XPS binding energies corresponded with those of MnO.23,24) This analysis was in agreement with the EELS spectra (Fig. 7) of the surface oxides, allowing for the conclusion that the external oxide species was MnO for all annealing conditions explored. From the SEM images, it can also be seen that the 600 s annealing time samples (Figs. 2(b) and 2(d)) had almost complete external MnO coverage. However, further examination of Fig. 2 will show that the 963 K × 120 s surface (Fig. 2(b)) comprised a more widely spaced, nodular morphology with thinner oxides in between versus its 1 073 K × 120 s counterpart. Furthermore, it can also be observed that the 963 K oxides (Figs. 2(a) and 2(b)) were significantly finer than their 1 073 K PAT equivalents. Cross-sectional SE-FIB images (Fig. 4) along with TEM + EELS elemental analysis (Figs. 5 and 6) provided a more detailed understanding of both the external and internal oxide chemistries and morphologies. The depth of internal oxidation was observed to be significantly higher for the 1 073 K × 120 s sample (approximately 2 μm) versus the 963 K × 120 s sample (approximately 0.4 μm). It was also determined that the external MnO layer for the 1 073 K × 120 s sample had almost triple the thickness of that of 963 K × 120 s sample, with an average thickness of 121 nm versus 44 nm. This thicker external oxide layer observed for the samples annealed at 1 073 K was expected considering the exponentially higher diffusivities of both oxygen and the alloying elements at the higher temperature in combination with a process atmosphere oxygen partial pressure that was three orders of magnitude higher at 1 073 K (Table 2). The latter also explains the increased depth of internal oxidation of the 1 073 K × 600 s sample. It should be mentioned that the average thickness of the external MnO layer for the 1 073 K × 600 s and 963 K × 600 s samples, were determined to be 296 nm and 105 nm, respectively, having a similar thickness ratio to the 120 s samples. EELS studies also provided insight into the chemical nature and microstructural characteristics of the internal oxides. As can be seen from the elemental maps in Figs. 5 and 6 and the EELS analysis in Fig. 7, the bulk internal and grain boundary oxides formed in zones I and II (Fig. 4) comprised a core-shell structure, where the outer shell was 7
© 2018 ISIJ
ISIJ International, Advance Publication by J-STAGE ISIJ International, ISIJ International, Advance Vol.Publication 58 (2018), No. by J-Stage 9
post dipping, for both samples, presented in Figs. 8 to 10. The SEM image in Fig. 8(d) shows evidence of an altered, yet still present, compact oxide layer on the surface of the 1 073 K × 120 s sample and the cross-sectional TEM + EELS analysis of this interface (Fig. 10) clearly confirmed that the external MnO, formed prior to immersion, continued to be present at the Zn/steel interface post-immersion. Although the thickness of this external MnO layer seemed to have been reduced locally and become more faceted versus its as-annealed morphology (Fig. 4(b)), the morphology of the layer remained continuous. This continuous, film-like MnO layer did not allow for an intimate contact between the underlying substrate and the galvanizing bath, thereby preventing Fe dissolution from the strip and the formation of the desired Fe2Al5ZnX reactive wetting product at the Zn/ substrate interface. In contrast to this poorly wetted sample, the coating/ substrate interface of the 963 K × 120 s sample (Fig. 8(c)) exhibited non-continuous surface oxides and ample evidence of a variety of reactive wetting products. As can be seen from Figs. 8(c) and 9 and the quantitative chemical analysis results in Table 3, Fe–Al interfacial products (point B, Fig. 9(c) and Table 3) were present at the interface suggesting the occurrence of reactive wetting and the dissolution of Fe from the sample surface arising from direct contact between the substrate and the Zn alloy bath. From Fig. 9(a), it can be seen that the Zn-alloy penetrated through the original external MnO layer (Figs. 4(a) and 5) to reactively wet the underlying substrate and separated the oxides along the external oxide/substrate interface. No significant change in the thickness of the surface oxides pre and post-immersion could be detected; however, the postimmersion external oxide layer does appear broken-up and discontinuous at some locations (Figs. 4(a) and 5 vs Fig. 9(a)). It is likely that penetration of the external MnO layer occurred in such places, where the original MnO film was very thin and could be reduced (Fig. 9(c)). Furthermore, Mn-rich regions, labeled as A, were identified on the outer side of the nodule-like reaction site in Fig. 9(c). Quantitative chemical analysis of point A (Table 3) showed that the O content at these yellow sites was less than what was expected for an MnO compound, indicating that these sites had been at least partially reduced. In addition, considerable amounts of Al and Fe were also found in the composition of point A, likely arising from the nearby Fe2Al5ZnX reaction products. It should be noted, however, that the Fe2Al5ZnX phase was only partially formed at the interface as opposed to full interfacial layer formation, consistent with SEM analysis of the surface of this sample shown in Fig. 8(c). It is also noteworthy that the infiltrated zinc area exhibited fine internal oxides embedded in it; these are labeled as C and showed significant amounts of O, Mn and Si in their composition consistent with the TEM + EELS results of the pre-immersion internal oxides. Quantitative results from points D and E, corresponding to the nodule-like reaction sites marked in Fig. 9(c), showed that these regions were primarily enriched in Zn, which supports the infiltration mechanism proposed earlier; however, substantial amounts of Fe were also found in the composition of these sites. It should be recalled that no evidence of Fe–Zn intermetallic phases was found through © 2018 ISIJ
SEM analysis of the steel/coating interface stripped with sulfuric acid. Additionally, the morphology of these sites (points D and E) does not correspond to those known for Fe–Zn compounds. It is concluded that the background Fe signal from the steel substrate contributed significantly to the quantitative analysis of these points. In the present system, it was determined that internal oxidation occurred when employing the process atmosphere oxygen partial pressures associated with the 243 K ( − 30°C) dew point process atmospheres. Shifting the oxidation mode from external to internal very likely reduced the thickness of the external oxides observed in the present system and promoted the development of a thinner, widely spaced external oxide morphology and likely also shifted the dominant external oxide from Mn-silicates to MnO.9,30) This shift in oxide distribution and morphology was likely key to the promotion of reactive wetting by the galvanizing bath in the case of the 963 K × 120 s samples, as documented in Figs. 8 and 9. However, it should be noted that the use of internal oxidation was not able to fully shift the resultant morphology of the external oxide layer in the case of the 1 073 K × 120 s samples such that they could be reactively wetted and, therefore, it must be concluded that the use of internal oxidation to promote reactive wetting must be combined with a careful assessment of the resultant morphology due to kinetic factors. Given the above discussion, it is concluded that several mechanisms were responsible for the successful reactive wetting obtained in the case of the 963 K × 120 s substrate. As the pre-immersion surface oxides of this sample comprised a fine and widely-spaced nodule-like structure with thinner oxides between them, during immersion in the Zn(Al,Fe) bath, the liquid alloy could penetrate into the steel substrate, lifting up the surface oxides, while simultaneously the 44 nm thick external MnO layer was fully or partially reduced through aluminothermic reduction. Both of these mechanisms would expose the underlying substrate to dissolution15,17) and the observed formation of the Fe2Al5ZnX layer at the interface. In contrast to the 963 K × 120 s sample, the 1 073 K × 120 s sample possessed a thicker, more compact external oxide which could not be aluminothermically reduced in the bath and which did not allow direct contact between the Zn(Al,Fe) bath and the steel substrate, an essential step in the formation of the Fe2Al5Zn and the reactive wetting process. Thus, it can be globally concluded that the differences in external oxide morphology and thickness were the primary factors in determining the reactive wetting – or lack thereof – in the present medium-Mn alloy system. 5. Conclusions The morphology, thickness and distribution of the oxides formed on the surface of the 0.1C-6Mn-2Si steel under the 243 K dew point process atmosphere were strongly affected by the peak annealing temperature. Annealing for 120 s at 1 073 K resulted in formation of a thick, compact and filmlike oxide layer covering the entire steel surface; while for the 963 K anneal the surface oxides comprised a widely spaced, fine nodular morphology with an external oxide layer thickness one third of that of the 1 073 K anneal. 8
ISIJ International, Advance Publication by J-STAGE ISIJ International, ISIJ International, Advance Vol.Publication 58 (2018), No. by J-Stage 9
The external oxides present for all annealing temperatures and times were composed of MnO, as confirmed by both XPS and TEM + EELS analyses. However, a considerable increase in the surface Mn enrichment was observed with increasing annealing time and temperature. All samples demonstrated internal oxidation, with the maximum depth of internal oxidation zone reaching to 4 μm in the sample annealed for 600 s at 1 073 K. EELS results showed that the internal oxide network had a multi-layer structure with SiO2 at the oxide core and MnSiO3 as the surrounding shell. Successful reactive wetting of the 963 K × 120 s substrate by the Zn-0.20 wt% Al (dissolved) galvanizing bath was attributed to the much finer morphology and wider spacing of the 44 nm-thick nodules formed at the surface of this sample prior to immersion. During immersion, this surface oxide structure facilitated progression of the wetting reactions through several mechanisms such as aluminothermic reduction of the surface MnO and infiltration of liquid bath into the substrate which resulted in lift-off of the surface oxides. In contrast, very poor reactive wetting was observed for the 1 073 K × 120 s sample due to the pre-immersion surface structure that was fully covered by a relatively coarse, compact and 121 nm-thick oxide layer which did not allow for contact between the underlying substrate and the bath alloy, thereby preventing Fe dissolution from the substrate and the precipitation of the desired Fe2Al5ZnX reactive wetting product.
REFERENCES 1) 2) 3) 4) 5) 6) 7) 8) 9) 10) 11) 12) 13) 14) 15) 16) 17) 18) 19) 20)
Acknowledgements This work was financially supported by the Natural Sciences and Engineering Research Council of Canada (NSERC) and Stelco Inc. through the NSERC/Stelco Industrial Research Chair in Advanced Coated Steels. U.S. Steel Research is gratefully acknowledged for their provision of the experimental steels. The authors would like to thank John Thomson and Ray Fullerton at the McMaster Steel Research Centre for their technical support with the galvanizing simulations, Dr. Li Sun at ArcelorMittal Dofasco for assistance with the XPS analyses and Dr. Andreas Korinek of the Canadian Centre for Electron Microscopy (CCEM) for technical and scientific assistance with electron energy loss spectroscopy.
21) 22) 23) 24) 25) 26) 27) 28) 29) 30) 31)
9
D. W. Suh and S. J. Kim: Scr. Mater., 126 (2017), 63. M. J. Merwin: Mater. Sci. Forum, 539 (2007), 4327. M. J. Merwin: Iron Steel Technol., 5 (2008), 66. R. L. Miller: Metall. Mater. Trans. B, 3 (1972), 905. K. M. H. Bhadhon, J. R. McDermid and F. E. Goodwin: Proc. 10th Int. Conf. on Zinc and Zinc Alloy Coated Steel Sheet (Galvatech 2015), AIST, Warrendale, PA, (2015), 936. P. Drillet, Z. Zermout, D. Bouleau, J. Mataigne and S. Claessens: Proc. 6th Int. Conf. on Zinc and Zinc Alloy Coated Steel Sheet (Galvatech 2004), AIST, Warrendale, PA, (2004), 1123. J. Mahieu, B. C. De Cooman, J. Maki and S. Claessens: Iron Steelmaker, 29 (2002), 29. I. Hashimoto, K. Saito, M. Nomura, T. Yamamoto and H. Takeda: Tetsu-to-Hagané, 89 (2003), 31. Y. Suzuki, Y. Sugimoto and S. Fujita: Tetsu-to-Hagané, 93 (2007), 489. L. Cho, S. J. Lee, M. S. Kim, Y. H. Kim and B. C. De Cooman: Metall. Mater. Trans. A, 44A (2013), 362. L. Cho, M. S. Kim, Y. H. Kim and B. C. De Cooman: Metall. Mater. Trans. A, 44A (2013), 5081. R. Sagl, A. Jarosik, D. Stifter and G. Angeli: Corros. Sci., 70 (2013), 268. E. M. Bellhouse and J. R. McDermid: Metall. Mater. Trans. A, 41A (2010), 1539. E. M. Bellhouse and J. R. McDermid: Metall. Mater. Trans. A, 42A (2011), 2753. R. Khondker, A. Mertens and J. R. McDermid: Mater. Sci. Eng. A, 463 (2007), 157. E. M. Bellhouse and J. R. McDermid: Mater. Sci. Eng. A, 491 (2008), 39. R. Kavitha and J. R. McDermid: Surf. Coat. Technol., 212 (2012), 152. Y. Tobiyama and C. Kato: Tetsu-to-Hagané, 89 (2003), 38. R. Sagl, A. Jarosik, G. Angeli, T. Haunschmid, G. Hesser and D. Stifter: Acta Mater., 72 (2014), 192. E. M. Bellhouse and J. R. McDermid: Metall. Mater. Trans. A, 43A (2012), 2426. H. A. Fine and G. H. Geiger: Handbook on Material and Energy Balance Calculations in Metallurgical Processes, The Metallurgical Society of AIME, Warrendale, PA, (1979), 428. J. R. McDermid, M. H. Kaye and W. T. Thompson: Metall. Mater. Trans. B, 38B (2007), 215. B. R. Strohmeier and D. M. Hercules: J. Phys. Chem., 88 (1984), 4922. M. C. Biesinger, B. P. Payne, A. P. Grosvenor, L. W. M. Lau, A. R. Gerson and R. St. C. Smart: Appl. Surf. Sci., 257 (2011), 2717. A. P. Grosvenor, E. M. Bellhouse, A. Korinek, M. Bugnet and J. R. McDermid: Appl. Surf. Sci., 379 (2016), 242. P. L. Potapov, K. Jorissen, D. Schryvers and D. Lamoen: Phys. Rev. B, 70 (2004), 045106-1. H. Tan, J. Verbeeck, A. Abakumov and G. Van Tendeloo: Ultramicroscopy, 116 (2012), 24. L. Cho, S. J. Lee, M. S. Kim, Y. H. Kim and B. C. De Cooman: Metall. Mater. Trans. A, 45A (2014), 5158. X. S. Li, S. I. Baek, C. S. Oh, S. J. Kim and Y. W. Kim: Scr. Mater., 57 (2007), 113. D. Huin, P. Flauder and J. B. Leblond: Oxid. Met., 64 (2005), 131. M. Auinger, V. G. Praig, B. Linder and H. Danninger: Corros. Sci., 96 (2015), 133.
© 2018 ISIJ