Vol. 82: 111–127, 2018 https://doi.org/10.3354/ame01889
AQUATIC MICROBIAL ECOLOGY Aquat Microb Ecol
Published online November 2
OPEN ACCESS
Effect of anthropogenic warming on microbial respiration and particulate organic carbon export rates in the sub-Antarctic Southern Ocean E. L. Cavan1,*, P. W. Boyd1, 2 1
Institute for Marine and Antarctic Studies, and 2Antarctic Climate and Ecosystems CRC, University of Tasmania, 20 Castray Esplanade, Battery Point, 7004 Tasmania, Australia
ABSTRACT: Microbial respiration of particulate organic carbon (POC) is one of the key processes controlling the magnitude of POC export from the surface ocean and its storage on long timescales in the deep. Metabolic processes are a function of temperature, such that warming sea temperatures should increase microbial respiration, potentially reducing POC export. To investigate this in the Southern Ocean, we measured microbial oxygen consumption of large particles over a 10°C temperature range (summer maximum + 8°C) to then estimate the decrease in export by 2100. Our results showed that POC-normalised respiration increased with warming. We estimate that POC export (scaled to primary production) could decrease by 17 ± 7% (SE) by 2100, using projected regional warming (+1.9°C) from the IPCC RCP 8.5 (‘business-as-usual’ scenario) for our subAntarctic site. Increased microbial respiration is one of many processes that will be altered by future climate change, which could all modify carbon storage in the future. Our estimate of the potential decline in carbon sequestration is within previous estimates from lab and field experiments, but higher than simple mechanistic models. To explore our results further, we used the metabolic theory of ecology (MTE) to determine the activation energy of microbial respiration, which was 0.9 eV. This is higher than classical MTE (0.6−0.7 eV), suggesting that sub-Antarctic microbes are particularly sensitive to temperature change. Such regional characteristics in the response of organisms to increased temperatures should be accounted for in large-scale or global model analyses to ensure that the results do not underestimate microbial responses to warming. KEY WORDS: Particulate organic carbon · Export · Microbes · Respiration · Metabolic theory of ecology
INTRODUCTION The ocean’s biological pump transfers 5−15 Gt C yr−1 of particulate organic carbon (POC) from the surface to the deep ocean globally, where it can be stored on long (100s−1000s of years) timescales (Volk & Hoffert 1985, Falkowski et al. 1998). As biogenic particles sink through the water column, they are subjected to intense remineralisation by heterotrophic bacteria and zooplankton (Steinberg et al. 2008, Cavan et al. *Corresponding author:
[email protected]
2017a). Bacterial respiration (a proxy for remineralisation) integrated over the upper 1000 m is typically 4- to 7-fold higher than zooplankton respiration, as bacteria are present throughout this entire depth range, whereas zooplankton are largely restricted to certain depth strata, typically in the upper mesopelagic (Steinberg et al. 2008, Giering et al. 2014). Particle remineralisation (e.g. respiration) and sinking rates together control the attenuation of POC with depth (Boyd & Trull 2007). Oceanic microbial © The authors 2018. Open Access under Creative Commons by Attribution Licence. Use, distribution and reproduction are unrestricted. Authors and original publication must be credited. Publisher: Inter-Research · www.int-res.com
112
Aquat Microb Ecol 82: 111–127, 2018
(including bacteria and protistan zooplankton) respiration is therefore one of the key regulators in determining the magnitude of POC that is sequestered under present-day ocean conditions. Temperature exerts important controls on the biological pump (Marsay et al. 2015), as it (1) influences the phytoplankton community composition and thus ballasting of POC export and flux (Francois et al. 2002, Henson et al. 2012), (2) helps set the efficiency of POC export from the surface ocean (Laws et al. 2000, Cael & Follows 2016), (3) determines sinking rates (Bach et al. 2012, Iversen & Ploug 2013) and (4) controls metabolic functions (Boltzmann 1872, Arrhenius 1889) that act to remineralise the POC, such as respiration and grazing rates. Future changes in ocean temperature will affect the magnitude of POC export due to altered rates of particle settling and heterotrophic POC degradation (Iversen & Ploug 2013). In this study, we focussed specifically on the role of temperature on microbial heterotrophic POC respiration. Increased respiration caused by future warming may decrease the export of POC from the surface waters and hence carbon sequestration to the deep oceans and sediments. Many experimental studies have investigated the effect of warming on marine microbes, mostly bacteria, such as in upper ocean Arctic and temperate mesocosm studies, which have shown increased bacterial respiration, growth rates and biomass with warming (Hoppe et al. 2008, Lara et al. 2013). Deeper in the mesopelagic zone (300−600 m), bacterial respiration and production also increased with temperature (Mazuecos et al. 2015). Such reports of increased microbial activity are either due to the metabolic response of bacteria to warming and/or the enhanced release of dissolved organic carbon (DOC) from phytoplankton at higher temperatures (Hutchins et al. 2017). Nevertheless, the relationship between temperature and metabolic rates is not straightforward in marine microbes, since substrate availability strongly affects their response to changes in temperature (Aguiar-González et al. 2012, Arandia Gorostidi et al. 2017, Maske et al. 2017). Furthermore, a review study using the metabolic theory of ecology (MTE) showed that bacteria and protistan metabolic processes exhibit a different response to changing body mass compared to more evolved organisms (DeLong et al. 2010). The long-established MTE links metabolic rates to temperature and body size, such that rates of all organisms scale in the same way via the following equation (Arrhenius 1889, West et al. 1997, Gillooly et al. 2001, Brown et al. 2004):
ln(I M −0.75) = −Ea(1/cT ) + ln(i0)
(1)
where I is the metabolic rate normalised by biomass (M ), Ea is the activation energy, c is Boltzmann’s constant (0.862 × 10⁻⁵ eV K−1), T the temperature in Kelvin, and i0 is a normalisation constant. Ea is the minimum energy needed to result in a chemical reaction (Clarke & Johnston 1999, Yvon-Durocher et al. 2012), and MTE states that all organisms should have an Ea of 0.6−0.7 eV (Gillooly et al. 2001, Brown et al. 2004). An Ea higher than 0.6−0.7 eV suggests that organisms or communities are more sensitive to changes in temperature (Clarke & Johnston 1999), as is the case for mesopelagic bacteria which can exhibit an Ea of 0.9 eV (Mazuecos et al. 2015). In this study, we used MTE to determine the microbial Ea to allow us to make projections on the response of subAntarctic microbes to future warming and identify how the metabolism of these microbes subsequently affects the flow of carbon in the upper ocean (Schramski et al. 2015). Whilst relatively simple to apply, MTE is based on fundamental physical and chemical principles to understand and predict fluxes of energy and matter through individuals and ecosystems (Yvon-Durocher et al. 2010a, Schramski et al. 2015). To our knowledge, MTE has not been applied to the biological pump, and thus our study is the first to experimentally apply MTE in the context of sinking organic particles. Our primary objective was to determine the effect of increasing temperatures on microbial remineralisation of sinking POC, in the context of carbon export and the biological pump and predict these rates for the year 2100. A secondary objective was to identify the temperature sensitivity of sub-Antarctic microbes by calculating the Ea of mass-normalised microbial respiration by applying MTE to our results. We hypothesised that warming will increase microbial respiration, reducing POC export to the mesopelagic. We tested this experimentally by measuring the relationship between microbial oxygen consumption of large, organic, carbon-rich particles and temperature in the sub-Antarctic Southern Ocean (Fig. 1).
MATERIALS AND METHODS Study site and sampling Sampling took place at the Southern Ocean Time Series (SOTS) site (46° S, 141° E, Fig. 2a) in the subAntarctic southwest of Tasmania (Australia), from 20−26 March 2017 onboard RV ‘Investigator’ (Table 1).
Cavan & Boyd: Effect of temperature on carbon export
113
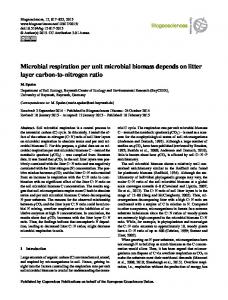
Fig. 1. Microbial processes during POC remineralisation: disaggregation, solubilization and respiration and proportions of mixed layer POC and DOC. Organisms such as nauplii (red organism) can physically disaggregate POC, increasing the POC surface area allowing bacterial colonisation. Bacteria solubilise POC to DOC, and then respire DOC to dissolved inorganic carbon (DIC), the final process in POC remineralisation. All of these processes require energy contributing to heterotrophic oxygen consumption. POC concentration was 5–35× higher in our vials than in situ, such that the substrate (POC) did not become limiting during the incubations. Mixed layer, autotrophic biomass only contributes to 50% of mixed layer POC, the remainder being heterotrophic, with a very small detrital fraction (Furuya 1990, Boyd et al. 1995, Strzepek et al. 2005). Mixed layer DOC is mostly refractory, with a small proportion being semi-labile and a minute fraction being labile (Carlson & Ducklow 1995, Aminot & Kérouel 2004). The particle and nauplii images were taken from samples (Net 2) from this study
The site is within a high-nutrient/low chlorophyll (HNLC) region where microbes are considered particularly important in carbon cycling (Manganelli et al. 2009), as low chlorophyll concentrations and low rates of primary production can reduce grazer abundance. A conductivity-temperature-depth sen-
a)
sor package mounted on a rosette frame was deployed to measure upper ocean properties (Fig. 2b). Mean aqua MODIS chlorophyll a (chl a) satellite data for the month of March 2017 were used to derive surface chl a concentrations at the SOTS site and the surrounding waters (Fig. 2a).
POC (µg l–1)
Chl a (µg l–1) 2
0
b)
20
40
60
80
100
120
0 100
44° 1
Depth (m)
42° S
200 300
46° 400 48°
b z*
500 0 140° E
145°
8
10
12 Temp. (°C)
34.0
34.5
Salinity
35.0
14 35.5
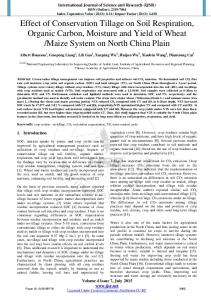
Fig. 2. Water column properties at the Southern Ocean Time Series (SOTS) site. (a) Mean satellite-derived chlorophyll a from MODIS satellite data for March 2017. Red dot represents SOTS in relation to Tasmania (grey-shaded land mass). No data (white shading) is due to cloud cover. (b) Temperature (red line), salinity (blue line) and particulate organic carbon (POC) concentration (black lines and symbols, collected using in situ pumps) through the upper 500 m at SOTS. Error bars are SEM (n = 3). The solid black line is a fitted power function with the exponent b (p < 0.001, r2 = 0.88) and the dashed black line is a fitted exponential function with the exponent z* (p < 0.01, r2 = 0.63), both describing the long-term (assuming steady state) attenuation of POC with depth
Aquat Microb Ecol 82: 111–127, 2018
114
Table 1. Locations and times of plankton net deployments and the temperature settings of the 3 incubations per net deployment in 2017. Time is given in local time (Australian Eastern Time). See Fig. S1 in the Supplement at www.int-res.com/ articles/suppl/a082p111_supp.pdf for an image of the net Net 1 2 3 4 5
Date (dd/mm)
Time (h)
Latitude (°S)
Longitude (°E)
Temp. (°C)
21/03 23/03 24/03 25/03 26/03
20:30 18:00 12:30 12:00 10:00
46.73 46.60 46.08 46.05 45.92
141.93 141.93 142.29 142.18 142.25
12, 17, 19 12, 16, 21 12, 15, 22 12, 18, 20 12, 14, 15
POC concentration Six in situ pumps (ISPs, McLane) were deployed twice during the voyage at 30, 70, 100, 150, 300 and 500 m to obtain samples for POC analysis. The ISPs were deployed for 2 h with 142 mm diameter QMAquartz (2.2 µm pore size) filters (pre-combusted, 400°C). Water (200−1000 l) was pumped through the filters depending on the particulate stocks at each depth; hence the volume filtered increased with depth. On return to deck, the large QMA filters were removed, subsampled by punching 3 (replicate) 13 mm holes through each filter. These 3 subsamples were then dried and stored until their return to land. In the laboratory, the dried subsampled 13 mm filters were placed into silver cups (Elemental Microanalysis), and 20 µl of 2N HCl Suprapur were added to each cup. The cups were put in a fuming bell overnight to remove inorganic carbon and then dried at 60°C for 2 d. The cups were pelleted, and C was then analysed on a CHN analyser (Thermo Finnigan EA 1112 Series Flash Elemental Analyser).
Particle collection To measure microbial oxygen consumption associated with large particles, the particles (the substrate) need to be in high concentration to get a significant signal (del Giorgio 1992, Amon & Benner 1996, Boyd et al. 2015). As the SOTS site is in the HN LC subAntarctic waters, particle collection and concentration by conventional methods (such as pre-concentration by settling [Cavan et al. 2017b], or enhancing particle collision in roller tanks [Ploug et al. 2008]) did not produce a high enough particle concentration for oxygen consumption incubations. Therefore, we deployed a plankton net (200 µm mesh, see Fig. S1 in
the Supplement at www.int-res.com/articles/suppl/ a082p111_supp.pdf), originally designed to sample under sea ice at discrete depths (Fukuchi et al. 1979). The net consists of a plastic tube with a motor driving a propeller at one end directing particles into a short (1 m length) net with a cod-end attached (Fig. S1). The plankton net was deployed to a depth of 30 m within the surface mixed layer for 10 min on 5 different days during the voyage (Table 1). This sampling resulted in a higher (5−35×) concentration of particles than would be found in situ because particle collision, hence aggregation, was enhanced due to lateral movement of water through the net.
Particle incubations for microbial oxygen consumption measurements The plankton net was rinsed with seawater from the filtered underway system on the vessel to remove particles from the mesh and to capture them in the cod-end. The cod-end was removed and any large (non-microbial, > 200 µm) zooplankton ‘swimmers’ were manually picked out of the sample. Here, we classify respiring microbes as all non-visible ( 0.05). At the end of the experiment, the contents of each vial were filtered through a pre-combusted (overnight, 400°C) QMA-quartz filter, dried and then stored at room temperature until subsequent elemental analysis. On return to the laboratory, these QMA filters were prepared and processed for POC analysis as above. The oxygen consumption rates were converted from µmol l−1 h−1 to µmol h−1 by multiplying by the volume of the vials (0.02 l), and then the POC mass within each vial was converted from µg to µmol. To compute the POC turnover rate, the oxygen consumption needs to be normalised to the mass of respiring heterotrophs in the vials. We do not have data from the voyage to tease apart the relative proportion of heterotrophs to total POC in the mixed layer, and therefore our vials. POC in the mixed layer is formed of autotrophic, heterotrophic and detrital POC; therefore, the mass of both living autotrophic and detrital POC is needed to determine heterotrophic biomass (Fig. 1). Here we used data from Strzepek et al. (2005), which represent the state of the art on estimating biotic carbon stocks based on ~8 d occupation of an SF6-labelled patch (~200 km2) of the HN LC subAntarctic ocean at 46° S, i.e. the same latitude as our study site, south of New Zealand in summer. During the study by Strzepek et al. (2005), the various components of the POC pool were assessed on a daily basis within a quasi-Lagrangian framework. The authors showed that throughout the 8 d, heterotrophs consistently formed 50% of the total living POC biomass within the mixed layer (Fig. S3). S. Nodder (unpubl. data) found that total POC in the mixed layer from the same water mass as in Strzepek et al. (2005) was 12 µM. The total living (auto- + heterotrophic) POC measured by Strzepek et al. (2005) was 11.7 µM, showing that the detrital component is negligible in the mixed layer. This was also confirmed in the NE Pacific HNLC region by Boyd et al. (1995). Therefore, we assumed that heterotrophic biomass was 50% of POC mass in the vials and thus divided our POC mass by 2 to compute the non-heterotrophic (autotrophic + detrital) POC turnover by microbial heterotrophs: k (d−1) = oxygen consumption (µmol h−1) / (POC mass [µmol]/2) × 24
(2)
with the turnover rate (k) being expressed as a rate per day, not per hour, to allow comparisons with other studies.
116
Aquat Microb Ecol 82: 111–127, 2018
To compute k, we assumed a respiratory quotient of 1 mol O2 to 1 mol of CO2 following Trimmer et al. (2012), as in marine habitats the ratio of O2:CO2 is ~1.03:1 (Canfield et al. 1993) but can range from 0.8− 1.2 (Glud 2008). Two incubations (at 18 and 20°C) produced anomalously high (i.e. + 2 SD above the mean) k values of 4.9 and 11 d−1. Both of these were from net deployment 4, so all k values from this sample were removed from subsequent analysis. The control incubation at 12°C of net deployment 4 also resulted in the highest k values for that temperature (mean for net deployment 4 at 12°C = 0.65, mean across all nets at 12°C = 0.40). Microbial communities and activities are largely invariant from day to day in HNLC regions during summer (Strzepek et al. 2005; Fig. S3) and thus we cannot explain the high k values. These high POC turnover results would have further increased the slope between temperature and k, and thus our estimates of future microbial respiration. Removing these data reduced the number of microbial POC turnover rates calculated from 40 to 31.
tation, which is important, as metabolic reactions, such as respiration, are and can become substrate limited (Clarke 2006, López-Urrutia 2008, Arandia Gorostidi et al. 2017). During long incubations (days or weeks) if the substrate becomes limiting, a non-linear relationship persists between oxygen concentration and time. In this instance, the linear MTE is not appropriate and an enzyme kinetic model, which accounts for substrate, should be used (Aguiar-González et al. 2012). In addition, high concentrations of substrate are needed to observe a detectable signal of oxygen consumption (Cavan et al. 2017b). The oxygen consumption measured in the vials would have resulted from the following energyconsuming transformations of POC: heterotrophic mechanical disaggregation to smaller particles (Collins et al. 2015), solubilisation of POC to DOC (Kiørboe & Jackson 2001) and, prior to the final stage of remineralisation, respiration to dissolved inorganic carbon (Fig. 1).
Ecological theory Rationale for design of the particle incubations We used short (8 h) incubations to reduce physiological and taxonomic changes in the microbial community during incubations (Pomeroy et al. 1994, Gattuso et al. 2002, Maske et al. 2017). The 8 h incubation time was in line with a previous study on the effect of temperature on bacteria in Chesapeake Bay, USA (Apple et al. 2006). However, had we run the incubations for longer (days to weeks), the response of respiration to temperature would likely be reduced, as the microbial community acclimatises and adapts to the different environmental conditions. Thus, our incubation time means we cannot assess any acclimation and/or adaptation by the microbes. However, small organisms have shorter generation times, larger population sizes and higher genetic diversity, making microbes an ideal test subject (Ochman et al. 1999) for our short experiments. Another advantage of a short incubation is that it reduces the time available for wall or bottle effects to influence our results. We also used 20 ml sized vials, which were 5× larger than similar previous studies (Cavan et al. 2017b, Koski et al. 2017), to further reduce bottle and wall effects. However, the vials were still small enough to allow us to concentrate particles into a small volume and measure a decline in oxygen concentration. The high concentration of POC from large organic particles in our 20 ml vials ensured no substrate limi-
We did not measure primary production in this study as the experiment was conducted in the dark, but used a published MTE equation for primary production (López-Urrutia et al. 2006) to estimate massspecific primary production at different temperatures: ln(kPP) = [−0.29 × (1/cT )] −11.28
(3)
where kPP is the mass-specific primary production, c is the Boltzmann constant (0.862 × 10⁻⁵ eV K−1), and T is temperature in Kelvin. As primary production is a metabolic function, it is also predicted to increase with temperature according to MTE, but to a lesser extent (i.e. the slope for respiration = 0.6−0.7, and the slope for primary production = 0.3). We use kPP to estimate the potential percentage increase in primary production and therefore the overall net effect of increasing temperature on export (change in primary production − change in respiration). When projecting future primary production using multi-model means over many earth system models (ESMs), primary production is projected to decrease globally due to reductions in nutrient concentration and enhanced stratification, even though in almost half of the ESMs, no changes or increases in primary production are actually predicted (Laufkötter et al. 2013). Primary production is projected to increase when temperature-dependent production terms are included in models (Taucher & Oschlies 2011), as also predicted by simple MTE.
Cavan & Boyd: Effect of temperature on carbon export
Linear models were fitted between temperature and POC turnover. First, a simple linear regression was computed between k values and temperature (Table 2). We then fitted a linear mixed-effect (LME) model using the lme4 package in R (Bates et al. 2015), where the random effect was the time of sampling (hour of day, Table 1) and the fixed effect was the temperature of the incubations (Table 1). The projected temperature change by 2100 specifically at the SOTS site was isolated from global IPCC representative concentration pathway (RCP) 8.5 (‘business-as-usual’) multi-model median temperature change data output from CMIP5 models, as in Henson et al. (2017). The estimated change in respiration is calculated using the linear models. As such, the error associated with this estimate is given as a range, as it is calculated by adding the standard error to, and then subtracting it from, the 2 coefficients (slope and intercept) in the linear models to estimate the minimum and maximum (respectively) change in respiration. Both the linear and LME statistical models are standard Model I regressions, which assume no error in the independent x variable. Use of the Model I regression is justified in this analysis, as temperature was kept constant and controlled by the experimental design. If both variables are random and not controlled by the researcher, then a Model II type regression that assumes error in both variables is required (Laws & Archie 1981, Legendre & Legendre 1998). A Model II regression should always be used under these circumstances, although in biological oceanography, Model I regression is most commonly used. Using a Model II regression in our study would not change the significance of the model fit nor the r2, but it would change the slope, such that if the model was used to project microbial respiration at higher temperatures, the projected change would be different and either be an underor an over-estimate.
Table 2. Model selection and statistics for linear and linear mixed effect (LME) models used to assess the response of k (microbial particulate organic carbon turnover) to temperature. T: temperature the experiment was run at, time: sampling time that particles were collected from the mixed layer (Table 1), AIC: Akaike’s information criterion, SE: standard error of the fixed effect (temperature) Model
Model structure
p
AIC
SE
Linear LME
log(k) ~ T log(k) ~ T + (1|time)
< 0.01 < 0.01
60.5 54.2
0.031 0.026
117
RESULTS At the SOTS site in March 2017, surface chl a concentrations were low (0.23 µg l−1, Fig. 2a) as expected for an HN LC region. Mixed layer (30 m) POC concentration was >120 µg l−1 and rapidly declined in the mesopelagic zone (base of the mixed layer, to 500 m; Fig. 2b) to < 5 µg l−1. Particles derived from the 200 µm mesh plankton net at 30 m were dominated by diatoms (Fig. S5), particularly the genera Rhizosolenia sp. The natural mixed heterotroph community contributing to oxygen consumption consisted of free-living and particle-attached nauplii, pteropods, foraminiferans, small copepods (as identified from FlowCAM images) and bacteria. Particle size ranged from 200−2500 µm in equivalent spherical diameter (ESD), with a mean ESD of 364 (± 2 SE) µm. The mean ESDs for each net deployment were similar (60 µm difference, or 15%), ranging from a low of 349 µm in Net 3 to a high of 407 µm in Net 5. Small (200− 400 µm ESD) particles dominated (67%) the incubations in this study (see Fig. S6). The attenuation of particles, or here POC concentration with depth (Fig. 2b), can be described either using a power law function such as the b value, which in this study was 0.70 (p < 0.001, r2 = 0.88) (Martin et al. 1987) or an exponential function using the exponent z* (depth by which 63% of the POC has been remineralised), which was 114 m (p < 0.01, r2 = 0.63) (Boyd & Trull 2007). In our incubation studies, the POC concentrations in the vials were very high (0.6−4.2 mg l−1), i.e. 5−35× higher than at 30 m in situ (Fig. 2b). Combining this high concentration and short incubation time ensured that the substrate did not become limiting. Thus, oxygen concentration declined with time in all vials over the 8 h experiments (Fig. 3a). The mean oxygen consumption for all temperatures was 3.3 ± 0.3 µmol O2 l−1 h−1. Significant (p < 0.05) changes in oxygen concentration were observed at the lowest (control) temperature (12.0°C), most similar to that in situ (13.0°C in the mixed layer) over all of the 8 h incubations. As temperature increased, oxygen consumption and POC turnover rates (k) also increased (Figs. 3 & 4) but not always in a uniformly linear manner; k increased up to 15°C, then decreased up to 17°C, before increasing again to reach the maximum k at the maximum temperature of 22°C (Fig. 3b). The mean POC turnover (k) normalised to heterotrophic biomass at the control temperature was 0.97 ± 0.10 d−1. The total range of POC turnover measured in this study was 0.33−5.25 d−1, from the lowest (12°C) and highest (22°C) temperature incubations, respectively (Fig. 4a). Time of day had a significant
Aquat Microb Ecol 82: 111–127, 2018
118
b)
O2 consumption (µmol O2 l–1 h–1)
Normalised O2 concentration
a) 1
0.9 12 14 15 16 17 18 19 20 21 22
0.8
0.7
8
p < 0.01 R2 = 0.5
6
4
2
0
0
2
4
6
8
12
Time (hours)
14
16
18
20
22
Temperature (°C)
Fig. 3. (a) Normalised oxygen concentration (unitless) over the 8 h incubations. Different coloured lines represent different incubation temperatures (°C). The oxygen consumption has been normalised (to 1) to show the relative decline in oxygen at different temperatures during the incubations over the 8 h period. (b) Mean oxygen consumption at each temperature prior to normalising for the particulate organic carbon concentration. Grey area shows 95% confidence intervals. This plot can be interpreted to show the reaction norm of microbes over a range of temperatures and that the maximum temperature for microbial oxygen consumption cannot be determined from this study and hence is likely 22°C or higher. In both plots, error bars are SEM, and n = 3 for all temperatures apart from at 12°C, where n = 15 and 15°C where n = 6 at each time point
b)
Experimental range 2100 range
Ea = 0.88 eV Ea = 0.85 eV
2
4
1.5
3
1
ln(k)
k (d–1)
a) 5
2
0.5 0
1
–0.5 –1
0 12
14
16
18
20
22
Temperature (°C)
39.5
40.0
40.5
1/cT
Fig. 4. Particulate organic carbon (POC) turnover (k) against temperature with linear regressions for respiration produced by mixed-effect modelling. k values for respiration (O2 uptake was divided by heterotrophic biomass) are shown by the closed points, with the linear mixed effect (LME) model denoted by the solid line over the full experimental temperature range. The dashed line is the LME model from our control temperature to the projected temperature at SOTS in 2100. (a) POC turnover (k) with temperature (°C) where for the experimental range (solid line), r2 = 0.45 (p < 0.01) and for the 2100 range (dashed line), r2 = 0.49 (p < 0.01). (b) Classic metabolic theory of ecology (Arrhenius) plot where c is the Boltzmann constant (0.862 × 10⁻⁵ eV K−1), T is temperature in Kelvin, and the natural log of k is shown. The LME model line for the experimental range (solid line) has an r2 = 0.40 (p < 0.01) and for the 2100 range (dashed line), r2 = 0.41 (p < 0.01). The slope of both lines, which is the activation energy (Ea) in (b), is −0.9 eV (0.88 and 0.85 eV to 3 significant figures, respectively). Grey areas show 95% confidence intervals
but minor effect on oxygen consumption (p < 0.01, r2 = 0.15), so the LME model improved the model fits with lower error and lower Akaike’s information criterion (AIC) compared to the linear regression (Table 2). Hence the LME models are presented here (see Fig. S4 for comparisons between the linear and
LME models) and are used in our projections of respiration with increased temperature: R = e([0.12 × Temp] − 1.9)
(4)
where Eq. (4) is the regression from the LME model in Fig. 4a, of POC turnover against temperature (°C)
Cavan & Boyd: Effect of temperature on carbon export
across the whole experimental range of temperatures used. This regression was used to project the future change in POC turnover with temperature. We also fitted linear and LME models to an Arrhenius plot (MTE) to determine the activation energy where: ln(I M −1) = −Ea(1/cT ) + ln(i0)
(5)
such than I M −1 gives the k values and −Ea the activation energy (slope between k and 1/cT, see Eq. 6): ln(RMTE) = (−0.9 × Temp) − 35
(6)
Eq. (6) is the regression from the LME model in Fig. 4b, of the natural log of k against temperature in Kelvin. The slope of the regression is the Ea. In the LME model, the Ea was 0.9 ± 0.2 eV, much higher than is generally considered in MTE for all organisms (0.6−0.7 eV) (Brown et al. 2004). When calculating the slope between POC mass and oxygen consumption, a Model II regression was used, as the POC mass was not controlled and so is considered a random variable. We presented POC mass against oxygen consumption with both type Model I and Model II to highlight the large difference in slope given by these 2 models (Fig. S7). N either model significantly fitted these data.
DISCUSSION Respiration is one of the key metabolic processes driving the remineralisation of organic carbon in the oceans (del Giorgio & Duarte 2002). This process is closely linked to temperature (Brown et al. 2004), hence climatic-driven changes in ocean temperature will directly influence the extent of POC remineralisation and ocean carbon storage (Iversen & Ploug 2013). We directly measured oxygen consumption by microbial organisms (Fig. 1), with unfiltered large, organic carbon-rich particles the main supplied substrate for the microbes. We investigated the effect of increasing water temperature on microbial remineralisation of large particles in the sub-Antarctic Southern Ocean. The upper ocean at the SOTS site is representative of conditions for a large proportion of the Indian and Australian sectors of the sub-Antarctic Southern Ocean (Trull et al. 2001b). The SOTS site is within the sub-Antarctic HNLC region, so chl a concentrations are low throughout the year (Bowie et al. 2011, Ebersbach et al. 2011, Eriksen et al. 2018), as we observed during our study. In addition, silicate concentrations are seasonally low (< 2 µmol kg−1 in summer), compared to the more southern polar frontal zone
119
and other HNLC areas (Rintoul & Trull 2001, Trull et al. 2001c). Hence SOTS in summer is best described as a high nutrient, low silicate, low chl a region, as also observed in the equatorial Pacific, where picoplankton are responsible for most of the primary production and diatoms for new production (Dugdale & Wilkerson 1998). At SOTS, picoplankton and flagellates are the most abundant phytoplankton, but dinoflagellates dominate the phytoplankton carbon biomass (Kopczynska et al. 2001). Small-sized plankton communities result in different particle aggregation pathways and the dominance of smaller exported particles (Cavan et al. 2018) as we observed here (200−400 µm ESD), which is a common characteristic of particles at 150 m at SOTS (Ebersbach et al. 2011). The mesh size of the net (200 µm) constrained the minimum size of the particles. Hence, even though we purposefully had to increase the concentration of larger particles, such pre-concentration did not appear to alter the natural particle size distribution observed at SOTS. Our particle size distribution was well within the size range of large, fast-sinking particles commonly observed elsewhere, such as in the Mediterranean and Equatorial Pacific (AlonsoGonzalez et al. 2010, Cavan et al. 2017b). The POC mass of the particles was not proportional to the oxygen consumption rates in each vial as stated by MTE (Fig. S7). The lack of model fit is most likely because both substrate and microbes were in the incubation vials (Fig. 1). This issue could be a factor potentially hindering studies on microbial organisms and MTE, particularly of mixed, natural communities. Additionally, during our incubations some of the oxygen consumption would have been associated with autotrophic respiration, as the phytoplankton were viable at the onset of the incubations. However, the experiments were run in the dark, and studies have shown that heterotrophic respiration is 2−3 times greater than autotrophic respiration (Schindlbacher et al. 2009, Savage et al. 2013).
Effect of temperature on microbial respiration Seasonal temperatures at SOTS range between 8 and 12°C (Trull et al. 2001a). We sampled at the end of austral summer in March, when the plankton community is exposed to the highest temperatures (Shadwick et al. 2015), but also towards the end of the plankton growing season. Therefore, our selected temperature range (14−22°C) used in the incubations is well above the natural seasonal amplitude that resident flora and fauna encounter at SOTS. However,
120
Aquat Microb Ecol 82: 111–127, 2018
our findings from the 8 h incubations demonstrate that the selected temperatures capture the natural temperature range that resident sub-Antarctic microbes can successfully metabolise within (Figs. 4 & 5). For example, the optimum temperature for growth rates of heterotrophic microbes that normally reside at 4−5°C in the Southern Ocean can be up to 18°C (Simon et al. 1999). This is a common phenomenon, and many microbes living in colder waters reside at temperatures lower than their metabolic optimum (Delille & Perret 1989, Pomeroy & Wiebe 2001). In this study, the maximum oxygen consumption rate occurred at the maximum temperature microbes were exposed to (22°C) (Figs. 3b, 4 & 5), with no evidence of oxygen consumption plateauing, suggesting that the optimum temperature for this natural population of sub-Antarctic microbes was 22°C or higher. A similar result was observed during short (6−8 h) incubations of coastal, temperate, marine bacteria in Chesapeake Bay (USA), where the bacterial respiration was highest at the maximum in
Fig. 5. Reaction norms (fitness versus environment) for subAntarctic microbes from environmental manipulation studies. Comparison of the reaction norm of respiration from this study (expressed as particulate organic carbon [POC] turnover, k, per day, black symbols and lines), using the regression from Fig. 4a, and of growth rate versus temperature (red line) of a sub-Antarctic diatom from Boyd et al. (2016). Both reaction norms are on the same scale (y-axis). The vertical lines show the control temperatures, and the arrows show the IPCC-projected increase in temperature at the location of each study (black = Southern Ocean Time Series [SOTS], red = Boyd et al. 2016). The double-headed black arrows show the present-day temperature range at SOTS and the experimental temperature range (black symbols) to which microbes were exposed in this study. The optimum temperature for microbial oxygen consumption cannot be determined from this study and hence is 22°C or higher
situ temperature of 30°C (Apple et al. 2006). We assume heterotrophic microbes were responsible for driving our observed trend between POC turnover and temperature, as autotrophic respiration has a much weaker temperature dependence than heterotrophic respiration (López-Urrutia et al. 2006). In our study, the time of day for sampling (i.e. net deployment) significantly influenced the subsequent turnover of POC by microbes in the incubations. This could have been due to the short generation times of microbes, particularly prokaryotes (< 2 d; Krupke et al. 2016), as their abundance (cell division) and community composition can change due to shifts in the daily primary production cycle and may decrease when light levels are lower because of substrate availability (Ottesen et al. 2014, Aylward et al. 2017). In our study, oxygen consumption during the incubation was normalised by the POC mass in the vial to compute k, such that any difference(s) in microbial and/or substrate concentrations within the vials, due to temporal variability (time of day particles were collected), should not influence the effect of temperature on k. However, there was an effect of time of sampling on the relationship between k and temperature, so changes in microbial community composition, rather than abundance, are likely the important driving factor for the effect of time of sampling on POC turnover rates. In the future, field experiments should be carried out whenever possible at the same time of day and combined with quantifiable enumeration (e.g. flow cytometry and fluorescent staining) of microbial organisms. At the control temperature of 12°C, our mean POC turnover rates (1 d−1) were higher than the expected range (0.01−0.5 d−1) for large particles as determined by both laboratory and open ocean studies (Ploug & Grossart 2000, Iversen & Ploug 2010, Collins et al. 2015, Belcher et al. 2016, Cavan et al. 2017b). However, in these published studies, POC turnover was normalised to total POC mass, not the respiring heterotroph mass. The mean k at 12°C if we just normalise oxygen consumption rates by total POC mass was 0.35 d−1. In addition, above 20°C, k > 1 d−1, implying the POC in the vials would be completely respired in 1 d. High k values have also been observed at similar temperatures in the equatorial Pacific for small, slow-sinking particles (Cavan et al. 2017b). The particles in our study were small in comparison to other investigations of POC turnover, where particles are typically greater than 1 mm (Iversen & Ploug 2010, 2013), and yield a lower POC turnover (~0.1 d−1) than we observed. In our study between 12 and 17°C, there was no significant (p > 0.05, linear
Cavan & Boyd: Effect of temperature on carbon export
and LME model) effect of temperature on POC turnover due to the low POC turnover rates at 16−17°C, although it did increase significantly between 12 and 15°C (Fig. 4a), with 15°C being the projected temperature at SOTS in 2100. Previous studies have also shown that the relationship between respiration or production and temperature is constant over lower or intermediate temperatures, but increases when temperatures rise above 22°C (Maske et al. 2017) or 24°C (Regaudie de Gioux & Duarte 2012). In these instances, the metabolic rates at the higher temperatures drove the observed trend. Increased temperature resolution during incubations are needed, along with many replicates, to investigate the relevance of high temperatures driving trends.
Projected change in POC export by 2100 The sub-Antarctic Pacific at the SOTS site is projected to warm by 1.9°C by 2100 under RCP 8.5 (IPCC 2014). Therefore, to estimate potential future changes in respiration we used the LME model (Fig. 4a) to calculate k at 13.0°C (mixed layer temperature in March 2017, Fig. 2b) and at 14.9°C (1.9°C above in situ temperature of 13.0°C). Warming of 1.9°C will increase POC turnover by 26% (standard error = 7%) in SOTS models (Fig. 4a). Based solely on theory, using an Ea of 0.29 eV, we estimated that over the same temperature increase, primary production will also increase, but to a lesser extent, i.e. 9% (López-Urrutia et al. 2006). Accounting for this increase in primary production results in a net (change in primary production − change in respiration) increase in respiration (thus potential decrease in export) of approximately 17% (9−26 = −17%). Our calculation of reduced POC export is well within the reported ranges of the estimated decline in carbon sequestration by 2100, including a 4−27% decrease in lake sediments (Gudasz et al. 2010) and a 21% (López-Urrutia et al. 2006) or 11% (YvonDurocher et al. 2010b) decrease in the surface ocean depending on the Ea used for primary production (0.29 or 0.41 eV, respectively). However, our projected change by 2100 (in 80 yr) is much higher than suggested by a model of recent (1982−2014, 32 yr range) historic changes in the proportion of primary production exported across the base of the euphotic zone (decrease in ~1%), over a similar temperature range in the sub-Antarctic (Cael et al. 2017). Their model was also principally based on thermodynamic theory (Cael & Follows 2016), so one would expect their results to more closely resemble those from this
121
study. Differences in the magnitude of POC export decline may exist because the respiration in the model of Cael et al. (2017) was constrained by the response of copepod grazing rates to temperature (Huntley & Lopez 1992), whereas ours focussed on a wider range of microbial organisms. Furthermore, the differences between the 2 studies could also have been caused by the impact of the higher temperatures on POC turnover or aspects of our experimental design such as the short incubation times. However, the large dissimilarities in the approaches used between the Cael et al. (2017) historical modelling study and our experimental field study makes it futile to conclude on the differences observed. It does show that more studies are needed, both experimental and using models, to investigate the role of temperature on metabolism and the biological pump. In our study we have shown that the predicted net change in the turnover of POC by 2100 is a net decrease due to increased microbial respiration. It was beyond the scope of this study to separately test the response of each process in the steps towards remineralisation (disaggregation, solubilisation and respiration, Fig. 1) and temperature. We assume that enzyme solubilisation and the release of DOC also increased with temperature as indicated by microbial remineralisation experiments in marine sediments, where both processes increased up to 27°C (Weston & Joye 2005). We used large, carbon-rich particles as the main introduced substrate in our incubations to simulate particles prior to downward export from the mixed layer, as export occurs when large particles form and their density is greater than the surrounding water (Fowler & Knauer 1986). During aggregation, export and subsequent sinking heterotrophs reduce POC through consumption and solubilisation, but this is most pronounced in the upper ocean, where export commences (Martin et al. 1987). Thus temperature-dependent increases in these heterotrophic metabolic processes due to warming will decrease the amount of available POC for export and subsequent sequestration. Our results suggest that the amount of POC leaving the upper ocean could be reduced, potentially by almost 20%, decreasing ocean carbon storage and in time altering nutrient concentrations in the deep oceans. Microbial transformations of POC are only one of the many processes that will be altered in the coming decades (Boyd 2015). Other factors that influence particle export are likely to be influenced by warming: any change in both phytoplankton (Thomas et al. 2012) and grazer (Richardson 2008) community composition will affect particle type, size and remin-
122
Aquat Microb Ecol 82: 111–127, 2018
eralisation; changes in the viscosity of water may influence particle sinking rates (Iversen & Ploug 2013); and freshening and warming may affect stratification intensity and the supply of nutrients to the mixed layer affecting primary production (Boyd 2015). These plus other physico-chemical and ecological processes will interact with each other to dampen or increase the effects of future global change on the biological pump (Boyd & Brown 2015), and these interactions should be studied at the experimental level.
Assessing the temperature sensitivity of Southern Ocean microbes Using MTE (Fig. 4b), we can calculate the activation energy (Ea) which characterises the temperature sensitivity of community respiration. Using the LME model, we calculated a higher Ea (0.9 eV) than suggested by MTE (0.6−0.7 eV) (Gillooly et al. 2001, Brown et al. 2004). This Ea of 0.9 eV from our study is the same as determined from mesopelagic (300− 600 m) bacterial respiration (0.9 eV) in the South Atlantic and Indian Oceans over a slightly lower temperature range of 9−15°C (Mazuecos et al. 2015). The Q10 (proportional increase in respiration per 10°C rise in temperature), which is also a measure of temperature sensitivity, in this study was 3.9 at 15°C using the LME model. These Q10 values are also higher than the global (terrestrial and aquatic) average Q10 for respiration at 15°C of 2.5 (Ea = 0.62) (Yvon-Durocher et al. 2012), but approximate subsurface (>100 m) estimates at 3.6 (Mazuecos et al. 2015, Brewer & Peltzer 2016). The higher Ea and Q10 observed here compared to classic MTE shows the higher sensitivity (Clarke & Johnston 1999) of microbial organisms to temperature in the Southern Ocean. We also ran a sensitivity analysis to test for the effect of normalising all of our k values by 50%, which accounted for the heterotrophic biomass within the vials in accordance with data from Strzepek et al. (2005). To do this, we assigned each k value a random number between 46 and 56% (the range of the proportion of POC mass associated with heterotrophs in the study by Strzepek et al. 2005) and recalculated the slope between the natural log of k and temperature. We repeated this 1000 times, resulting in a mean slope (Ea) of 0.88 ± 0.001 eV, identical to our Ea of 0.9 eV (0.88 to 3 significant figures, Fig. 4b) over the 10°C temperature range. We also repeated this for a larger range in heterotrophic biomass (40−60% of total POC), which yielded a mean Ea of 0.87 ± 0.002 eV (Fig. S8). We therefore conclude that the use of a
constant proportion of POC mass associated with heterotrophic biomass (50%) in all vials does not significantly affect the Ea. It is not possible from our results to discern whether the high temperature sensitivity is a microbial, Southern Ocean, or a joint microbial−Southern Ocean feature; i.e. do all microbes globally have a higher sensitivity to temperature than metazoans? Are all Southern Ocean organisms cold-adapted? Or is this trend applicable only for Southern Ocean (or polar) microbes? Whilst MTE has been applied to microbes such as phytoplankton and bacteria, the metabolic activity most commonly measured is production (either as growth rates or bacterial production) and of single species or groups, so there are few equivalent studies to compare our results to. Searching the literature, we did find different marine studies that had resulted in identical or similar Ea values, with phytoplankton production and respiration across geothermally heated streams (5−50°C) (Padfield et al. 2017), total oxygen consumption from all organisms in the subtropical mesopelagic (>100 m) (Brewer & Peltzer 2016) and bacterial respiration in the mesopelagic (300−600 m) resulting in Ea values of 0.9 eV. Additionally, a literature study of marine, terrestrial and freshwater habitats identified herbivores, fungi and invertebrates to have the highest Ea of all taxa of > 0.7 eV (Dell et al. 2011). Conversely, the latter study also found unicellular organisms such as phytoplankton and bacteria to have much lower Ea at < 0.5 eV (Dell et al. 2011). Most published Ea values are much lower than the results from this study, including from microbial ecosystem respiration in heated ponds (0.62 eV; Yvon-Durocher et al. 2010b), epipelagic bacterial production (0.58 eV; López-Urrutia & Morán 2007), zooplankton grazing (0.67 eV; Chen et al. 2012), oxygen consumption of fish (0.46 eV; Killen et al. 2010) and also specifically reef fish (0.5 eV; Barneche et al. 2014). Nevertheless, a polar (both Arctic and Antarctic) study observed that the respiration of zooplankton resulted in a higher Ea of 1.3 eV (Gleiber et al. 2016), suggesting that these organisms are also more sensitive to temperature change. As we have shown, there is a wide range of Ea values associated with microbial metabolism, and thus our result of 0.9 eV likely represents the cold-adaptation of the resident microbial community to the lower temperatures of this sub-Antarctic region. In addition, our results are most similar to those from the mesopelagic zone (Mazuecos et al. 2015, Brewer & Peltzer 2016), suggesting that species inhabiting cooler, deeper waters are also highly sensitive to temperature changes. Regional or depth-dependent differences in the
Cavan & Boyd: Effect of temperature on carbon export
responses of organisms to rising temperatures should be accounted for in large-scale or global model analyses to ensure that results do not underestimate their metabolic response to temperature change. Thermal sensitivity could explain why our projected change in export of 17% is much higher than that estimated by Cael et al. (2017) (~1%) over a similar (2°C) temperature gradient. In their study, Cael et al. (2017) used the same model globally, thus not compensating for the different thermal sensitivities of organisms in different biogeographical provinces. Decreasing the Ea to 0.69 eV (Q10 = 3.3 at 15°C) in our study in line with MTE (Brown et al. 2004) results in an increase in respiration of just 2%. This small decrease may result in net increases in export if the magnitude of the increase in primary production is greater than 2%. Increases in export have been predicted elsewhere for the Southern Ocean, such as when using ESMs that are not coupled to biogeochemistry models (Britten & Primeau 2016) or in more southerly regions (Cael et al. 2017). The Southern Ocean is a complex and unique environment due to the apparent inverse relationship between primary production and export (Maiti et al. 2013, Cavan et al. 2015, Le Moigne et al. 2016) and the possible ‘coldadaptation’ of organisms (Clarke & Johnston 1999). The concept of increased respiration with temperature is by no means novel, but using large, organic particles to mimic the onset of export in the mixed layer and a diverse, natural microbial community is a novel application of MTE.
Relevance of MTE in the context of ocean biogeochemistry MTE can be thought of as a mechanistic model based on thermodynamics of organisms, which differs from conventional statistical models (e.g. simple exponential or power-law functions) (West et al. 1997). However, MTE assumes that metabolic activity is based solely on supply (temperature), whereas in reality, it is also based on demand (amount of ATP needed for energy) (Clarke 2006) and the amount of available substrate (Aguiar-González et al. 2012, Maske et al. 2017). Additionally, MTE is a linear model such that metabolic functions will continue to increase with increasing temperature, never reaching an optimum which we know is true in nature. In this study, an optimum temperature was never reached (Fig. 5), rendering MTE suitable. We chose to interpret some of our findings using MTE as it is valuable to ecologists to interpret differ-
123
ences from the ‘null’ MTE model (Harte 2004), as we have observed here by the higher Ea. Although MTE has been applied to marine bacteria, rarely is it applied to mixed communities and other non-prokaryotic microbes. Perhaps this is because it is not possible to obtain metabolic resting (non-moving) rates from microbes, which are more useful in MTE at least when comparing between species (Clarke 2017), and it is more difficult to calculate the mass of the respiring organisms separately from the substrate if using field samples as in this study. More studies are needed on the effect of temperature on microbes to elucidate if a higher Ea is due to the typically cold temperatures of the Southern Ocean and/or a global phenomenon of the physiology of microbes. Additionally, designing multi-variable experiments (Boyd et al. 2018) relevant to the biological carbon pump to account for interactions amongst physico-chemical and ecological processes will more closely replicate the natural world (Hutchins et al. 2017).
CONCLUSIONS Remineralisation of POC in the biological pump is partly controlled by the respiration of microbial organisms. As expected, we found that microbial respiration of large organic particles increases with temperature, and future warming scenarios could decrease export into the mesopelagic zone by 17%. This potential decrease means that more carbon will remain in the upper ocean and in contact over an annual cycle to the atmosphere, decreasing ocean carbon storage in the deep. Using the MTE, we found the Southern Ocean microbial community to be particularly sensitive to temperature changes. Our study suggests that Southern Ocean microbes could have an optimal temperature for respiration above ambient temperatures projected by warming by the end of the century, based on results from our short incubations. MTE has been heavily applied to vertebrates, invertebrates and even marine bacteria, but few, if any, studies have applied it using a natural, mixed community of microbial heterotrophs and linked this to the biological pump. There is a great need for more complex experimental studies on the effects of warming on microbial and larger grazer communities to truly start to predict the change in export production. Of equal importance is the need to account for regional differences in the response of organisms to rising temperatures during large-scale or global model analyses, to ensure results do not underestimate their metabolic response to temperature change.
Aquat Microb Ecol 82: 111–127, 2018
124
Acknowledgements. This work was funded by the Australian Research Council by a Laureate awarded to P.W.B. We thank the crew and officers of the RV ‘Investigator’ and Matthieu Bressac and Emmanuel Laurenceau-Cornec for assistance in deploying the ISPs and plankton net; Thomas Rodemann for running the POC samples at the Central Science Laboratory at the University of Tasmania; Scott Nodder (NIWA, New Zealand) for the provision of unpublished data; and finally, 3 anonymous reviewers and the editor whose comments and insights greatly improved this manuscript. All data and R code used to produce the key figures and analysis can be found at https://github.com/e-cavan/Southern_Ocean_Microbial_Respiration. LITERATURE CITED Aguiar-González B, Packard TT, Berdalet E, Roy S, Gómez M (2012) Respiration predicted from an Enzyme Kinetic Model and the Metabolic Theory of Ecology in two species of marine bacteria. J Exp Mar Biol Ecol 412:1−12 Alonso-Gonzalez IJ, Aristegui J, Lee C, Sanchez-Vidal A and others (2010) Role of slowly settling particles in the ocean carbon cycle. Geophys Res Lett 37:L13608 Álvarez E, López-Urrutia Á, N ogueira E, Fraga S (2011) How to effectively sample the plankton size spectrum? A case study using FlowCAM. J Plankton Res 33:1119−1133 Aminot A, Kérouel R (2004) Dissolved organic carbon, nitrogen and phosphorus in the N -E Atlantic and the N -W Mediterranean, with particular reference to nonrefractory fractions and degradation. Deep-Sea Res I 51: 1975−1999 Amon RMW, Benner R (1996) Bacterial utilization of different size classes of dissolved organic matter. Limnol Oceanogr 41:41−51 Apple JK, del Giorgio PA, Kemp WM (2006) Temperature regulation of bacterial production, respiration, and growth efficiency in a temperate salt-marsh estuary. Aquat Microb Ecol 43:243−254 Arandia Gorostidi N , Huete Stauffer MT, Alonso Sáez L, Morán XAG (2017) Testing the metabolic theory of ecology with marine bacteria: different temperature sensitivity of major phylogenetic groups during the spring phytoplankton bloom. Environ Microbiol 19:4493−4505 Arrhenius S (1889) Über die Reaktionsgeschwindigkeit bei der Inversion von Rohrzucker durch Säuren. Z Phys Chem 4U:226−248 Aylward FO, Boeuf D, Mende DR, Wood-Charlson EM and others (2017) Diel cycling and long-term persistence of viruses in the ocean’s euphotic zone. Proc Natl Acad Sci USA 114:11446−11451 Bach LT, Riebesell U, Sett S, Febiri S, Rzepka P, Schulz KG (2012) An approach for particle sinking velocity measurements in the 3-400 µm size range and considerations on the effect of temperature on sinking rates. Mar Biol 159:1853−1864 Barneche DR, Kulbicki M, Floeter SR, Friedlander AM, Maina J, Allen AP (2014) Scaling metabolism from individuals to reef fish communities at broad spatial scales. Ecol Lett 17:1067−1076 Bates D, Maechler M, Bolker B, Walker S (2015) Fitting linear mixed-effects models using lme4. J Stat Softw 67: 1−48 Belcher A, Iversen MH, Manno C, Henson SA, Tarling GA,
Sanders R (2016) The role of particle associated microbes in remineralisation of faecal pellets in the upper mesopelagic of the Scotia Sea, Antarctica. Limnol Oceanogr 61:1049−1064 Boltzmann L (1872) Weitere Studien über das Wärmegleichgewicht unter Gasmolekülen. Sitzungsber MathNatwiss Kl Kaiser Akad Wiss 66:275−370 Bowie AR, Brian Griffiths F, Dehairs F, Trull TW (2011) Oceanography of the subantarctic and Polar Frontal Zones south of Australia during summer: setting for the SAZ-Sense study. Deep-Sea Res II 58:2059−2070 Boyd PW (2015) Toward quantifying the response of the oceans’ biological pump to climate change. Front Mar Sci 2:77 Boyd PW, Brown CJ (2015) Modes of interactions between environmental drivers and marine biota. Front Mar Sci 2: 9 Boyd PW, Trull T (2007) Understanding the export of biogenic particles in oceanic waters: Is there consensus? Prog Oceanogr 72:276−312 Boyd PW, Strom S, Whitney FA, Doherty S and others (1995) The NE subarctic Pacific in winter: I. Biological standing stocks. Mar Ecol Prog Ser 128:11−24 Boyd PW, McDonnell A, Valdez J, Lefevre D, Gall MP (2015) RESPIRE: an in situ particle interceptor to conduct particle remineralization and microbial dynamics studies in the oceans’ Twilight Zone. Limnol Oceanogr Methods 13:494−508 Boyd PW, Dillingham PW, McGraw CM, Armstrong EA and others (2016) Physiological responses of a Southern Ocean diatom to complex future ocean conditions. N at Clim Change 6:207−213 Boyd PW, Collins S, Dupont S, Fabricius K and others (2018) Experimental strategies to assess the biological ramifications of multiple drivers of global ocean change — a review. Glob Change Biol 24:2239−2261 Brewer PG, Peltzer ET (2016) Ocean chemistry, ocean warming and emerging hypoxia: commentary. J Geophys Res Oceans 121:3659−3667 Britten GL, Primeau FW (2016) Biome-specific scaling of ocean productivity, temperature, and carbon export efficiency. Geophys Res Lett 43:5210−5216 Brown JH, Gillooly JF, Allen AP, Savage VM, West GB (2004) Toward a metabolic theory of ecology. Ecology 85: 1771−1789 Cael BB, Follows MJ (2016) On the temperature dependence of oceanic export efficiency. Geophys Res Lett 43: 5170−5175 Cael BB, Bisson K, Follows MJ (2017) How have recent temperature changes affected the efficiency of ocean biological carbon export? Limnol Oceanogr Lett 2:113−118 Canfield DE, Jørgensen BB, Fossing H, Glud R and others (1993) Pathways of organic carbon oxidation in three continental margin sediments. Mar Geol 113:27−40 Carlson CA, Ducklow HW (1995) Dissolved organic carbon in the upper ocean of the central equatorial Pacific Ocean, 1992: daily and finescale vertical variations. Deep-Sea Res II 42:639−656 Cavan EL, Le Moigne FAC, Poulton AJ, Tarling GA and others (2015) Attenuation of particulate organic carbon flux in the Scotia Sea, Southern Ocean, is controlled by zooplankton fecal pellets. Geophys Res Lett 42:821−830 Cavan EL, Henson SA, Belcher A, Sanders R (2017a) Role of zooplankton in determining the efficiency of the biological carbon pump. Biogeosciences 14:177−186
Cavan & Boyd: Effect of temperature on carbon export
Cavan EL, Trimmer M, Shelley F, Sanders R (2017b) Remineralization of particulate organic carbon in an ocean oxygen minimum zone. Nat Commun 8:14847 Cavan EL, Giering SLC, Wolff GA, Trimmer M, Sanders R (2018) Alternative particle formation pathways in the Eastern Tropical North Pacific’s biological carbon pump. J Geophys Res Biogeosci 123:2198−2211 Chen B, Landry MR, Huang B, Liu H (2012) Does warming enhance the effect of microzooplankton grazing on marine phytoplankton in the ocean? Limnol Oceanogr 57: 519−526 Cherrier J, Valentine SK, Hamill B, Jeffrey WH, Marra JF (2015) Light-mediated release of dissolved organic carbon by phytoplankton. J Mar Syst 147:45−51 Clarke A (2006) Temperature and the metabolic theory of ecology. Funct Ecol 20:405−412 Clarke A (2017) Principles of thermal ecology: temperature, energy, and life. Oxford University Press, Oxford Clarke A, Johnston N M (1999) Scaling of metabolic rate with body mass and temperature in teleost fish. J Anim Ecol 68:893−905 Collins JR, Edwards BR, Thamatrakoln K, Ossolinski JE and others (2015) The multiple fates of sinking particles in the North Atlantic Ocean. Global Biogeochem Cycles 29: 1471−1494 Corkrey R, McMeekin TA, Bowman JP, Ratkowsky DA, Olley J, Ross T (2016) The biokinetic spectrum for temperature. PLOS ONE 11:e0153343 del Giorgio PA (1992) The relationship between ETS (electron transport system) activity and oxygen consumption in lake plankton: a cross-system calibration. J Plankton Res 14:1723−1741 del Giorgio PA, Duarte CM (2002) Respiration in the open ocean. Nature 420:379−384 Delille D, Perret E (1989) Influence of temperature on the growth potential of Southern polar marine bacteria. Microb Ecol 18:117−123 Dell AI, Pawar S, Savage VM (2011) Systematic variation in the temperature dependence of physiological and ecological traits. Proc Natl Acad Sci USA 108:10591−10596 DeLong JP, Okie JG, Moses ME, Sibly RM, Brown JH (2010) Shifts in metabolic scaling, production, and efficiency across major evolutionary transitions of life. Proc N atl Acad Sci USA 107:12941−12945 Dugdale RC, Wilkerson FP (1998) Silicate regulation of new production in the equatorial Pacific upwelling. N ature 391:270−273 Ebersbach F, Trull TW, Davies DM, Bray SG (2011) Controls on mesopelagic particle fluxes in the Sub-Antarctic and Polar Frontal Zones in the Southern Ocean south of Australia in summer — perspectives from free-drifting sediment traps. Deep-Sea Res II 58:2260−2276 Eriksen R, Trull TW, Davies D, Jansen P, Davidson AT, Westwood K, van den Enden R (2018) Seasonal succession of phytoplankton community structure from autonomous sampling at the Australian Southern Ocean Time Series (SOTS) observatory. Mar Ecol Prog Ser 589:13−31 Falkowski PG, Barber RT, Smetacek V (1998) Biogeochemical controls and feedbacks on ocean primary production. Science 281:200−206 Fowler S, Knauer G (1986) Role of large particles in the transport of elements and organic compounds through the oceanic water column. Prog Oceanogr 16:147−194 Francois R, Honjo S, Krishfield R, Manganini S (2002) Factors controlling the flux of organic carbon to the bathy-
125
pelagic zone of the ocean. Glob Biogeochem Cycles 16: 34-1−34-20 Fukuchi M, Tanimura A, Hoshiai T (1979) N IPR-I, a new plankton sampler under sea ice. Bull Plankton Soc Jpn 26:104−109 Furuya K (1990) Subsurface chlorophyll maximum in the tropical and subtropical western Pacific Ocean: vertical profiles of phytoplankton biomass and its relationship with chlorophyll a and particulate organic carbon. Mar Biol 107:529−539 Gattuso JP, Peduzzi S, Pizay MD, Tonolla M (2002) Changes in freshwater bacterial community composition during measurements of microbial and community respiration. J Plankton Res 24:1197−1206 Giering SL, Sanders R, Lampitt RS, Anderson TL and others (2014) Reconciliation of the carbon budget in the ocean’s twilight zone. Nature 507:480−483 Gillooly JF, Brown JH, West GB, Savage VM, Charnov EL (2001) Effects of size and temperature on metabolic rate. Science 293:2248−2251 Gleiber MR, Steinberg DK, Schofield OME (2016) Copepod summer grazing and fecal pellet production along the Western Antarctic Peninsula. J Plankton Res 38:732−750 Glud RN (2008) Oxygen dynamics of marine sediments. Mar Biol Res 4:243−289 Gudasz C, Bastviken D, Steger K, Premke K, Sobek S, Tranvik LJ (2010) Temperature-controlled organic carbon mineralization in lake sediments. Nature 466:478−481 Harte J (2004) The value of null theories in ecology. Ecology 85:1792−1794 Henson SA, Sanders R, Madsen E (2012) Global patterns in efficiency of particulate organic carbon export and transfer to the deep ocean. Global Biogeochem Cycles 26: GB1028 Henson SA, Beaulieu C, Ilyina T, John JG and others (2017) Rapid emergence of climate change in environmental drivers of marine ecosystems. Nat Commun 8:14682 Hoppe HG, Breithaupt P, Walther K, Koppe R, Bleck S, Sommer U, Jürgens K (2008) Climate warming in winter affects the coupling between phytoplankton and bacteria during the spring bloom: a mesocosm study. Aquat Microb Ecol 51:105−115 Huntley ME, Lopez M (1992) Temperature-dependent production of marine copepods: a global synthesis. Am Nat 140:201−242 Hutchins DA, Fu F, Sedwick PN, Stehr G (2017) Microorganisms and ocean global change. Nat Microbiol 2:17058 IPCC (Intergovernmental Panel on Climate Change) (2014) Climate change 2014: synthesis report. Contribution of Working Groups I, II and III to the Fifth Assessment Report of the Intergovernmental Panel on Climate Change. IPCC, Geneva Iversen MH, Ploug H (2010) Ballast minerals and the sinking carbon flux in the ocean: carbon-specific respiration rates and sinking velocity of marine snow aggregates. Biogeosciences 7:2613−2624 Iversen MH, Ploug H (2013) Temperature effects on carbonspecific respiration rate and sinking velocity of diatom aggregates — potential implications for deep ocean export processes. Biogeosciences 10:4073−4085 Killen S, Atkinson D, Glazier D (2010) The intraspecific scaling of metabolic rate with body mass in fishes depends on lifestyle and temperature. Ecol Lett 13:184−193 Kiørboe T, Jackson GA (2001) Marine snow, organic solute plumes, and optimal chemosensory behavior of bacteria.
126
Aquat Microb Ecol 82: 111–127, 2018
Limnol Oceanogr 46:1309–1308 Kopczynska EE, Dehairs F, Elskens M, Wright S (2001) Phytoplankton and microzooplankton variability between the Subtropical and Polar Fronts south of Australia: thriving under regenerative and new production in late summer. J Geophys Res Oceans 106:31597−31609 Koski M, Boutorh J, de la Rocha C (2017) Feeding on dispersed vs. aggregated particles: the effect of zooplankton feeding behavior on vertical flux. PLOS ON E 12: e0177958 Krupke A, Hmelo LR, Ossolinski JE, Mincer TJ, Van Mooy BAS (2016) Quorum sensing plays a complex role in regulating the enzyme hydrolysis activity of microbes associated with sinking particles in the ocean. Front Mar Sci 3:55 Lara E, Arrieta JM, Garcia-Zarandona I, Boras JA and others (2013) Experimental evaluation of the warming effect on viral, bacterial and protistan communities in two contrasting Arctic systems. Aquat Microb Ecol 70:17−32 Laufkötter C, Vogt M, Gruber N (2013) Long-term trends in ocean plankton production and particle export between 1960−2006. Biogeosci Discuss 10:5923−5975 Laws EA, Archie JW (1981) Appropriate use of regression analysis in marine biology. Mar Biol 65:13−16 Laws E, Falkowski PG, Smith WO, Ducklow H, McCarthy JJ (2000) Temperature effects on export production in the open ocean. Global Biogeochem Cycles 14:1231−1246 Le Moigne FAC, Henson SA, Cavan EL, Georges C and others (2016) What causes the inverse relationship between primary production and export efficiency in the Southern Ocean? Geophys Res Lett 43:4457−4466 Legendre P, Legendre L (1998) Numerical ecology. Elsevier, Amsterdam López-Urrutia Á (2008) The metabolic theory of ecology and algal bloom formation. Limnol Oceanogr 53:2046−2047 López-Urrutia A, Morán XAG (2007) Resource limitation of bacterial production distorts the temperature dependence of oceanic carbon cycling. Ecology 88:817−822 López-Urrutia A, San Martin E, Harris RP, Irigoien X (2006) Scaling the metabolic balance of the oceans. Proc N atl Acad Sci USA 103:8739−8744 Maiti K, Charette MA, Buesseler KO, Kahru M (2013) An inverse relationship between production and export efficiency in the Southern Ocean. Geophys Res Lett 40: 1557−1561 Manganelli M, Malfatti F, Samo TJ, Mitchell BG, Wang H, Azam F (2009) Major role of microbes in carbon fluxes during austral winter in the Southern Drake Passage. PLOS ONE 4:e6941 Marsay CM, Sanders RJ, Henson SA, Pabortsava K, Achterberg EP, Lampitt RS (2015) Attenuation of sinking particulate organic carbon flux through the mesopelagic ocean. Proc Natl Acad Sci USA 112:1089−1094 Martin J, Knauler G, Karl D, Broenkow W (1987) VERTEX: carbon cycling in the north east Pacific. Deep-Sea Res 34: 267−285 Maske H, Cajal-Medrano R, Villegas-Mendoza J (2017) Substrate-limited and -unlimited coastal microbial communities show different metabolic responses with regard to temperature. Front Microbiol 8:2270 Mazuecos IP, Arístegui J, Vázquez-Domínguez E, OrtegaRetuerta E, Gasol JM, Reche I (2015) Temperature control of microbial respiration and growth efficiency in the mesopelagic zone of the South Atlantic and Indian Oceans. Deep-Sea Res I 95:131−138
McDonnell AMP, Boyd PW, Buesseler KO (2015) Effects of sinking velocities and microbial respiration rates on the attenuation of particulate carbon fluxes through the mesopelagic zone. Global Biogeochem Cycles 29: 175−193 McMeekin T, Olley J, Ratkowsky D, Corkrey R, Ross T (2013) Predictive microbiology theory and application: Is it all about rates? Food Control 29:290−299 Ochman H, Elwyn S, Moran NA (1999) Calibrating bacterial evolution. Proc Natl Acad Sci USA 96:12638−12643 Ottesen EA, Young CR, Gifford SM, Eppley JM and others (2014) Multispecies diel transcriptional oscillations in open ocean heterotrophic bacterial assemblages. Science 345:207−212 Padfield D, Lowe C, Buckling A, ffrench-Constant R and others (2017) Metabolic compensation constrains the temperature dependence of gross primary production. Ecol Lett 20:1250−1260 Ploug H, Grossart HP (2000) Bacterial growth and grazing on diatom aggregates: respiratory carbon turnover as a function of aggregate size and sinking velocity. Limnol Oceanogr 45:1467−1475 Ploug H, Iversen M, Fischer G (2008) Ballast, sinking velocity, and apparent diffusivity within marine snow and zooplankton fecal pellets: implications for substrate turnover by attached bacteria. Limnol Oceanogr 53:1878−1886 Pomeroy LR, Wiebe WJ (2001) Temperature and substrates as interactive limiting factors for marine heterotrophic bacteria. Aquat Microb Ecol 23:187−204 Pomeroy LR, Sheldon JE, Sheldon WM (1994) Changes in bacterial numbers and leucine assimilation during estimations of microbial respiratory rates in seawater by the precision Winkler method. Appl Environ Microbiol 60: 328−332 Regaudie de Gioux A, Duarte CM (2012) Temperature dependence of planktonic metabolism in the ocean. Global Biogeochem Cycles 26:GB1015 Richardson AJ (2008) In hot water: zooplankton and climate change. ICES J Mar Sci 65:279−295 Rintoul SR, Trull TW (2001) Seasonal evolution of the mixed layer in the Subantarctic zone south of Australia. J Geophys Res Oceans 106:31447−31462 Savage K, Davidson AE, Tang J (2013) Diel patterns of autotrophic and heterotrophic respiration among phenological stages. Glob Change Biol 19:1151−1159 Schindlbacher A, Echmeister-Boltenstern S, Jandl R (2009) Carbon losses due to soil warming: Do autotrophic and heterotrophic soil respiration respond equally? Glob Change Biol 15:901−913 Schramski JR, Dell AI, Grady JM, Sibly RM, Brown JH (2015) Metabolic theory predicts whole-ecosystem properties. Proc Natl Acad Sci USA 112:2617−2622 Shadwick EH, Trull TW, Tilbrook B, Sutton AJ, Schulz E, Sabine CL (2015) Seasonality of biological and physical controls on surface ocean CO2 from hourly observations at the Southern Ocean Time Series site south of Australia. Global Biogeochem Cycles 29:223−238 Simon M, Glöckner FO, Amann R (1999) Different community structure and temperature optima of heterotrophic picoplankton in various regions of the Southern Ocean. Aquat Microb Ecol 18:275−284 Steinberg DK, Van Mooy BAS, Buesseler KO, Boyd PW, Kobari T, Karl DM (2008) Bacterial vs. zooplankton control of sinking particle flux in the ocean’s twilight zone. Limnol Oceanogr 53:1327−1338
Cavan & Boyd: Effect of temperature on carbon export
127
Strzepek R, Maldonado M, Higgins J, Hall J, Safi K, Wilhelm S, Boyd P (2005) Spinning the ‘ferrous wheel’: the importance of the microbial community in an iron budget during the FeCycle experiment. Glob Biogeochem Cycles 19:GB4S26 Taucher J, Oschlies A (2011) Can we predict the direction of marine primary production change under global warming? Geophys Res Lett 38:L02603 Thomas MK, Kremer CT, Klausmeier CA, Litchman E (2012) A global pattern of thermal adaptation in marine phytoplankton. Science 338:1085−1088 Tiano L, Garcia-Robledo E, Revsbech N P (2014) A new highly sensitive method to assess respiration rates and kinetics of natural planktonic communities by use of the switchable trace oxygen sensor and reduced oxygen concentrations. PLOS ONE 9:e105399 Trimmer M, Grey J, Heppell CM, Hildrew AG, Lansdown K, Stahl H, Yvon-Durocher G (2012) River bed carbon and nitrogen cycling: state of play and some new directions. Sci Total Environ 434:143−158 Trull T, Rintoul SR, Hadfield M, Abraham ER (2001a) Circulation and seasonal evolution of polar waters south of Australia: implications for iron fertilization of the Southern Ocean. Deep-Sea Res II 48:2439−2466 Trull TW, Bray SG, Manganini SJ, Honjo S, François R (2001b) Moored sediment trap measurements of carbon export in the Subantarctic and Polar Frontal zones of the Southern Ocean, south of Australia. J Geophys Res
Oceans 106:31489−31509 Trull TW, Sedwick PN, Griffiths FB, Rintoul SR (2001c) Introduction to special section: SAZ Project. J Geophys Res Oceans 106:31425−31429 Volk T, Hoffert MI (1985) Ocean carbon pumps: analysis of relative strengths and efficiencies in ocean-driven atmospheric CO2 changes. In: Sundquist ET, Broecker WS (eds) The carbon cycle and atmospheric CO2: natural variations Archean to present. Geophysical Monograph Series Vol 32. American Geophysical Union, Washington, DC, p 99−110 West GB, Brown JH, Enquist BJ (1997) A general model for the origin of allometric scaling laws in biology. Science 276:122−126 Weston NB, Joye SB (2005) Temperature-driven decoupling of key phases of organic matter degradation in marine sediments. Proc Natl Acad Sci USA 102:17036−17040 Yvon-Durocher G, Allen AP, Montoya JM, Trimmer M, Woodward G (2010a) The temperature dependence of the carbon cycle in aquatic ecosystems. Adv Ecol Res 43: 267−313 Yvon-Durocher G, Jones JI, Trimmer M, Woodward G, Montoya JM (2010b) Warming alters the metabolic balance of ecosystems. Philos Trans R Soc B 365:2117−2126 Yvon-Durocher G, Caffrey JM, Cescatti A, Dossena M and others (2012) Reconciling the temperature dependence of respiration across timescales and ecosystem types. Nature 487:472−476
Editorial responsibility: Paul del Giorgio, Montreal, Quebec, Canada
Submitted: December 13, 2017; Accepted: September 13, 2018 Proofs received from author(s): October 17, 2018