EFFECT OF CHAR LAYER ON TRANSIENT THERMAL OXIDATIVE DEGRADATION OF POLYETHYLENE by
Javad A. ESFAHANI and Ali G. ABDOLABADI Original scientific paper UDC: 536.42:66.011:678.42 BIBLID: 0345-9836, 11 (2007), 2, 23-36
A transient one dimensional model has been presented to simulate degradation and gasification of polyethylene, in early stage of fire growth. In the present model effect of oxygen on degradation and rate of polymer gasification while the sample is subjected to an external radiative heat source is numerically investigated. This model includes different mechanism, which affect the degradation process, such as in depth thermal oxidative decomposition, in depth absorption of radiation, heat transfer, volatiles advection in solid phase and convective heat transfer on surface. Also effects of radiative parameters, due to formation of char layer such as surface reflectivity and absorptivity on thermal degradation of polyethylene are investigated. The results for 40 kW/m2 heat source are reported and yielded realistic results, comparing to the published experimental data. The results show that an increase in oxygen concentration leads to considerable increase in gasification rate and also leads to sharp increase of surface temperature. Key words: thermal oxidative degradation, polyethylene, reflectivity, absorptivity, absorption coefficient
Introduction
Polymeric material are increasingly common as components of furnishing, they constitute a substantial fraction of the fuel load in typical modern residential dwellings and other buildings. It is important to understand why these materials behave as they do in fire environment. Of particular interests are factors which control the rate of polymer gasification under transient heating such as occurs in initial stage of fire growth. According to Esfahani’s numerical study [1] the rate of gasification plays the major role in the ignition and combustion processes, thus any attempt for better understanding of gasification process and formulating the parameters affecting the rate of gasification would be of significant value in the development of fire detection and protection appliance. Although in the past decades, great advances in the field of thermal degradation of solid material have been made, only a few works have been published on the simultaneous thermal and oxidative degradation of solid material. For example the work of Hirata et al. [2] discusses various type of reaction mechanism in the polymer such as random scission initia-
DOI:10.2298/TSCI0702023E
23
THERMAL SCIENCE: Vol. 11 (2007), No. 2, pp. 23-36
tion and first order termination reaction in presence of oxygen. Kashiwagi and Ohlemiller [3] presented detailed experimental results of the oxygen effects on the rate of degradation of polyethylene (PE) and polymethyl methacrylate (PMMA). Bulter [4] proposed a mixed layer model to simulate surface regression, melting, and bubbling effects of degrading polypropylene sample, in her task [5], she presented a numerical model for combustion of bubbling thermoplastic in the microgravity atmosphere, however the oxygen effects on the rate of gasification were neglected in the mentioned model. The previous numerical works of Esfahani (1999-2004) [6] illustrated ignition of epoxy, in his other numerical task [7] the model of oxygen sensitive thermal degradation of PMMA was considered for first time, where the oxygen concentration on irradiated surface is assumed to be equal to the far ambient in order to skip the complexity of oxygen diffusive and volatile convective behavior. Esfahani and Kashani [8] presented a model for degradation and combustion of polymethyl methacrylate. Numerical simulation of thermal oxidative degradation of PE and effect of oxygen concentration on gasification, absoptivity and reflectivity of PE is the purpose of the present work. One dimensional model was used to predict thermal behavior of PE. This model includes different mechanisms which affects degradation process such as, in depth thermal oxidative decomposition, surface absorption and reflection of radiation, in depth absorption of radiation, conductive heat transfer, volatiles advection in solid phase, radiation from surface, and convective heat transfer on surface. Specific feature of the present work compare to all previous studies is char layer process, while extends applicability of the previous work regarding oxidative degradation [7]. Physical model
Physical model is gotten from Kashiwagi experimental work [3]. A piece of solid fuel (PE) is placed vertically and exposed to high radiative heat source from it left side while both sides are cooled by natural convection flow, therefore two boundary layer formed adjacent to the walls of sample. Length, height, and width of sample are 15 mm, 100 mm, 100 mm, respectively. Height and width of sample are about 6 times bigger than the length, so effect of these two dimensions in comparison with length of sample is negligible. This effect is presented in Esfahani’s work [9]. The specimen is assumed to be in thermal balance with the ambient air before onset of heat radiation. To circumvent the complexity of the problem, effect of volatiles advection on oxygen distribution on PE surface has not been considered so the oxygen concentration on sample surface is assumed to be constant. This is particularly true when the mass flux of volatiles is small. As it can be seen in Kashiwagi experimental work [3], maximum value of mass flux that leaves PE surface is 0.5 mg/scm2, which is about 30% of PMMA mass flux. As the sample is being heated by external source, a portion of input energy is absorbed in depth by the sample and rest of it is reflected by PE surface. Besides, the degradation mechanism is activated through out the sample and release volatiles which form bubbles moving to the irradiated surface. With oxygen in the gas phase the sample behaves similarly to that in nitrogen environment until the first appearance of volatiles in 24
Esfahani, J. A., Abdolabadi, A. G.: Effect of Char Layer on Transient Thermal Oxidative ...
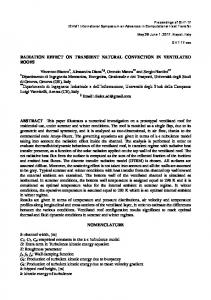
the solid phase. Shortly there after the color of the surface starts to turn brown and some bubbles are also observed. The surface color is darker with increasing oxygen content in the gas phase. A schematic of the problem geometry is depicted in fig. 1.
Figure 1. Physical configuration of the degradation problem
Assumption
Surface regression, storage of mass or energy, melting and dynamics of bubble movement are neglected in the present model. In addition all thermal properties of the fuel sample assumed to be fixed during the process. Oxygen concentration on sample surface is assumed to be constant. The length of the solid fuel is fixed and no thermal contraction or expansion is considered as time elapses in order to simplify the simulation. The virgin sample is assumed to be gray so absorptivity and emissivity are equal. Mathematical model
The mathematical model follows the frame work of Esfahani [8] to simulate Kashiwagi and Ohlemiller’s experimental studies [3] and is largely based on the model proposed by Ohlemiller [10]. According to Kashiwagi’s finding [3] the rate of transient gasification can not be described simply as a function of surface temperature or proportional to energy input, in addition a model for predicting the gasification rate should include condensed phase oxidative chemical reactions. Despite this monitored significant findings, necessary improvements in modeling of gasification rate have not been taken for the last several decades. Brown and Kashiwagi [11] demonstrated that the greater amount of oxygen at the interface increases random scissions and generation of functional groups by which the transient gasification rate is enhanced. Therefore a proposed modified Arrhenius type
25
THERMAL SCIENCE: Vol. 11 (2007), No. 2, pp. 23-36
function has been utilized for PMMA in the previous work of Esfahani [7] which is extended for PE here. Similarly rate of gasification of PE is formulated as below: -
m" = Ase
Es RTs
r s ( a + YOsurf ) n
(1)
In the present work a and n are found as follow: a = 1.5
and
n = 0.8
The term in parenthesis in Arrhenius equation is the oxygen consideration factor. As the sample starts to degrade, released volatiles constitute bubbles, which grow and leave toward the direction imposing less resistance. The flux of these volatiles is calculated by integrating the gasification rate over solid region: x
v l = ò m"dx
(2)
- ls
Surface absorption term is considered as a source term in the boundary condition and formulated as below: S = I0 a(1 – r)
(3)
where I0 and S are the intensity of radiative heat source and energy which is absorbed by char layer, on sample surface layer, respectively. Physical model of above formulation can be seen in fig. 2. Radiative heat flux which enters the depth of PE can be formulated as below: I = I0(1 – r)(1 – a)
(4)
The absorption of radiation in depth of solid is formulated by the Beer’s law and has the following form: dI s = I b s e bs x dx Figure 2. Schematic of surface absorption and reflection
26
(5)
where I is the intensity of the radiative heat source, which enters the PE, and bs is the absorption coefficient.
Esfahani, J. A., Abdolabadi, A. G.: Effect of Char Layer on Transient Thermal Oxidative ...
Advection of volatiles, diffusion, and absorption of radiation and heat of degradation are mechanism dominating the energy conservation in the solid fuel and could be formulated in the following one dimensional form [7]: ¶T ¶T ö ¶ ¶ Ts dI s æ cs ç r s s + us s ÷ = k s + + m¢¢ L ¶ t ¶ x ¶ x ¶x dx è ø
(6)
Boundary conditions for above partial differential equation are: x = 0 -k s
¶T 4 - T 4 ) + h (T + es (Tsurf 4 c surf - T4 ) + S = 0 ¶x
(7)
x = ls
¶T = es (Tx4= l - T44 ) + hc (Tx = ls - T4 ) s ¶x
(8)
t =0
-k s
T = T4 (9)
where hc, Ts, and T4 are convective heat transfer coefficient on sample surface, surface temperature, and ambient temperature, respectively. Convective heat transfer coefficient is defined by Newton cooling law [12]. Using constant properties of air, convective heat transfer coefficient takes the following form: hc = 1.87(Ts – T4)0.25
(10)
As it was mentioned, color of sample surface turns brown, due to existence of oxygen. Change in color of surface leads to change in absorptivity and reflectivity of sample surface. Therefore, in the present work, absorptivity and reflectivity coefficient of PE surface are defined as a function of surface temperature and oxygen concentration, and are formulated as follow: c2
a = c1e Tsurf -T4 (e c3YO surf - 1)
(11)
c5
r = 1 - c4e Tsurf -T4 (e c6YO surf - 1) r0 where a, r, YOsurf , and r0 are absorptivity and reflectivity of sample surface, oxygen concentration adjacent to sample surface, and initial value of reflectivity, respectively. Value of constants in eqs. 11 and 12 are given in tab. 1. First exponent in eqs. 11 and 12 shows transient effect of char
(12)
Table 1. Constant values of eqs. (11) and (12) c1
c2
c3
c4
c5
c6
810
3600
4
1000
2800
2
27
THERMAL SCIENCE: Vol. 11 (2007), No. 2, pp. 23-36
layer formation causes variation of reflectivity and absorptivity of PE surface, which depends on temperature variation. Term in parenthesis shows that, if oxygen concentration is equal to zero, darkening of surface layer will not occur. Numerical model
The governing partial differential equations are discretized by utilizing the control volume formulation over the staggered grid region. A linearized equation is solved by using a fast iterative TDMA method [13]. In each time step, iteration will Table 2. Physical, thermal, and kinetics constants be done to achieve a proper converProperty Value Unit Reference gence of (0.001 K) for energy equa3 tion. The mentioned computational rs 801 kg/m [14] process will be repeated in each cs 2300 J/kgK [14] time step and continues to the final ks 0.33 W/m2K [14] stage of the problem. The number of allocated nodes in solid phase is 501 L 414 kJ/mol [14] with time step of 0.1 s. bs 2300 l/m [14] Properties of PE and other rated e 0.88 – [15] coefficient are selected from [3], [14], [15], and [16]. Data given in r0 0.12 – [15] tab. 2, have been applied to the nuAs 3·1016 l/s [16] merical model and assumed to be Es 2640 kJ/kg [16] constant. Results
Figure 3. Mass flux for different oxygen concentration
28
Figure 3 presents variation of mass flux at irradiation 40 kW/m2. It can be seen that, degradation process for external source of 40 kW/m2 begins at 85 s after irradiation of heat source. Mass flux suddenly increases at 96 s after irradiation for oxygen concentration of 40%. This sharp increase in mass flux occurs at 110 s after irradiation for 20% O2 and coincides with the start time of the color change in the surface layer. As it can be seen in fig. 3, flux of volatiles leaving the interface is influenced by oxygen concentration. The lowest curve corresponds to
Esfahani, J. A., Abdolabadi, A. G.: Effect of Char Layer on Transient Thermal Oxidative ...
0.0% O2. This effect is explained in the context of modeling and expected regarding affiliation of modified Arrhenius function to oxygen content at interface. These results are harmony with Kashiwagi and Ohlemiller findings [3]. Variation of surface temperature for different oxygen concentration is depicted in fig. 4. As results show in fig. 4, surface temperature tends to higher plateau as oxygen concentration increases. According to the role of gasification, increase in oxygen concentration leads to higher rate of gasification, so more amount of absorbed Figure 4. Surface temperature for different oxygen concentration heat is consumed for degradation. Beside of it, more increase in absorptivity of surface due to increase in oxygen concentration leads to more amount of heat absorption in the sample surface which correspond to experimental data. These two phenomena have opposite effect on surface temperature. But increase in surface absorptivity seems to be more effective. Therefore, as results show surface temperature increases due to increases in oxygen concentration. Also it can be found from the results in fig. 4, there is a sharp increase in surface temperature for oxygen concentration of 40 and 20%. For 40% O2 surface temperature increases suddenly from 650 to 740 K at 96 s after irradiation, for 20% O2 surface temperature increase suddenly from 650 to 715 K at 110 s after irradiation. Darkening of PE surface due to existence of oxygen in the ambient air is reason of this phenomenon. There is no sudden increase in surface temperature for 0.0 and 10% O2. Results of surface temperature, which are obtained from numerical model, are compared with experimental data [3] in tab. 3. As it can be seen in tab. 3, that predicted results are in the range of experimental values with the maximum deviation of 1.5% for surface temperature. Table 3. Comparison of surface temperature at final stage which is obtained from numerical model and experimental data [3] Oxygen concentration
Experimental [K], [3]
Numerical [K]
Difference
0.0%
680
685
0.7%
10%
680
690
1.5%
20%
705
715
1.4%
40%
730
740
1.3%
29
THERMAL SCIENCE: Vol. 11 (2007), No. 2, pp. 23-36
In figs. 5 and 6 temperature profile within the solid fuel has been plotted for different time after irradiation. Figures 5 and 6 shows result for 0.0 and 40% oxygen concentration, respectively. It can be found by comparing these two figures that temperature distribution in PE does not vary with changing in oxygen concentration until 65 s after irradiation. This means that surface of PE has not had any change in color until that time. Also it can be seen that, the back Figure 5. Temperature profile in PE for different side of sample, has temperature of 330 K at 170 s after irradiation for time after irradiation at 0.0% oxygen 0.0% O2 and 305 K at 110 s after irradiation for 40% O2. Different exposure time, absorptivity, and reflectivity for 0.0 and 40% oxygen concentration are reasons of this difference. As it can be seen in experimental data [3], irradiation time for 40 and 0.0% oxygen concentration is 110 and 170 s, respectively. If irradiation continues, surface of PE is going to be molten. So test should be terminated before downward flow of molten surface. For 40% oxygen, melting of surface occurs more quickly than 0.0% oxygen concentration. According to fig. 4, surface Figure 6. Temperature profile in PE for different temperature of PE for 40% oxygen is time after irradiation at 40% oxygen higher than surface temperature for 0.0% oxygen concentration, so melting of surface layer happens sooner for 40% oxygen, therefore test must be finished in advance. Effect of absorption coefficient on surface temperature of PE is indicated in figs. 7 and 8. Figure 7 shows result for oxygen concentration of 40% and fig. 8 is for 0.0% oxygen concentration. It can be seen in fig. 7 that for bs of 2300 m–1 surface temperature will be 740 K after 104 s of irradiation. By increasing bs from 2300 to 4000 m–1, energy which is absorbed by the layer near PE surface will increase, therefore surface temperature increases more quickly and it will be 740 K after 97 s of irradiation. Surface temperature
30
Esfahani, J. A., Abdolabadi, A. G.: Effect of Char Layer on Transient Thermal Oxidative ...
Figure 7. Variation of surface temperature via time for different values of absorption coefficient and oxygen concentration of 40%
Figure 8. Variation of surface temperature via time for different values of absorption coefficient and oxygen concentration of 0.0%
Figure 9. Variation of surface temperature via time for different values of surface emissivity and oxygen concentration of 40%
31
THERMAL SCIENCE: Vol. 11 (2007), No. 2, pp. 23-36
reaches 740 K after 112 s for bs of 1000 m–1. The same results are yielded for oxygen concentration of 0.0% in fig. 8. Surface temperature after 170 s irradiation is 650, 675, and 680 K for bs of 1000, 2300, and 4000 m–1, respectively. When bs increases, most of energy is absorbed in the layer near surface, therefore temperature of surface increases, but when bs decreases, amount of energy which enter PE, diffuse to the deeper layer and it is distributed more in depth of PE, so surface temperature decreases when bs decreases. Figures 9 and 10 show surface temperature variation via time of radiation for different values of surface emissivity. Figure 9 shows results for 40% oxygen and fig. 10 for 0.0% oxygen concentration. When emissivity increases, amount of heat which leave PE surface by means of radiation, increases, therefore surface temperature decreases and vice versa. It can be seen in fig. 9 that surface temperature reaches 740 K after 96, 104, and 108 s for surface emissivity coefficient of 0.7, 0.88, and 1.00, respectively. The Major Figure 10. Variation of surface temperature via effect of increase in emissivity is detime for different values of surface emissivity and lay in time of reaching maximum oxygen concentration of 0.0% surface temperature. For oxygen concentration of 0.0% variation of surface temperature via time for different values of emissivity is yielded in fig. 10. It is found that, change in emissivity from 0.88 to1.00 decrease maximum surface temperature from 675 to 670 K and reduction of it from 0.88 to 0.7 shifts maximum surface temperature from 675 to 685 K. Temperature distribution in PE sample at final stage 110 s after irradiation is depicted in fig. 11 for different values of absorption coefficient and oxygen concentration of 40%. It can be seen that by decreasing bs from 2300 to 1000 m–1 heat absorption in Figure 11. Temperature profile for different values of absorption coefficient and oxygen concentration layers adjacent to surface decreases, of 40% therefore temperature profile from 32
Esfahani, J. A., Abdolabadi, A. G.: Effect of Char Layer on Transient Thermal Oxidative ...
surface to the depth of 2.5 mm falls to the lower values as compared to temperature profile of bs = 2300 m–1 and it shifts up to the higher temperature from depth of 2.5 mm to the back side of sample. Increase in bs from 2300 to 4000 m–1 leads to minor change of temperature in depth of PE sample. Figure 12 shows temperature profile in PE sample at final stage 170 s after irradiation for different values of absorption coefficient and oxygen concentration of 0.0%. By increasing bs from 2300 to 4000 m–1, heat absorption coeffiFigure 12. Temperature profile for different values cient at PE surface increases, of absorption coefficient and oxygen concentration therefore maximum temperature of 0.0% occurs at surface. By decreasing absorption coefficient, radiation can diffuse to the deeper layer of PE and maximum temperature shifts to the depth of sample. Also it can be seen in fig. 12 that decrease in bs from 2300 to 1000 temperature profile from surface to depth of 1 mm falls to the lower values as compared to temperature profile of bs = 2300 m–1 and it shifts up from depth of 1 to 15 mm to higher temperature. Figure 13 shows variation of surface absorptivity via time of irradiation for different values of absorption coefficient and oxygen concentration of 40%. For bs of 4000, 2300, and 1000 m–1 surface absorptivity varies from 0 to 0.7, 0.68, and 0.22, respectively.
Figure 13. Variation of surface absorptivity for different values of absorption coefficient and oxygen concentration of 40%
33
THERMAL SCIENCE: Vol. 11 (2007), No. 2, pp. 23-36
Considerable variation of surface absorptivity (gradient = 0.01 s–1) begins at 79, 90, and 107 s for bs of 4000, 2300, and 1000, respectively. Conclusions
At the present work an oxidative-thermal degradation model is developed, that highlights the effect of oxygen concentration and radiative parameters such as emissivity, absorptivity, and reflectivity on rate of gasification. Also variations of reflectivity and absorptivity of sample surface were presented in order to fulfill the surface darkening effect. The following conclusion can be drawn based on the model: – a modified Arrhenius type function was presented which comprise oxidative degradation PE sample exposed to the radiative source of 40 kW/m2, – an increase in oxygen concentration substantially increases the rate of gasification, – an increase in the oxygen concentration leads to increase in absorptivity due to darkening of PE surface, – increase in mass flux due to increase in oxygen concentration and increase in absorptivity of PE surface are two factors which are in competition with each other, The first one reduce the temperature and the second one increase the temperature, but increase in absorptivity is more effective, therefore temperature profile shift up due to increase in oxygen concentration, – sharp increase of surface temperature was found for oxygen concentration of 40 and 20%. But this sharp increase is more considerable in 40% oxygen. Darkening of PE surface due to existence of oxygen in the ambient air is reason of this phenomenon, – the predicted results are in the range of experimental values with the maximum deviation of 1.5% for surface temperature, – when emissivity increases, amount of heat which leave PE surface by means of radiation, increases, therefore surface temperature decreases and vice versa, and – by increasing bs, heat absorption in layers adjacent to surface increases, therefore temperature profile from surface to the depth of 1.5 mm shifts up to the higher values and it falls to the lower temperature from depth of 1.5 mm to depth of 15 mm. Reduction of bs leads to increase of temperature in depth of PE sample. Despite of complexity of PE degradation process, simplified model which is used in the present work to simulate this process seems to be successful. The model shows deviation from the experimental results and needs further improvement in the future, however it can still describe the general trend of the physical processes and has the advantage of being very simple and results could be achieved with reasonable accuracy and quickness. Nomenclature As cs
34
– pre-exponential factor of reaction, [s–1] – specific heat of solid-phase, [Jkg–1K–1]
Esfahani, J. A., Abdolabadi, A. G.: Effect of Char Layer on Transient Thermal Oxidative ...
Es hc I0 ks L ls m" q" R r r0 T t v x YOsurf
– activation energy, [Jkg–1] – convection heat transfer coefficient, [Wm–2K–1] – intensity of radiative heat source, [Wm–2] – thermal conductivity of solid-phase, [Wm–2K–1] – heat of degradation, [kJmol–1] – length of solid fuel, [m] – rate of gas production in each cell, [kgm–2s–1] – heat flux, [Wm–2] – gas constant, [kJkg–1K–1] – reflectivity, [–] – reflectivity of virgin material, [–] – temperature, [K] – time, [s] – local mass flux of volatiles, [kgm–2s–1] – coordinate [m] – oxygen mass fraction on surface, [–]
Greek letters
a bs e rs s
– – – – –
absorptivity of PE, [–] absorption coefficient of solid PE, [m–1] emissivity, [–] density of solid, [kgm–2] Stefan-Boltzmann constant, [–]
Subscripts
c e l r s O surf
– – – – – – –
conducted emitted local reflected solid oxygen surface
References [1] Esfahani, J. A., Sousa, A. C. M., Lopes, A. M. G., Numerical Modeling of Ignition by Radiation for a Cellulosic Material, in: Computational Modeling of Free and Moving Boundary Problems III, (Eds. L. C. Wrobel, B. Sarter, C. A. Brebbia), Computational Mechanics Publications, Southampton, UK, 1995, pp. 327-334 [2] Hirata, T., Kashiwagi, T., Brown, J. E., Thermal and Oxidative Degradation of Polymethyl Methacrylate: Weight Loss, Macromolecules, 18 (1985), 7, pp. 1410-1418 [3] Kashiwagi, T., Ohlemiller, T. J., A Study of Oxygen Effects on Nonflaming Transient Gasification of PMMA and PE during Thermal Degradation, Proceedings, 19th Symposium (Int.) on Combustion (1982), The Combustion Institute, Pittsburgh, Pa., USA, 1983, pp. 815-823 [4] Butler, K. M., A Mixed Layer Pyrolysis Model for Polypropylene, Proceedings (Ed. M. Curtat), 6th International Symposium, 2000, Intl. Assoc. for Fire Safety Science, Boston, MA, USA, pp. 313-324
35
THERMAL SCIENCE: Vol. 11 (2007), No. 2, pp. 23-36
[5] Butler, K. M., A Numerical Model for Combustion of Bubbling Thermoplastic Materials In Microgravity, Fire Research Division, Building and Fire Research Laboratory, National Institute of Standards and Technology, Gaithersburg, Md., USA, 2002 [6] Esfahani, J. A., Sousa, A. C. M., Ignition of Epoxy by a High Radiation Source, A Numerical Study, Int. J. Thermal Science, 38 (1999), 4, pp. 315-323 [7] Esfahani, J. A., Oxygen-Sensitive Thermal Degradation of PMMA: A Numerical Study, Combustion Science and Tech., 174 (2002), 10, pp. 183-198 [8] Esfahani, J. A., Kashani, A., A Numerical Model for Degradation and Combustion of Polymethyl Methacrylate (PMMA), Journal of Heat & Mass Transfer, 42 (2006), 6, pp. 569-576 [9] Eshafani, J. A., Ayani, M. B., Bakhtshirin, M., A Transient Two Dimensional Model of Thermal and Oxidative Degradation of PMMA, Iranian Journal of Science & Technology, Transaction B, Engineering, 29 (2005), No. B2, pp. 207-218 [10] Ohlemiller, T. J., Modeling of Smoldering Combustion Propagation, Progres in Energy Combustion Science, 11 (1985), 4, pp. 277-310 [11] Brown, J. E., Kashiwagi, T., Gas Phase Oxygen Effect on Chain Scission and Monomer Content in Bulk Poly (Methyl Methacrylate) Degraded by External Thermal Radiation, Polymer Degradation and Stability, 52 (1996), 1, pp. 1-10 [12] Kreith, F., Bohn, M. S., Principle of Heat Transfer, Proceedings, 5th ed., PWS Publishing Co., Minneapolis, Minn., USA, 1997 [13] Braaten, M. E., Shyy, W., Study of Pressure Correction Methods with Multigrid for Viscous Flow Calculation in Non Orthogonal Curvilinear Coordinates, Numerical Heat Transfer, Part A, 11 (1987), 4, pp. 417-442 [14] Pal, C., Macskasy, H., Plastics and Their Behavior in Fire, Elsevier Sciense Publishers, 1991 [15] Hallman, J., Welker, J. R., Sliepcevich, C. M., Polymer Surface Reflectance –Absorptance Characteristics, SPE Journal,14 (1974), 10, pp.717-723 [16] Lengelle, G., Thermal Degradation Kinetics and Surface Pyrolysis of Vinyl Polymer, AIAA Journal, 8 (1982), 11, pp. 1989-1996
Authors' address: J. A. Esfahani, A. G. Abdolabadi Mechanical Engineering Department, Faculty of Engineering, Ferdowsi University P. O. Box 91775-1111, Mashad, Iran Coresponding author J. A. Esfahani E-mail:
[email protected] or
[email protected]
Paper submitted: February 20, 2006 Paper revised: March 30, 2006 Paper accepted: May 1, 2006
36