2Sony Computer Science Laboratories, 3-14-13, ... The BA model [6, 7] proposed by Barabási and Albert was the first simple model of network ... (Color online).
Effect of coagulation of nodes in an evolving complex network Wataru Miura1 , Hideki Takayasu2,3 , and Misako Takayasu1 1
Department of Computational Intelligence and Systems Science, Interdisciplinary Graduate School of Science and Engineering, Tokyo Institute of Technology, 4259-G3-52, Nagatsuta-cho, Midori-ku, Yokohama 226-8503, Japan 2
Sony Computer Science Laboratories, 3-14-13,
Higashigotanda, Shinagawa-ku, Tokyo 141-0022, Japan 3
Meiji Institute of Advanced Study of Mathematical Sciences, Meiji University, 1-1-1 Higashimita, Tama-ku, Kawasaki 214-8571, Japan
Abstract We propose a new type of stochastic network evolution model based on annihilation, creation, and coagulation of nodes, together with the preferential attachment rule. The system reaches a unique quasi-statistically steady state in which the distribution of links follows a power law, lifetime of nodes follows an exponential distribution, and the mean number of links grows exponentially with time. The master equation of the model is solved analytically by applying Smoluchowski’s coagulation equation for aerosols. The results indicate that coagulation of nodes in complex networks and mean field analysis of aerosols are similar in both the growth dynamics with irreversible processes and in the steady state statistics. We confirm that the basic properties of the model are consistent with the empirical results of a business transaction network having about one million firms.
1
Recently, network structures are attracting much attention among physicists because such structures are considered to be gateways for clarifying complex inhomogeneous interactions among many elements. The scale-free network [1–5] is one of the universal key words in this area of study, where the distribution of the number of links, called the degree distribution, follows a power law. The BA model [6, 7] proposed by Barab´asi and Albert was the first simple model of network growth realizing a power law, introducing the concept of preferential attachment, that is, a new link is more likely to be attached to a node having a larger number of links, and many variant models have since been introduced [6–12]. Although the original BA model is applicable only for a monotonically growing network, Moore et al. introduced annihilation of nodes, and a power-law degree distribution was shown to be realized when the rate of creation outweighs that of annihilation [11]. Moore’s model has wider applicability; however, the model can explain only power-law degree distributions with exponents larger than 3. In the real world, there are cases in which nodes appear and disappear like the situation in Moore’s model, but the degree distributions follow power laws with exponents smaller than 3, as in the case of business firm networks [13]. In the case of a business relationship network in Japan, it is confirmed that the cumulative degree distributions clearly follow power laws with exponents of about 1.3 (i.e., the probability density exponent is 2.3) for both the money flow network and for its conjugate, the material flow network [13]. Therefore, we need a new model to understand the power laws. The particle models of aerosol and colloids extensively studied around 1990 provide new insights into the mechanism of power-law mass distribution [14–18]. In these models, the statistically steady state is realized by the balance of particle numbers: increase of particles by continuous injection of small particles and decrease of particle numbers by coagulation. In the process of coagulation, the mass of the aggregated particle equals the sum of the initial two particles. In this case, the mass distribution in the steady state follows a power law with an exponent in a wide range, which depends on the collision probability [19, 20]. Here, we propose a new model of network growth that considers the coagulation process of nodes corresponding to the merger of firms, in addition to annihilation and creation. Similar ideas of merging nodes have already been considered in the study of complex networks for the purpose of coarse graining the structure of networks [21–23]. However, here we introduce 2
10
0
10
10 10 10
-1
g(k)
CDF
10
0
-2
10 10
-3
(a) 10
-4
0
40
80
120
-2
-4
10
Lifetime [year]
(b)
-6 0
10
1
10 k
2
10
3
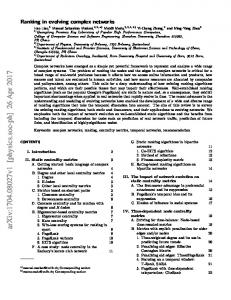
FIG. 1. (Color online). (a) Cumulative distribution of firm lifetime as a semi-log plot (the dotted line gives exp(−t/18.8)), and (b) the rate of preferential attachment defined by Eq. (1) in a log-log plot (blue circles for in-degrees and red crosses for out-degrees; the dotted line indicates the relation with α = 2).
the real merging of nodes as in the coagulation of aerosol masses. By solving the model both numerically and analytically, we identify in this letter that the role of coagulation of nodes is essential in the steady power law distribution of the number of links for cases such as the power-law mass distribution of aerosols. We start with a data analysis of the network structure of business relationships. The data is provided by the Japanese governmental Research Institute of Economy, Trade & Industry (RIETI) and was collected by a credit reporting agency in Japan, Tokyo Shoko Research, around the year 2005. It covers nearly all active firms in Japan, and the relationships are represented by a network diagram: the number of nodes is N = 961, 318, and the number of directed links, showing the business partnerships representing money flows, is L = 3, 783, 711. The first step toward construction of a growth model of networks is to observe the distribution of firms’ lifetimes. In Fig. 1(a) the cumulative distribution of lifetimes is plotted in semi-log scale, which shows it is well characterized by an exponential function, P (≥ t) ∝ exp(−t/τ ), where τ = 18.8 years is the characteristic decay time. There is a cut-off at a lifetime of 137 years simply because the credit reporting agency started data collection in 1868. This exponential distribution is roughly consistent with the simple assumption that a firm disappears randomly following a Poisson process. 3
As a second step, we observe the effect of preferential attachment. To observe the preferential attachment rate from the data, we categorize the business firms in the network into two groups: old firms (those founded before 2004) and new firms (those founded 2004 or after). We construct the network structure with the old firms and check the degrees of business partners one by one for each entry of a new firm to determine Q(k), the probability of connecting to an old firm with degree k in the money flow network representation. Then, we divide this probability by N (k), the number of nodes with degree k, and the preferential attachment rate Π(ki ) is defined as Q(k)/N (k). We observe the following integrated attachment rate function to reduce fluctuation, as introduced by Jeong et al [24]; ∫
κ(k) = 0
k
Π(k)dk ∼ k α .
(1)
As shown in Fig. 1(b), the obtained κ(k) is approximated by power laws for both in-degree and out-degree with exponents αin = 2.09 and αout = 2.05, which are close to 2, demonstrating that the preferential attachment rate is actually proportional to the average number of links for real business firms. The third step is to observe the relation between number of links and lifetime. In Fig. 2(a), the value of degrees averaged over the bins of lifetime is shown as a function of lifetime in semi-log plot; the results imply that the degree grows exponentially with lifetime, k(t) ∝ exp(At), where A = 0.017. This exponential growth observed in the real network is not consistent with that of the BA model, in which the mean degree is known to grow proportionally to the square root of the lifetime [6]. Combining the above two empirical exponential relations, we can naively derive a powerlaw cumulative degree distribution P (≥ k) ∝ k −β , where β = 1/(Aτ ), β = 3.1; however, this value is not consistent with the exponent for the real degree distribution, β = 1.3, as shown in Fig. 2(b). Apparently, the combined effects of random annihilation and growth by preferential attachment are not sufficient to capture the scale-free nature of a network in the real world. For this reason, we add one more effect to the evolution of the network, that is, the merger of two business firms or the purchase of a small firm by a big firm, both represented by node-node coagulation in the network representation, as schematically shown in Fig. 3(a). We now introduce a simplified model of the growth of a business network in the following way. We start with N0 nodes with any configuration of links and evolve the system by 4
10
(a)
10 10 CDF
Degree
2
10 8
10
6
10
4
10 0
40
80
10
120
0
-2 -3 -4 -5 -6
10
Lifetime [year]
(b)
-1
0
10
1
2
10 Degree
10
3
FIG. 2. (Color online). (a) Relation between lifetime and average degree in a semi-log plot (blue circles for in-degrees and red crosses for out-degrees; the dotted line shows exponential growth exp(0.017t)) and (b) the cumulative distribution of degrees in a log-log plot (blue line for in-degrees and red dotted line for out-degrees; the black dotted line indicates a power law with β = 1.3).
choosing one of the following three events stochastically for T time steps. Annihilation: A randomly chosen node is removed, along with all links connected to this node. Creation: A new node having two links (one is an out-link and the other is an in-link) is added. Each link is connected to a node chosen randomly following the preferential attachment. Coagulation: A randomly chosen node is merged with a partner node randomly chosen following the preferential attachment. All the links connected to the nodes are also rewired to the partner node. If two identical links appear after this rewiring, those identical links are merged to produce a single link. The occurrence probabilities of these events are a, b, and c, respectively, satisfying a + b + c = 1. This is because the number of nodes decreases in the event of annihilation and coagulation, whereas it increases in the event of creation. An additional condition, b = a + c = 0.5, is required to realize a kind of statistically steady state in the number of nodes; without this condition, the number of nodes would either monotonically decrease or increase on average. In this model, we define the preferential attachment rate to be proportional to the degree plus 1, which makes it possible for an isolated node to grow. Fig. 3(b) and (c) show numerical simulation results for the case of c = 0.3, the initial 5
FIG. 3. (Color online). (a) Schematic figures showing the three basic processes for nodes: annihilation, creation, and coagulation. Links are gathered in the coagulation processes. (b) Numerical results in the case of c = 0.3, N0 = 105 , T = 107 . Examples of the time evolution of the cumulative distribution of the number of links in a log-log plot. Solid lines show the time evolution starting with all isolated nodes, t = 5 × 10⁵ (light-blue line) and t = 107 (blue line). Dotted lines show the time evolution starting with the complete graph, t = 2 × 10⁶ (orange dotted line), t = 107 (red dotted line). The black dotted line is a guide to the eye consistent with the power law shown in Fig. 2(b). (c) Lifetime and average degrees under the same conditions with Fig. 3(b) in a semi-log plot corresponding to Fig. 2(a) (blue circles for in-degrees and red crosses for out-degrees; the dotted line indicates an exponential growth equivalent to exp(2.3 × 10⁻⁶ t)) corresponding to the value A = 0.017 in the real network. (d) Cumulative distribution of number of links in the steady state for general cases with N0 = 104 from an ensemble average of 10 realizations. Analytical solutions are plotted as dotted lines and Monte Carlo simulation results are plotted as solid lines, with c = 0 (no coagulation) in orange, c = 0.1 in pink, c = 0.2 in light blue, c = 0.3 in green, c = 0.4 in red, and c = 0.5 (maximum coagulation) in blue. The black dashed lines indicate the two analytical solutions in the limit of infinite nodes.
6
number of nodes N0 = 105 , and the number of time steps T = 107 . Due to the effects of the random occurrence of annihilation and coagulation, the distribution of the lifetime of nodes is confirmed to follow an exponential distribution with a factor 5.02 × 10⁻⁶ . By comparing the exponent with that of the real network already shown in Fig. 1(a), we can estimate that one year in the real network corresponds to 10,600 steps in our simulation. The time evolution of the distribution of the number of links is shown in Fig. 3(b), starting with two extreme initial link configurations: all bare nodes having no links, and the complete network, that is, all pairs of nodes are linked in both directions. We can observe that the effect of the initial condition gradually vanishes and the statistics of links converge to those of a steady state by time step 107 . In the steady state, the link number distributions both for in-links and out-links follow power laws with exponent about 1.3, consistent with the real network. As shown in Fig. 3(c), we can confirm that the basic property of exponential growth of the mean number of links is reproduced automatically in this steady state. The steady state distribution depends on the value of coagulation rate parameter c, as shown in Fig. 3(d). For small values of c, the link number distribution converges to a distribution close to an exponential distribution, whereas for larger values of c, the steady distribution is well approximated by a power law. We can show this basic property analytically by solving the master equation for the in-degree probability density at time t, P (k, t): (
[
)
]
k 1 k+1 P (k, t) P (k, t + 1) − P (k, t) =a P (k + 1, t) − + N N N [ ] (k − 1) + 1 k+1 δk,1 +b ∑ P (k − 1, t) − ∑ P (k, t) + N j (kj + 1) j (kj + 1) [
+c
k ∑
k0 =0 ∞ ∑
∞ ∑ 2k 0 + 1 2k 0 + 1 P (k 0 , t) − P (k 0 , t) P (k, t) ∑ (2k + 1) (2k + 1) 0 j j j j k =0
P (k − k 0 , t) ∑
]
2k + 1 − P (k 0 , t) ∑ P (k, t) . j (2kj + 1) k0 =0 Here, the effects of the three basic processes, annihilation, creation, and coagulation, have coefficients a, b, and c, respectively, in the right-hand side. This equation belongs to the class of Smoluchowski equations which describe irreversible mass aggregation processes of colloids or aerosols under the mean field approximation. Namely, aggregation of links caused by the merging process of nodes in a complex network is mathematically equivalent to the 7
(2)
mass aggregation process caused by irreversible collisions of particles. We solve this master equation analytically for two extreme cases: no coagulation (c = 0) and maximum coagulation (c = 0.5). In the case of no coagulation, we have the following steady state equation by substituting the mean degree conservation, b − ahki = 0, into the master equation, Eq. (2). As there are no nonlinear terms, for the no coagulation case, Eq. (2) can be solved analytically by introducing the generating function P (k) ∼ (k + 2)Γ(0, (k + 1) log 2) − 2−k ,
(3)
where Γ(x, d) is the incomplete gamma function. For large values of k, the distribution function of degree decays exponentially, which is consistent with our numerical simulation. In the case of maximum coagulation (c = 0.5), it is known that this type of Smoluchowski equation has a power law solution, P (k) ∼ k −β−1 , when the coagulation kernel for particles with masses k1 and k2 is proportional to 1, k1 k2 , or k1 + k2 [25]. Assuming the functional form as a power law, we can confirm that Eq. (2) is satisfied only in the case of β = 1. Namely, the steady state solution in the maximum coagulation case is given by the cumulative distribution P (≥ k) ∼ k −1 , which is consistent with numerical simulation, as shown in Fig. 3(d). We can solve the steady state solution of Eq. (2) analytically using the computer algebra system Mathematica with the boundary condition P (kmax +1) = 0, where kmax is the largest value of the number of links. For comparison, we performed Monte Carlo simulation with the same parameter sets in parallel and we numerically estimated the parameter values needed to solve Eq. (2), hki and kmax . In all cases, the analytical solutions and the results of Monte Carlo simulation agreed very well, as shown in Fig. 3(d). In all cases, the link number distribution decays exponentially for very large k, but there exists a range of k which can be approximated by a power law. This is a typical property of mass distributions of random coagulation systems with injection, such as the case of aerosols. The determined distribution which best agrees with the real link distribution, Fig. 2(b), is the case of c = 0.3. We cannot conclude whether the apparent power-law exponent, β = 1.3, is a genuine value; however, the master equation, Eq. (2), definitely describes the essence of the growth dynamics of the coagulation of nodes in a complex network. To summarize, we have shown that in the growth of a complex network, the effect of coagulation plays a central role, along with those of random annihilation, creation, and preferen8
tial attachment. Previous theoretical studies of complex networks revealed the importance of one-by-one rewiring of links [7]; here, we found that massive simultaneous rewiring of links caused by node-node coagulation is very effective, especially in the real world example of a business firm network. We expect that there are other network systems in which the effect of node-node aggregation is not negligible, and the balance of coagulation and creation governs the statistically steady state.
[1] B. A. Huberman and L. A. Adamic, Nature 401, 131 (1999). [2] H. Jeong, B. Tombor, R. Albert, Z. N. Oltvai, and A.-L. Barab´asi, Nature 407, 651 (2000). [3] F. Liljeros, C. R. Edling, L. A. N. Amaral, H. E. Stanley, and Y. ˚ Aberg, Nature 411, 907 (2001). [4] R. Pastor-Satorras, A. V´azquez, and A. Vespignani, Phys. Rev. Lett. 87, 258701 (2001). [5] R. Guimer`a, S. Mossa, A. Turtschi, and L. A. N. Amaral, Proc. Natl. Acad. Sci. USA 102, 7794 (2005). [6] A.-L. Barab´asi and R. Albert, Science 286, 509 (1999). [7] R. Albert and A.-L. Barab´asi, Phys. Rev. Lett. 85, 5234 (2000). [8] P. L. Krapivsky, S. Redner, and F. Leyvraz, Phys. Rev. Lett. 85, 4629 (2000). [9] S. N. Dorogovtsev, J. F. F. Mendes, and A. N. Samukhin, Phys. Rev. Lett. 85, 4633 (2000). [10] G. Bianconi and A.-L. Barab´asi, Europhys. Lett. 54, 436 (2001). [11] C. Moore, G. Ghoshal, and M. E. J. Newman, Phys. Rev. E 74, 036121 (2006). [12] M. E. J. Newman, Networks: An Introduction (Oxford University Press, New York, 2010). [13] M. Takayasu, S. Sameshima, T. Ohnishi, Y. Ikeda, H. Takayasu, and K. Watanabe, Annual Report of the Earth Simulator Center April 2007 - March 2008, 263 (2008). [14] H. Takayasu, Phys. Rev. Lett. 63, 2563 (1989). [15] M. Takayasu, Phys. Rev. A 46, 782 (1992). [16] H. Takayasu and Y-h. Taguchi, Phys. Rev. Lett. 70, 782 (1993). [17] M. Takayasu, H. Takayasu, and Y-h. Taguchi, Internat. J. Modern Phys. B 8, 3887 (1994). [18] P. L. Krapivsky and S. Redner, Phys. Rev. E 54, 3553 (1996). [19] W. H. White, J. Colloid Interface Sci. 87, 204 (1981). [20] F. Leyvraz, Phys. Rep. 383, 95 (2003).
9
[21] D. Gfeller and P. D. L. Rios, Phys. Rev. Lett. 100, 174104 (2008). [22] J. Sun, E. M. Bollt, and D. ben-Avraham, J. Stat. Mech. P06001 (2008). [23] L. H´ebert-Dufresne, A. Allard, V. Marceau, P.-A. No¨el, and L. J. Dub´e, Phys. Rev. Lett. 107, 158702 (2011). [24] H. Jeong, Z. N´eda, and A.-L. Barab´asi, Europhys. Lett. 61, 567 (2003). [25] H. Hayakawa, J. Phys. A 20, L801 (1987).
10