Materials Research Express
ACCEPTED MANUSCRIPT
Effect of concentration of hyaluronic acid and NaCl on corrosion behavior of 316L austenitic stainless steel To cite this article before publication: Ankur V Bansod et al 2017 Mater. Res. Express in press https://doi.org/10.1088/2053-1591/aa94da
Manuscript version: Accepted Manuscript Accepted Manuscript is “the version of the article accepted for publication including all changes made as a result of the peer review process, and which may also include the addition to the article by IOP Publishing of a header, an article ID, a cover sheet and/or an ‘Accepted Manuscript’ watermark, but excluding any other editing, typesetting or other changes made by IOP Publishing and/or its licensors” This Accepted Manuscript is © 2017 IOP Publishing Ltd.
During the embargo period (the 12 month period from the publication of the Version of Record of this article), the Accepted Manuscript is fully protected by copyright and cannot be reused or reposted elsewhere. As the Version of Record of this article is going to be / has been published on a subscription basis, this Accepted Manuscript is available for reuse under a CC BY-NC-ND 3.0 licence after the 12 month embargo period. After the embargo period, everyone is permitted to use copy and redistribute this article for non-commercial purposes only, provided that they adhere to all the terms of the licence https://creativecommons.org/licences/by-nc-nd/3.0 Although reasonable endeavours have been taken to obtain all necessary permissions from third parties to include their copyrighted content within this article, their full citation and copyright line may not be present in this Accepted Manuscript version. Before using any content from this article, please refer to the Version of Record on IOPscience once published for full citation and copyright details, as permissions will likely be required. All third party content is fully copyright protected, unless specifically stated otherwise in the figure caption in the Version of Record. View the article online for updates and enhancements.
This content was downloaded from IP address 129.11.21.2 on 24/10/2017 at 20:05
Page 1 of 68
pt
Effect of concentration of Hyaluronic Acid and NaCl on Corrosion Behavior of 316L Austenitic Stainless Steel
us cri
Ankur V. Bansod1, Nilay N. Khobragade2, Karansagar V. Giradkar3 and Awanikumar. P. Patil1
1) Ankur V. Bansod (Corresponding author) Affiliation: Department of Metallurgical and Materials Engineering, Visvesvaraya National Institute of Technology (VNIT), Nagpur-440010, India Phone: +919763939013 Email –
[email protected]
an
2) Nilay N. Khobragade Affiliation: Department of Metallurgical Engineering, Government College of Engineering, Amravati, 444604, India Phone: +919420569654 Email –
[email protected]
dM
3) Karansagar V. Giradkar Affiliation: Department of Mechanical Engineering Department of Mechanical Engineering, Dr. Babasaheb Ambedkar Technological University, Lonere, Raigad, India – 402103 Phone: +918149776997 Email –
[email protected]
ce
pte
4) Awanikumar P. Patil Affiliation: Department of Metallurgical and Materials Engineering, Visvesvaraya National Institute of Technology (VNIT), Nagpur-440010, India Phone: +919422163166 Email –
[email protected]
Ac
1 2 3 4 5 6 7 8 9 10 11 12 13 14 15 16 17 18 19 20 21 22 23 24 25 26 27 28 29 30 31 32 33 34 35 36 37 38 39 40 41 42 43 44 45 46 47 48 49 50 51 52 53 54 55 56 57 58 59 60
AUTHOR SUBMITTED MANUSCRIPT - MRX-105287.R1
1
AUTHOR SUBMITTED MANUSCRIPT - MRX-105287.R1
pt
Effect of concentration of Hyaluronic Acid and NaCl on Corrosion Behavior of 316L Austenitic Stainless Steel
us cri
Ankur V. Bansod1, Nilay N. Khobragade2, Karansagar V. Giradkar3 and Awanikumar. P. Patil1 1) Department of Metallurgy and Material Science, Visvesvaraya National Institute of Technology, Nagpur, India - 440010
2) Department of Metallurgical Engineering, Government College of Engineering, Amravati, 444604, India
ce
pte
dM
an
3) Department of Mechanical Engineering, Dr. Babasaheb Ambedkar Technological University, Lonere, Raigad, India – 402103
Ac
1 2 3 4 5 6 7 8 9 10 11 12 13 14 15 16 17 18 19 20 21 22 23 24 25 26 27 28 29 30 31 32 33 34 35 36 37 38 39 40 41 42 43 44 45 46 47 48 49 50 51 52 53 54 55 56 57 58 59 60
Page 2 of 68
2
Page 3 of 68
pt
ABSTRACT
an
us cri
Due to low cost and easily available material, 316L stainless steel (SS) is used for biomedical implants. The electrochemical corrosion behavior of 316L (SS) was studied as a function of the concentration of simulated biological fluid (Hyaluronic acid), the influence of Cl- and the combined effect of NaCl and Hyaluronic acid (HA). For the electrochemical tests, potentiodynamic polarization test and electrochemical impedance spectroscopy (EIS) were undertaken. With the increase in HA concentration, corrosion rate increases. Whereas, with the addition of NaCl to HA the solution, the corrosion resistance of the sample was enhanced. Also, in pure NaCl solution, the corrosion current density (icorr) increased as compared to bare HA and HA + NaCl. This is due to the adhesion property of the HA on the sample surface. EIS result agrees with the findings of potentiodynamic polarization tests. X-ray photoelectron spectroscopy (XPS) was executed to analyze the passive film formed in the solution of HA and NaCl on 316L SS. XPS spectra confirms the formation of the passive film containing chromium oxide and hydroxides. Also, the formation of MoO2 helps in improving better corrosion resistance. The peak of nitrogen was observed in the sample immersed in HA solution. Scanning electron microscope (SEM) was carried out to analyze the surface morphology.
ce
pte
dM
Keywords: Hyaluronic acid; Biomaterials (316L SS); Adsorption; X-ray photoelectron spectroscopy (XPS).
Ac
1 2 3 4 5 6 7 8 9 10 11 12 13 14 15 16 17 18 19 20 21 22 23 24 25 26 27 28 29 30 31 32 33 34 35 36 37 38 39 40 41 42 43 44 45 46 47 48 49 50 51 52 53 54 55 56 57 58 59 60
AUTHOR SUBMITTED MANUSCRIPT - MRX-105287.R1
3
AUTHOR SUBMITTED MANUSCRIPT - MRX-105287.R1
pt
1. INTRODUCTION
an
us cri
Various alloys like titanium and cobalt as well as few grades of stainless steel like 316L are commonly used in artificial implants [1]. In developed countries, titanium and cobalt are extensively used due to their better corrosion resistance and better mechanical properties. However, in developing countries, use of stainless steels as temporary as well as permanent implants due to its economic aspects and adequate corrosion resistance although lower than the predecessor. It is imperative for biomedical implants that it should have better mechanical properties when placed in service [1]. Also, the implants should be completely inert in the human body fluids. However, it is difficult to achieve complete inertness in the body. Organic fluid is reactive to metallic implants and can release metal ions inside the body [2]. If the corrosion process occurred inside the human body, the release of metallic ions such as Ni+2, Cr+3 and Cr+6, would produce serious health risks [3]. All implants have the tendency to corrode which could be minimized by the formation of the passive layer over the surface. The acceptable level of corrosion level is highly important for the implants. High corrosion rate may lead to damage of the surrounding tissues of the body [4]. The efficiency of the implants depends on the passivation and repassivation of the protective film under immersion media. In general, the passive film formed over the surface of 316L stainless steel (SS) is mainly composed of the film of oxide and hydroxide which helps in reducing dissolution of metal ions [5].
pte
dM
In human body Hyaluronic acid (HA) occurs naturally, It is a carbohydrate (mucopolysaccharide), made up of a long chain of sugars (carbohydrates). Hyaluronic acid (HA) consists of a linear polysaccharide of alternating D-glucuronic acid (GlcU) and N-acetyl-D- glucosamine (GlcNAc) units, which has a three-dimensional structure in solution that shows extensive intramolecular hydrogen bonding [6]. HA has high molecular weight (105–107 Da), and when mixed with water exhibits gel-like properties including viscosity as a function of molecular weight [7]. Numerous biological functions have been associated with HA. HA plays a vital role in the orthopedic application. It helps in the development of cartilage, maintenance of the synovial fluid and the regeneration of the tendons. It also acts as a lubricant and shock absorber in the joints. Pitt et al. have found that the 316L SS surface is adversely affected by biological activity and it can be mitigated by bioactive when coated with HA [6].
ce
The corrosion resistance of the passive film of 316L is high, however, the passive film of SS is highly susceptible to pitting corrosion in presence of halides. Pitting corrosion limits the application of biomedical implants by adversely affecting both the biocompatibility and mechanical strength of the implants [8]. Various authors have studies the electrochemical behavior of stainless steel in simulated body fluids in stainless steel. Frateur et al. carried out the electrochemical tests on ferritic stainless steel using time-potential plots and potentiodynamic polarization tests in bovine serum albumin [9]. Kocijan et al. worked on the AISI 316L SS to study the effect of model proteins on the passivation behavior [10]. Karimi et al. have studied the effect of concentration of bovine serum albumin (BSA) on corrosion behavior of AISI 316L, Co–28Cr– 6Mo, and Ti–6Al–4V alloys in phosphate buffered saline solutions [11]. It was observed that with an increase in the concentration of BSA the stability of passive film increase [11]. Milosev et al. investigated on Co-Cr-Mo in NaCl with other biological solutions and concluded that the corrosion potential (Ecorr) was approximately equal to -0.3V vs SCE and its passive current density (ip) was approximately 1µA/cm2 [12]. It is generally found that the Cl ion concentration in body fluid was found to be 87-138 mmol/L in synovial fluid [13]. Igual et al. investigated in-vivo electrochemical
Ac
1 2 3 4 5 6 7 8 9 10 11 12 13 14 15 16 17 18 19 20 21 22 23 24 25 26 27 28 29 30 31 32 33 34 35 36 37 38 39 40 41 42 43 44 45 46 47 48 49 50 51 52 53 54 55 56 57 58 59 60
Page 4 of 68
4
Page 5 of 68
us cri
pt
corrosion studies on synovial fluid and found that the corrosion rate significantly varies with the concentrations of synovial fluid [14]. In another experiment by Milosev et al., HA + NaCl and Hanks solution were used and they found that the passive current density remains constant in NaCl up to 0.6V vs SCE, whereas, on an addition of HA passive current density remains constant only up to 0.2V vs SCE [15]. It has been reported that Cr and Ni are predominantly present as free ions (Cr3+ and Ni2+) which release into the body [16]. Also, the release of metal ions in the body is not proportional to bulk alloy composition. Hence change in alloy content in the human body is not always useful [17]. Various researchers have worked on biomaterials in various chloride concentration of which Yan et al. have investigated on bio tribocorrosion of CoCrMo orthopedic implant materials-assessing the formation and effect of the biofilm in 0.36% NaCl solution [18][11][12][19].
dM
an
Various studies have been conducted on the corrosion behaviour of metallic implants in numerous biological solutions. Few literature concerning the corrosion behavior of 316L SS in HA is available. Since Surface characterization of the alloys used in bioimplants have great significance and influence the performance of the implant through the interaction between the film and the tissue, and the possible migration of metallic ions from the base metal to the surrounding tissues. To evaluate the corrosion behavior of our steel we have varied the NaCl concentration to one order of magnitude (0.036%, 0.36% and 3.6 wt.% NaCl) in HA solution. In this study on electrochemical behavior using potentiodynamic polarization test, electrochemical impedance spectroscopy (EIS) and surface characterization using X-ray photoelectron spectroscopy (XPS) of 316L SS in HA and NaCl solution are investigated. 2. MATERIALS AND METHOD
ce
pte
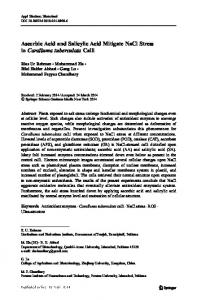
The presented work was conducted on commercially available 316L alloy having a composition (weight %) as Cr 18.1, Ni 12.1, Mo 2.45, C 0.03, Si 0.37, N 0.06 and remaining Fe. To study the effect of concentration of biological media and NaCl on the corrosion behavior of 316L alloy, three different investigations were conducted. One comprising of a variety of concentrations of hyaluronic acid (HA), another perceive the effect of increasing in Cl ions concentration and finally combined effect of HA + NaCl as an electrolyte for the corrosion tests of 316L alloy. In this investigation, simulated biological media was prepared with the help of hyaluronic acid (HA). Hyaluronic acid was procured from Kopuron Max, Kumar Organic Products Limited, Bangalore, India. Figure 1 shows the structure of HA. The concentration of HA in the test solution (HA + NaCl) was taken as 321mg/100mL according to the medical reports from Decker et al. [20]. This concentration is similar to the concentration of HA in synovial fluid of a healthy person [20]. The concentration of sodium chloride was increased by one order of magnitude from 0.036 wt%, 0.36 wt% and 3.6 wt% in 321mg/100mL HA solution. The pH of the test solution was also noted and it was observed that no significant alteration was caused before and after the polarization test of each sample. During each test, the temperature was maintained at 37 ºC with a constant temperature bath and it was conducted in an aerated environment. The samples with a dimension of 10 mm × 10 mm × 3 mm was prepared using the wire cut electron discharge machine (EDM). These samples were polished with emery papers of gradually decreasing grit sizes (150, 320, 600, 800, 1000, 1200 and 1500) on a polishing disc and ultrasonically cleaned thereafter in the distilled water bath. Electrochemical measurements were carried out using a conventional three-electrode electrochemical cell (counter electrode, the
Ac
1 2 3 4 5 6 7 8 9 10 11 12 13 14 15 16 17 18 19 20 21 22 23 24 25 26 27 28 29 30 31 32 33 34 35 36 37 38 39 40 41 42 43 44 45 46 47 48 49 50 51 52 53 54 55 56 57 58 59 60
AUTHOR SUBMITTED MANUSCRIPT - MRX-105287.R1
5
AUTHOR SUBMITTED MANUSCRIPT - MRX-105287.R1
dM
an
us cri
pt
reference electrode and working electrode) in fully aerated condition. A constant temperature of 37 ºC was maintained in all the experiments using Cyber Lab CB 2000, a constant temperature bath. A platinum wire mesh and an SCE electrode were employed as a counter and a reference electrode, respectively. Electrochemical measurements were performed using a Biologic potentiostat (model VMP 300) and EC-lab software. Open circuit potential (OCP) or time potential measurement was executed in order to stabilize the potential for 60 min. Stable OCP was attained in less than 60 minutes in all the cases. Electrochemical impedance spectroscopy (EIS) tests were carried out under open circuit conditions. A sinusoidal AC signal of 10mV was applied in the frequency range of 105 to 10-2 Hz using a potentiostat. The results were subsequently analyzed by EC-lab software and fitted with the corresponding equivalent circuit. The equivalent circuit is shown in Figure 2. Potentiodynamic polarization was conducted in the range of -500 mV to 1200 mV vs saturated calomel electrode (SCE) at a scan rate of 0.1667 mV/s (Ref 24). Tests were conducted at the end of EIS measurement in order to determine the corrosion rate of each sample. Corrosion potential (Ecorr), as well as the corrosion current density (icorr), were measured from the polarization graphs by Tafel extrapolation method. Passive current density (ip) and breakdown potential (Eb) were also obtained from the potentiodynamic curves. Moreover, each experiment was repeated thrice to verify the reproducibility. The surface analysis is carried out using scanning electron microscopy (SEM) (JEOL JSM 6380). X-ray photoelectron microscopy (XPS) was conducted for two samples of 316L alloy after dipping in 321mg/100mL HA and 3.6% NaCl respectively for 15-days duration. Specimens were later rinsed, ultrasonically cleaned and dried off. 3. RESULTS AND DISCUSSIONS
3.1 Influence of increasing concentration of HA
ce
pte
Figure 3 shows the variation in potentiodynamic polarization curves of 316L alloy with the change in concentration of hyaluronic acid from 250mg/100ml to 365mg/100ml at 37 ºC. Cathodic current density was observed to change by more than one order of magnitude. After cathodic region, the specimen revels passive region followed by transpassive region. In cathodic reaction, mainly oxygen reduction reaction will take place. This is due to the scavenging action of HA, which reduces the level of reacting oxygen species [21]. Karimi et al. reported the presence of some reduction of proteins over the surface [11]. The passive region extends from 0 to 1.0 V vs SCE. The breakdown of passivity occurred at almost 1.1 V which is the start of the transpassive region. Cathodic part of the plots is almost linear indicating reactions are activation controlled and are shifted to lower potentials when there was a surge in the HA concentration. These results are in agreement with the findings led by Vidal and Munoz [18] [14]. Also, no distinctive difference in passive current density was observed in the plots, which is in agreement with the results of previous studies [22]. Table 1 shows that with an increase in the concentration of HA, the corrosion rate of the alloy slightly increases manifested with an increase in icorr values. The increase in icorr could be attributed to the absorption of HA on the surface of alloy causing metal dissolution. The value of Ecorr shifts in the noble direction (positive) with increase in HA concentration. Hence stability of the passive film is more in higher concentration of HA. The passive current density increases with increase in HA concentration measured at the potential of 0.4 V (0.64, 0.82 and 1.3 µA respectively).
Ac
1 2 3 4 5 6 7 8 9 10 11 12 13 14 15 16 17 18 19 20 21 22 23 24 25 26 27 28 29 30 31 32 33 34 35 36 37 38 39 40 41 42 43 44 45 46 47 48 49 50 51 52 53 54 55 56 57 58 59 60
Page 6 of 68
6
𝑍(𝑓) = 𝑅𝑠 +
𝑅2 𝑅2 .𝐶𝑃𝐸2 .(𝑗𝜔)𝑛2 +1
+
us cri
Figure 4 shows the Nyquist plots for 316L samples with increased concentrations of HA solution at 37 ºC. Plots represent a large semi-circular capacitive loop. The circuit fitting of EIS data was accomplished with the help of five element equivalent electrical circuits as shown in Figure 2. Similar circuit was also used by other authors [11][23] for explaining adsorption phenomena. Some authors have also used simple Randle’s circuit with one time constant [22] [24], however, circuit presented in Figure 2, best fits the EIS data. The fitted data is shown by continuous lines whereas the original data is shown with different symbols. To consider the non-homogeneities related to adsorption of HA on the sample surface, constant phase element (CPE) was used instead of a pure capacitor. The impedance of the circuit can be evaluated by Eq. 1. 𝑅3 𝑅3 .𝐶𝑃𝐸3 .(𝑗𝜔)𝑛3 +1
(1)
dM
an
Where, ω = 2πf, exponent n2 and n3 is a coefficient related to the deviation between real and pure capacitance, ω is angular frequency and f is frequency. The plot was fitted with the help of Z Fit software package provided in the EC-lab software. Similarly, Rs is the solution resistance, R2 is the resistance provided by adsorbed layer and oxide layer resistance is designated by R3. CPE2 and CPE3 are the corresponding constant phase elements for adsorbed layer and oxide layer as shown in Figure 4. Fitted values of the Nyquist plots are presented in Table 2. In Impedance measurement, the higher value of R2 implies higher corrosion resistance in the alloy. Hence, results in lower dissolution of cations from the alloy surface [11]. The increase in HA results in less value of R2. It is probably because of HA adsorption on the surface causing metal dissolution [18]. The increase in R2 signifies low capacitance (CPE2) which resembles long term stability of the passive film formed on the surface. Vidal et.al. has explained that alteration of ionic conductivity is due to the increase in the concentration of simulated biological fluid [25]. 3.2 Influence of increasing concentration of NaCl
ce
pte
Figure 5 shows potentiodynamic polarization of different concentration of NaCl showing anodic and cathodic parts of polarization curves. It can be observed that cathodic part of the polarization curve does not change too much with the increase in NaCl concentration. The cathodic reaction in NaCl solution is mainly due to oxygen reduction reaction. It is evident from the Figure 5 that Ecorr is the function of Cl-. The increase in Cl- shifts the Ecorr in active (negative direction) as given in Table 3. The cathodic part of the plots in Cl- is almost activation controlled (just below the Ecorr) towards active potential. In anodic part of polarization is activation controlled for all concentrations. The equations given by Sato for explaining the effect of hydroxyl and chloride ions in metal dissolution is given below [26][27].
(4)
M + Cl- → MClad + H+ + e-
(5)
MClad → MCl+ + e-
(6)
M + H2O → MOHad + H+ + e-
(2)
MOHad → MOH+ + e-
(3)
MOH+ → M2+ + OH-
Ac
1 2 3 4 5 6 7 8 9 10 11 12 13 14 15 16 17 18 19 20 21 22 23 24 25 26 27 28 29 30 31 32 33 34 35 36 37 38 39 40 41 42 43 44 45 46 47 48 49 50 51 52 53 54 55 56 57 58 59 60
AUTHOR SUBMITTED MANUSCRIPT - MRX-105287.R1
pt
Page 7 of 68
7
AUTHOR SUBMITTED MANUSCRIPT - MRX-105287.R1
MCl+ → M2+ + Cl-
pt
(7)
2Cr + 3H2O → Cr2O3 + 6H+ + 6e-
(8)
us cri
Hydroxyl mechanism is given in Eq. 2-4, chloride mechanism in Eq. 5-7 and formation of the passive film in aqueous media are given in Eq. 8. Since pH of the solution was almost constant. Hence the effect of hydroxyl ions (OH-) concentration will be same. However, there is a change in Cl- concentration which results in the change in Ecorr. The value of icorr increases as the concentration of Cl- increases. At potential of 0.2 V (SCE), it can be observed that anodic current density increases with the increase in Cl- which is attributed to high dissolution of metal ions (metal dissolution, Eq.5-7) in the solution. At the pitting potential there is a sudden increase in the current density. A linear relationship coexists between the Cl- concentrations according to the Eq. 9 [28] Epit = a – b log CCl-
(9)
dM
an
Where a and b are constants and depends upon the chemical composition of the alloy. Hence, for a given chemical composition the value of Epit mainly depends upon the Cl- concentration. It has been reported that Cl- in the environment deteriorates the passive film which results in preferential sites for the pit to form on the surface. Once the pit is initiated the pitting growth and propagation is continued in active dissolution mode and anodic current density increases rapidly as seen in Figure 5.
pte
Figure 6 shows fitted Nyquist plots for various solutions (1%, 2% and 3%) of NaCl. The fitted parameters are listed in Table 4. The fitted equivalent circuit is shown in Figure 2 and was valid for all the Nyquist graphs. It is observed the value of R2 decreases with increase in NaCl concentrations. This is attributed to decrease of corrosion resistance of the passive film over the surface. The resistance of the passive film was higher in 1% NaCl solution. It was also observed that resistance of the porous film (R3) was lower than the resistance of the passive film. This may be due to the fact that the electrolyte solution in the micropores or interstitials was partly shortcircuited [29]. 3.3 Influence of hyaluronic acid and sodium chloride
ce
Figure 7 displays potentiodynamic polarization plots of 316L alloy with increasing concentration of NaCl (from 0.036% to 3.6%) in 321mg/100mL HA solution. The cathodic part of the plots is almost similar in behavior (activation just below Ecorr). Passive current density was found to be of the order of 1 µA/cm2. Ecorr, icorr, and Epit values were evaluated using the EC-lab software and are listed in Table 5. The passive region can be observed for all the three solutions. With increase in NaCl concentration the passive region decreases substantially followed by stable pit over the surface (Epit). In general, comparing the polarization data with the pure NaCl solution the Epit increases. Hence, there is an increase in the passive region also. With an increase in NaCl concentration, the polarization graph shift towards the right (with current density) followed by shift in Ecorr towards active (negative) direction. This shift of Ecorr deteriorates the formation of a passive film over the surface. The corrosion current density also increases. Hence, it was evident that higher the concentration of NaCl in presence of hyaluronic acid, the more the corrosion rate
Ac
1 2 3 4 5 6 7 8 9 10 11 12 13 14 15 16 17 18 19 20 21 22 23 24 25 26 27 28 29 30 31 32 33 34 35 36 37 38 39 40 41 42 43 44 45 46 47 48 49 50 51 52 53 54 55 56 57 58 59 60
Page 8 of 68
8
Page 9 of 68
us cri
pt
of the alloy. However, comparing icorr of 316L in various NaCl solution (Table 3) with that of 316L in various HA + NaCl solution (Table 5) it is observed that on addition of HA to NaCl improves corrosion resistance. Similarly, on comparting icorr of 316L in 321mg/100mi solution of HA (Table 1) with that of 316L in various HA + NaCl solution (Table 5). It is seen that addition of NaCl (upto 0.36%) too improves corrosion resistance. It is also seen that addition of 3.6 % NaCl has almost negligible effect. It follows that HA and NaCl together are more effective in improving corrosion resistance.
3.4 Surface characterization
an
Figure 8 shows Nyquist plot for 316L SS samples in 321mg/100mL HA solution with increased concentration of NaCl from 0.036% to 3.6% at 37 °C. Nyquist plots represent a large semi-circular capacitive loop. For fitting of the EIS data, the five-element equivalent circuit was employed as depicted in Figure 2 and the corresponding parameter is presented in Table 6. It was further observed from the values that polarization resistance decreases with an increase in the concentration of NaCl in HA. On comparing Table 2 and Table 6, it can be deduced that polarization resistance decrease in solutions of HA containing NaCl than that of purely HA solution. This can results in more metal dissolution in an alloy containing NaCl.
ce
pte
dM
Figure 9 (a and b) shows the XPS analysis of 316 SS sample immersed in 0.36% NaCl and 321mg/100mL HA + 0.36% NaCl solution for 15 days at 37 °C temperature (pH = 7). The XPS analysis of the surface revealed the following elements: Carbon (C 1s), Oxygen (O 1s), Chromium (Cr 2p), Molybdenum (Mo 3d), Nickel (Ni 2p) and Iron (Fe 2p). XPS analysis reveals separate binding energy for Cr (575.6 eV) in the form of Cr2p3/2 and Cr2p1/2 as shown in Figure 10 (a). They corresponds to trivalent chromium. The higher binding energy of Cr correspond to the formation of CrO3. The formation of Cr3+ oxide confirms the formation of Cr2O3 [30]. The XPS spectra of Mo (227.5 eV) can be seen to form Mo 3d5/2 and Mo 3d3/2 as shown in Figure 10 (b). It was reported that Mo is present in mixed valance state Mo6+ and Mo5+ with higher predominance of Mo6+ over Mo5+. Hence, the formation of MoO3 and MoO2 may be expected [31]. The binding energy of Ni (857.8 eV) in the form of Ni 2p3/2 and Ni 2p1/2 XPS spectra can be seen in Figure 10 (c). The binding energy represents the formation of Ni(OH)2 and NiO [30]. Also, the presence of Fe (708.1 eV) in the form of Fe2p3/2 and Fe2p1/2 establishes the evidence of the formation of Fe3O4 and FeO(OH) [32]. The deconvoluted O 1s (530.1 eV) spectra result in three peaks as shown in Figure 10 (e). The first peak at lower binding energy resembles the metal oxide (may be oxide of Cr). The second intermediate peak is due to the formation of metal hydroxide and peak at higher binding energy is due to adsorption of H2O. The peak of nitrogen (N 1s) was also observed in the sample containing HA which also helps in reducing metal dilution as compared to pure NaCl solution. Moreover, N 1s (394.4 eV) spectrum in the XPS analysis confirmed the adsorption of HA on the sample surface. This is because N 1s spectrum corresponds to the formation of adsorbed layer by organic matter as explained by Munoz et al. [14]. Figure 11 (a-c) shows the SEM micrograph after potentiodynamic polarization.
Ac
1 2 3 4 5 6 7 8 9 10 11 12 13 14 15 16 17 18 19 20 21 22 23 24 25 26 27 28 29 30 31 32 33 34 35 36 37 38 39 40 41 42 43 44 45 46 47 48 49 50 51 52 53 54 55 56 57 58 59 60
AUTHOR SUBMITTED MANUSCRIPT - MRX-105287.R1
4. CONCLUSIONS On the basis of the experimental study conducted on corrosion behavior of 316L SS, the following critical findings were noted. 9
ce
pte
dM
an
us cri
1. It was observed that with the increase in HA concentration, there was increased dissolution of metal in the solution. There is a marginal increase in the value of icorr. Electrochemical impedance spectroscopy and polarization test reveal that with the increase in HA concentration, there is a retardation of the film formation causing metal dissolution. 2. In pure NaCl solution the value of icorr increases with increase in NaCl concentration. Also, the polarization plots shift towards right indicating higher metal dissolution. These findings correlate with the results of EIS. 3. However, with the addition of NaCl (0.036, 0.36 and 3.6 wt. %) in 321mg/100ml HA solution, it was observed that corrosion resistance of the metal improves as compared to pure NaCl solution. Thus Cl- acts as a barrier for the metal dissolution and hence improves adsorption of HA molecules, thereby forming a thick layer of proteins causing improvement in corrosion resistance. Also, the increase in pitting potential was observed. 4. XPS analysis confirms the formation of the passive film containing oxide and hydroxide of chromium and also beneficial effect of addition of molybdenum. Also, the formation of nickel oxide was observed. Nitrogen peak (N 1s) was observed in the sample containing HA, which could help in improving the stability of the passive film causing lower metal dissolution.
Ac
1 2 3 4 5 6 7 8 9 10 11 12 13 14 15 16 17 18 19 20 21 22 23 24 25 26 27 28 29 30 31 32 33 34 35 36 37 38 39 40 41 42 43 44 45 46 47 48 49 50 51 52 53 54 55 56 57 58 59 60
Page 10 of 68
pt
AUTHOR SUBMITTED MANUSCRIPT - MRX-105287.R1
10
Page 11 of 68
pt
REFERENCES D. A. López, A. Durán, and S. M. Ceré, Electrochemical characterization of AISI 316L stainless steel in contact with simulated body fluid under infection conditions, J. Mater. Sci. Mater. Med. 19, 2137 (2008).
[2]
S. El-Hadad, W. Khalifa, and A. Nofal, Surface modification of investment cast-316L implants: Microstructure effects, Mater. Sci. Eng. C, 48, 320 (2015).
[3]
M. Costa and M. Fernandes, Proliferation / differentiation of osteoblastic human alveolar bone cell cultures in the presence of stainless steel corrosion products, J. Mater. Sci. Mater. Med.11, 141 (2000).
[4]
R. Singh and N. B. Dahotre, Corrosion degradation and prevention by surface modification of biometallic materials, J. Mater. Sci. Mater. Med.18, 725 (2007).
[5]
J. J. Kim and Y. M. Young, Study on the passive film of type 316 stainless steel, Int. J. Electrochem. Sci. 8, 11847 (2013).
[6]
W. G. Pitt, R. N. Morris, M. L. Mason, M. W. Hall, Y. Luo, and G. D. Prestwich, Attachment of hyaluronan to metallic surfaces, J. Biomed. Mater. Res., 68A, 95 (2004).
[7]
J. Necas, L. Bartosikova, P. Brauner, and J. Kolar, Hyaluronic acid (hyaluronan): A review, Vet. Med. (Praha). 53, 397 (2008).
[8]
A. Shahryari, S. Omanovic, and J. A. Szpunar, Electrochemical formation of highly pitting resistant passive films on a biomedical grade 316LVM stainless steel surface, Mater. Sci. Eng. C. 28, 94 (2008).
[9]
I. Frateur, L. Lartundo-Rojas, C. Méthivier, A. Galtayries, and P. Marcus, Influence of bovine serum albumin in sulphuric acid aqueous solution on the corrosion and the passivation of an iron-chromium alloy, Electrochim. Acta, 51, 1550 (2006).
dM
an
us cri
[1]
pte
[10] A. Kocijan, I. Milošev, and B. Pihlar, The influence of complexing agent and proteins on the corrosion of stainless steels and their metal components, J. Mater. Sci. Mater. Med., 14, 69 (2003). [11] S. Karimi, T. Nickchi, and A. Alfantazi, Effects of bovine serum albumin on the corrosion behaviour of AISI 316L, Co-28Cr-6Mo, and Ti-6Al-4V alloys in phosphate buffered saline solutions, Corros. Sci., 53, 3262 (2011).
ce
[12] I. Milošev, The effect of biomolecules on the behaviour of CoCrMo alloy in various simulated physiological solutions, Electrochim. Acta, 78, 259 (2012). [13] E. Bortel, B. Charbonnier, and R. Heuberger, Development of a Synthetic Synovial Fluid for Tribological Testing, Lubricants, 3, 664 (2015). [14] A. I. Muñoz and S. Mischler, Interactive Effects of Albumin and Phosphate Ions on the Corrosion of CoCrMo Implant Alloy, J. Electrochem. Soc. 154, 562 (2007).
Ac
1 2 3 4 5 6 7 8 9 10 11 12 13 14 15 16 17 18 19 20 21 22 23 24 25 26 27 28 29 30 31 32 33 34 35 36 37 38 39 40 41 42 43 44 45 46 47 48 49 50 51 52 53 54 55 56 57 58 59 60
AUTHOR SUBMITTED MANUSCRIPT - MRX-105287.R1
[15] I. Milošev, J. Hmeljak, and A. Cör, Hyaluronic acid stimulates the formation of calcium phosphate on CoCrMo alloy in simulated physiological solution, J. Mater. Sci. Mater. Med., 24, 555 (2013). 11
AUTHOR SUBMITTED MANUSCRIPT - MRX-105287.R1
pt
[16] I. O. Wallinder, S. Bertling, D. B. Kleja, and C. Leygraf, Corrosion-induced release and environmental interaction of chromium, nickel and iron from stainless steel, Water. Air. Soil Pollut., 170, 17 (2006).
us cri
[17] M. Talha, C. K. Behera, and O. P. Sinha, A review on nickel-free nitrogen containing austenitic stainless steels for biomedical applications, Mater. Sci. Eng. C, 33, 3563 (2013). [18] C. Valero Vidal and A. Igual Muñoz, Electrochemical characterisation of biomedical alloys for surgical implants in simulated body fluids, Corros. Sci., 50, 1954 (2008). [19] Y. Yan, A. Neville, and D. Dowson, Biotribocorrosion of CoCrMo orthopaedic implant materials-Assessing the formation and effect of the biofilm, Tribol. Int., 40, 1492 (2007). [20] B. Decker, W. F. Mcguckin, B. F. Mckenzie, And C. H. Slocumb, Concentration of hyaluronic acid in synovial fluid., Clin. Chem., 5, 465 (1959).
an
[21] Y.-C. Tang, S. Katsuma, S. Fujimoto, and S. Hiromoto, Electrochemical study of Type 304 and 316L stainless steels in simulated body fluids and cell cultures., Acta Biomater., 2, 709 (2006). [22] R. W. W. Hsu, C. C. Yang, C. A. Huang, and Y. S. Chen, Electrochemical corrosion studies on Co-Cr-Mo implant alloy in biological solutions, Mater. Chem. Phys., 93, 531 (2005).
dM
[23] C. Valero Vidal and A. Igual Muñoz, Study of the adsorption process of bovine serum albumin on passivated surfaces of CoCrMo biomedical alloy, Electrochim. Acta, 55, 8445 (2010). [24] F. Contu and B. Elsener H. Bhni, Characterization of implant materials in fetal bovine serum and sodium sulfate by electrochemical impedance spectroscopy. I. Mechanically polished samples, J. Biomed. Mater. Res., 62, 412 (2002). [25] C. Valero-Vidal, L. Casabn-Julin, I. Herraiz-Cardona, and A. Igual-Munoz, Influence of carbides and microstructure of CoCrMo alloys on their metallic dissolution resistance, Mater. Sci. Eng. C, 33, 4667 (2013).
pte
[26] N. N. Khobragade, M. I. Khan, and A. P. Patil, Corrosion Behaviour of Chrome-Manganese Austenitic Stainless Steels and AISI 304 Stainless Steel in Chloride Environment. Trans. Indian Inst. Met. 67, 263 (2014). [27] N. Sato, Toward a More Fundamental Under standing of Corrosion Processes, Corrosion, 511, 495 (1990).
ce
[28] M. A. M. Ibrahim, S. S. Abd El Rehim, and M. M. Hamza, Corrosion behavior of some austenitic stainless steels in chloride environments, Mater. Chem. Phys.,115, 80 (2009). [29] C. Hitz and A. Lasia, Experimental study and modeling of impedance of the her on porous Ni electrodes, J. Electroanal. Chem., 500, 213 (2001). [30] M. C. Biesinger, B. P. Payne, A. P. Grosvenor, L. W. M. Lau, A. R. Gerson, R. St, and C. Smart, Applied Surface Science Resolving surface chemical states in XPS analysis of first row transition metals , oxides and hydroxides : Cr , Mn , Fe , Co and Ni, Appl. Surf. Sci., 257, 2717 (2011).
Ac
1 2 3 4 5 6 7 8 9 10 11 12 13 14 15 16 17 18 19 20 21 22 23 24 25 26 27 28 29 30 31 32 33 34 35 36 37 38 39 40 41 42 43 44 45 46 47 48 49 50 51 52 53 54 55 56 57 58 59 60
Page 12 of 68
12
Page 13 of 68
pt
[31] W. Ji, R. Shen, R. Yang, G. Yu, X. Guo, L. Peng, and W. Ding, Partially nitrided molybdenum trioxide with promoted performance as an anode material for lithium-ion batteries, J. Mater. Chem. A, 2, 699 (2014).
ce
pte
dM
an
us cri
[32] A. P. Grosvenor, M. C. Biesinger, R. S. C. Smart, and N. S. McIntyre, New interpretations of XPS spectra of nickel metal and oxides, Surf. Sci., 600, 1771 (2006).
Ac
1 2 3 4 5 6 7 8 9 10 11 12 13 14 15 16 17 18 19 20 21 22 23 24 25 26 27 28 29 30 31 32 33 34 35 36 37 38 39 40 41 42 43 44 45 46 47 48 49 50 51 52 53 54 55 56 57 58 59 60
AUTHOR SUBMITTED MANUSCRIPT - MRX-105287.R1
13
AUTHOR SUBMITTED MANUSCRIPT - MRX-105287.R1
pt
List of Figures
ce
pte
dM
an
us cri
Figure 1: Structure of hyaluronic acid Figure 2: Equivalent circuit for fitting Nyquist plots Figure 3: Potentiodynamic polarization plots of 316L SS different HA concentrations at 37 °C Figure 4: Nyquist plots of 316L SS different HA concentrations at 37 °C Figure 5: Potentiodynamic polarization plots of 316L SS different NaCl concentrations at 37 °C Figure 6: Nyquist plots of 316L SS different NaCl concentrations at 37 °C Figure 7: Potentiodynamic polarization plots of 316L SS in 321mg/100ml HA with increasing concentration of NaCl at 37 °C Figure 8: Nyquist plots of 316L SS in 321mg/100ml HA with increasing concentration of NaCl at 37 °C Figure 9: XPS survey spectra of 316L in (a) 0.36% NaCl (b) 321 mg/100ml HA Figure 10: XPS spectra of (a) Cr (b) Mo (c) Ni (d) Fe and (e) O Figure 11: SEM micrograph of 316L after potentiodynamic polarization in (a) HA (b) HA + NaCl (c) NaCl
Ac
1 2 3 4 5 6 7 8 9 10 11 12 13 14 15 16 17 18 19 20 21 22 23 24 25 26 27 28 29 30 31 32 33 34 35 36 37 38 39 40 41 42 43 44 45 46 47 48 49 50 51 52 53 54 55 56 57 58 59 60
Page 14 of 68
14
us cri
ce
pte
dM
an
Figure 1: Structure of hyaluronic acid
Ac
1 2 3 4 5 6 7 8 9 10 11 12 13 14 15 16 17 18 19 20 21 22 23 24 25 26 27 28 29 30 31 32 33 34 35 36 37 38 39 40 41 42 43 44 45 46 47 48 49 50 51 52 53 54 55 56 57 58 59 60
AUTHOR SUBMITTED MANUSCRIPT - MRX-105287.R1
pt
Page 15 of 68
15
us cri
ce
pte
dM
an
Figure 2: Equivalent circuit for fitting Nyquist plots
Ac
1 2 3 4 5 6 7 8 9 10 11 12 13 14 15 16 17 18 19 20 21 22 23 24 25 26 27 28 29 30 31 32 33 34 35 36 37 38 39 40 41 42 43 44 45 46 47 48 49 50 51 52 53 54 55 56 57 58 59 60
Page 16 of 68
pt
AUTHOR SUBMITTED MANUSCRIPT - MRX-105287.R1
16
us cri an
ce
pte
dM
Figure 3: Potentiodynamic polarization plots of 316L SS different HA concentrations at 37 °C
Ac
1 2 3 4 5 6 7 8 9 10 11 12 13 14 15 16 17 18 19 20 21 22 23 24 25 26 27 28 29 30 31 32 33 34 35 36 37 38 39 40 41 42 43 44 45 46 47 48 49 50 51 52 53 54 55 56 57 58 59 60
AUTHOR SUBMITTED MANUSCRIPT - MRX-105287.R1
pt
Page 17 of 68
17
us cri an
ce
pte
dM
Figure 4: Nyquist plots of 316L SS different HA concentrations at 37 °C
Ac
1 2 3 4 5 6 7 8 9 10 11 12 13 14 15 16 17 18 19 20 21 22 23 24 25 26 27 28 29 30 31 32 33 34 35 36 37 38 39 40 41 42 43 44 45 46 47 48 49 50 51 52 53 54 55 56 57 58 59 60
Page 18 of 68
pt
AUTHOR SUBMITTED MANUSCRIPT - MRX-105287.R1
18
us cri an
ce
pte
dM
Figure 5: Potentiodynamic polarization plots of 316L SS different NaCl concentrations at 37 °C
Ac
1 2 3 4 5 6 7 8 9 10 11 12 13 14 15 16 17 18 19 20 21 22 23 24 25 26 27 28 29 30 31 32 33 34 35 36 37 38 39 40 41 42 43 44 45 46 47 48 49 50 51 52 53 54 55 56 57 58 59 60
AUTHOR SUBMITTED MANUSCRIPT - MRX-105287.R1
pt
Page 19 of 68
19
us cri an
ce
pte
dM
Figure 6: Nyquist plots of 316L SS different NaCl concentrations at 37 °C
Ac
1 2 3 4 5 6 7 8 9 10 11 12 13 14 15 16 17 18 19 20 21 22 23 24 25 26 27 28 29 30 31 32 33 34 35 36 37 38 39 40 41 42 43 44 45 46 47 48 49 50 51 52 53 54 55 56 57 58 59 60
Page 20 of 68
pt
AUTHOR SUBMITTED MANUSCRIPT - MRX-105287.R1
20
us cri an
ce
pte
dM
Figure 7: Potentiodynamic polarization plots of 316L SS in 321mg/100ml HA with increasing concentration of NaCl at 37 °C
Ac
1 2 3 4 5 6 7 8 9 10 11 12 13 14 15 16 17 18 19 20 21 22 23 24 25 26 27 28 29 30 31 32 33 34 35 36 37 38 39 40 41 42 43 44 45 46 47 48 49 50 51 52 53 54 55 56 57 58 59 60
AUTHOR SUBMITTED MANUSCRIPT - MRX-105287.R1
pt
Page 21 of 68
21
us cri an dM
ce
pte
Figure 8: Nyquist plots of 316L SS in 321mg/100ml HA with increasing concentration of NaCl at 37 °C
Ac
1 2 3 4 5 6 7 8 9 10 11 12 13 14 15 16 17 18 19 20 21 22 23 24 25 26 27 28 29 30 31 32 33 34 35 36 37 38 39 40 41 42 43 44 45 46 47 48 49 50 51 52 53 54 55 56 57 58 59 60
Page 22 of 68
pt
AUTHOR SUBMITTED MANUSCRIPT - MRX-105287.R1
22
us cri an
ce
pte
dM
Figure 9: XPS survey spectra of 316L in (a) 0.36% NaCl (b) 321 mg/100ml HA
Ac
1 2 3 4 5 6 7 8 9 10 11 12 13 14 15 16 17 18 19 20 21 22 23 24 25 26 27 28 29 30 31 32 33 34 35 36 37 38 39 40 41 42 43 44 45 46 47 48 49 50 51 52 53 54 55 56 57 58 59 60
AUTHOR SUBMITTED MANUSCRIPT - MRX-105287.R1
pt
Page 23 of 68
23
us cri an dM pte ce
Ac
1 2 3 4 5 6 7 8 9 10 11 12 13 14 15 16 17 18 19 20 21 22 23 24 25 26 27 28 29 30 31 32 33 34 35 36 37 38 39 40 41 42 43 44 45 46 47 48 49 50 51 52 53 54 55 56 57 58 59 60
Page 24 of 68
pt
AUTHOR SUBMITTED MANUSCRIPT - MRX-105287.R1
Figure 10: XPS spectra of (a) Cr (b) Mo (c) Ni (d) Fe and (e) O 24
us cri
ce
pte
dM
an
Figure 11: SEM micrograph of 316L after potentiodynamic polarization in (a) HA (b) HA + NaCl (c) NaCl
Ac
1 2 3 4 5 6 7 8 9 10 11 12 13 14 15 16 17 18 19 20 21 22 23 24 25 26 27 28 29 30 31 32 33 34 35 36 37 38 39 40 41 42 43 44 45 46 47 48 49 50 51 52 53 54 55 56 57 58 59 60
AUTHOR SUBMITTED MANUSCRIPT - MRX-105287.R1
pt
Page 25 of 68
25
AUTHOR SUBMITTED MANUSCRIPT - MRX-105287.R1
pt
List of tables Table 1: Potentiodynamic polarization data of various concentrations of HA at 37 °C Table 2. Nyquist data of various concentrations of HA at 37 °C
us cri
Table 3: Potentiodynamic polarization data of various concentrations of NaCl at 37 °C Table 4: Nyquist data of various concentrations of NaCl at 37 °C
Table 5: Potentiodynamic polarization of 316L SS in 321mg/100ml HA with various concentrations of NaCl at 37 °C
ce
pte
dM
an
Table 6: Nyquist data of 316L SS in 321mg/100ml HA with various concentrations of NaCl at 37 °C
Ac
1 2 3 4 5 6 7 8 9 10 11 12 13 14 15 16 17 18 19 20 21 22 23 24 25 26 27 28 29 30 31 32 33 34 35 36 37 38 39 40 41 42 43 44 45 46 47 48 49 50 51 52 53 54 55 56 57 58 59 60
Page 26 of 68
26
Page 27 of 68
Ecorr
icorr
βa
(mV)
(µA/cm2)
(mV)
250
-206.1
0.076
321
-183.1
0.108
365
-168.9
0.126
(mV)
336.6
149.1
371.1
145.1
432.3
188.5
an dM pte ce 27
βc
us cri
Concentration of HA (mg/100mL)
pt
Table 1: Potentiodynamic polarization data of various concentrations of HA at 37 °C
Ac
1 2 3 4 5 6 7 8 9 10 11 12 13 14 15 16 17 18 19 20 21 22 23 24 25 26 27 28 29 30 31 32 33 34 35 36 37 38 39 40 41 42 43 44 45 46 47 48 49 50 51 52 53 54 55 56 57 58 59 60
AUTHOR SUBMITTED MANUSCRIPT - MRX-105287.R1
Table 2. Nyquist data of various concentrations of HA at 37 °C CPE2 (F.s(a-1))
n2
R2 (Ω.cm2)
CPE3 (F.s(a-1))
22.1×10⁻⁶
0.74
2.30 ×10⁶
3.15×10⁻⁹
0.56
173.9
n3
R3 (Ω.cm2)
us cri
Concentration Rs of HA (Ω.cm2) (mg/100mL) 250 197.8 334.3
26.4×10⁻⁶
0.70
1.66 ×10⁶
3.85×10⁻⁹
0.46
302.9
365
169.9
29.3×10⁻⁶
0.72
6.5 ×10⁵
9.06×10⁻⁶
0.85
21.9
ce
pte
dM
an
321
Ac
1 2 3 4 5 6 7 8 9 10 11 12 13 14 15 16 17 18 19 20 21 22 23 24 25 26 27 28 29 30 31 32 33 34 35 36 37 38 39 40 41 42 43 44 45 46 47 48 49 50 51 52 53 54 55 56 57 58 59 60
Page 28 of 68
pt
AUTHOR SUBMITTED MANUSCRIPT - MRX-105287.R1
28
Table 3: Potentiodynamic polarization data of various concentrations of NaCl at 37 °C Concentration of NaCl
Ecorr
icorr
βa
βc
(mV)
(µA/cm2)
(mV)
(mV)
0.036 wt.%
-111.2
0.135
497.2
156.9
686.2
0.36 wt.%
-155.0
0.170
307.5
118.7
379.6
3.6 wt.%
-230.9
0.239
396.1
119.5
178.0
29
Epit
us cri
an dM pte ce
Ac
1 2 3 4 5 6 7 8 9 10 11 12 13 14 15 16 17 18 19 20 21 22 23 24 25 26 27 28 29 30 31 32 33 34 35 36 37 38 39 40 41 42 43 44 45 46 47 48 49 50 51 52 53 54 55 56 57 58 59 60
AUTHOR SUBMITTED MANUSCRIPT - MRX-105287.R1
pt
Page 29 of 68
Table 4: Nyquist data of various concentrations of NaCl at 37 °C CPE2 (F.s(a-1))
n2
R2 (Ω.cm2)
CPE3 (F.s(a-1))
n3
R3 (Ω.cm2)
us cri
Concentration Rs (Ω.cm2) of NaCl 2.5
34.2×10⁻⁶
0.80
1.11 ×10⁶
12.7×10⁻⁶
0.54
106.2
0.36 wt.%
17.6
35.5×10⁻⁶
0.85
3.70×10⁵
0.26×10⁻⁶
0.74
839.6
3.6 wt.%
25.3
57.7×10⁻⁶
0.83
1.41 ×10⁵
0.14×10⁻⁶
0.59
1015.3
ce
pte
dM
an
0.036 wt.%
Ac
1 2 3 4 5 6 7 8 9 10 11 12 13 14 15 16 17 18 19 20 21 22 23 24 25 26 27 28 29 30 31 32 33 34 35 36 37 38 39 40 41 42 43 44 45 46 47 48 49 50 51 52 53 54 55 56 57 58 59 60
Page 30 of 68
pt
AUTHOR SUBMITTED MANUSCRIPT - MRX-105287.R1
30
Page 31 of 68
pt
Table 5: Potentiodynamic polarization of 316L SS in 321mg/100ml HA with various concentrations of NaCl at 37 °C Concentration of NaCl
Ecorr
icorr
βa
βc
(mV)
(µA/cm2)
(mV)
(mV)
0.036 wt.%
-173.6
0.047
368.2
158.7
980.7
0.36 wt.%
-197.3
0.070
427.1
175.8
379.1
3.6 wt.%
-236.2
0.110
396.1
157.9
270.2
31
Epit
us cri
an dM pte ce
Ac
1 2 3 4 5 6 7 8 9 10 11 12 13 14 15 16 17 18 19 20 21 22 23 24 25 26 27 28 29 30 31 32 33 34 35 36 37 38 39 40 41 42 43 44 45 46 47 48 49 50 51 52 53 54 55 56 57 58 59 60
AUTHOR SUBMITTED MANUSCRIPT - MRX-105287.R1
AUTHOR SUBMITTED MANUSCRIPT - MRX-105287.R1
CPE2
R2
CPE3
of NaCl
(Ω.cm2)
(F.s(a-1))
(Ω.cm2)
(F.s(a-1))
0.036 wt.%
2.2
32.2×10⁻⁶
0.77
3.51 ×10⁶
11.7×10⁻⁶
0.92
104.3
0.36 wt.%
14.4
34.5×10⁻⁶
0.84
2.74×10⁶
0.29×10⁻⁶
0.47
217.6
3.6 wt.%
87.7
51.7×10⁻⁶
0.82
5.02 ×10⁵
0.96×10⁻⁶
0.55
141.0
n2
n3
R3
(Ω.cm2)
us cri
Rs
ce
pte
dM
an
Concentration
pt
Table 6: Nyquist data of 316L SS in 321mg/100ml HA with various concentrations of NaCl at 37 °C
Ac
1 2 3 4 5 6 7 8 9 10 11 12 13 14 15 16 17 18 19 20 21 22 23 24 25 26 27 28 29 30 31 32 33 34 35 36 37 38 39 40 41 42 43 44 45 46 47 48 49 50 51 52 53 54 55 56 57 58 59 60
Page 32 of 68
32
Page 33 of 68
pt
Journal Name: Materials Research Express
us cri
Manuscript Title: Effect of concentration of Hyaluronic Acid and NaCl on Corrosion Behavior of 316L Austenitic Stainless Steel Manuscript Number: MRX-105287 Dear Editor,
Thank you for your constructive suggestions on the language and structure of our manuscript. We have revised the manuscript accordingly. The detailed corrections are listed below in blue colored text:
dM
an
Referee:1 COMMENTS TO THE AUTHOR(S) Dear Authors, I want to thank you for your sincere efforts to advance our knowledge of corrosion behavior of stainless steels in biological applications. Low cost, reliable and corrosion resistant artificial implants are becoming extremely important materials. Your electrochemical testing reveals an interesting synergistic effect of HA and NaCl concentration on the corrosion behavior of SS. I have a couple of suggestions which will improve the quality of your paper.
pte
Comment 1. Can you please mention what is Cl ion concentration that is normally present in blood serum or synovial fluid ? This will give the reader a comparative basis to judge the NaCl concentration that is being used in your experiments vs the actual environment that SS gets exposed to, in human body. Thanks for the suggestion, it is generally found that the Cl ion concentration in body fluid was found to be 87-138 mmol/L in synovial fluid [1].
ce
Comment 2. You are finding that stainless steel alloy is showing superior corrosion resistance in a certain composition of NaCl + HA. I am a bit concerned about how this is important from practical applications perspective. As you are aware, composition of body fluids is rather a fixed quantity. A normal approach would be to alter the alloy composition that shows the better corrosion resistance in that fixed environment rather than changing the body chemistry itself. I wonder if you can elaborate the motivation behind this experimental set-up. That will help the reader to understand the context of your research. Thank you for the suggestive comments, I agree with the reviewer that the composition of the body fluid is almost a fixed quantity and does not vary much. It is established that along with titanium, Co-Cr-Mo, 316L is also used as a material for bio implants. As 316L is the cheap materials form rest of the alloy. Therefore, our study was focused on cheaper alloy. As it was found that increase in alloy content in the alloy would also increase the ion release in the body. It has been reported
Ac
1 2 3 4 5 6 7 8 9 10 11 12 13 14 15 16 17 18 19 20 21 22 23 24 25 26 27 28 29 30 31 32 33 34 35 36 37 38 39 40 41 42 43 44 45 46 47 48 49 50 51 52 53 54 55 56 57 58 59 60
AUTHOR SUBMITTED MANUSCRIPT - MRX-105287.R1
33
AUTHOR SUBMITTED MANUSCRIPT - MRX-105287.R1
us cri
pt
that Cr and Ni are predominantly present as free ions (Cr3+ and Ni2+) which release into the body [2]. Also, the release of metal ions in the body are not proportional to bulk alloy composition. Hence change in alloy content in human body is not always useful [3]. Various researchers have worked on biomaterials in various chloride concentration [4][5] of which Yan et al. have investigated on bio tribocorrosion of CoCrMo orthopaedic implant materialsassessing the formation and effect of the biofilm in 0.36% NaCl solution [6]. To study the corrosion behavior of our steel we have varied the NaCl concentration to one order of magnitude (0.036%, 0.36% and 3.6 wt.% NaCl) in HA solution. [1] Emely Lea Bortel, Baptiste Charbonnier and Roman Heuberger, Development of a Synthetic Synovial Fluid for Tribological Testing, Lubricants (2015) 3: 664-686
an
[2] Inger Odnevall Wallinder, Sofia bertling, Dan Berggren Kleja and Christofer Leygraf. Corrosion-induced release and environmental interaction of chromium, nickel and iron from stainless steel. Water, Air, and Soil Pollution (2006) 170: 17–35
dM
[3] Mohd Talha, C.K. Behera, O.P. Sinha, A review on nickel-free nitrogen containing austenitic stainless steels for biomedical applications, Materials Science and Engineering C (2013) 33: 3563–3575. [4] C. Valero Vidal and A. Igual Muñoz, Electrochemical characterisation of biomedical alloys for surgical implants in simulated body fluids, Corros. Sci., 50, 1954 (2008).
pte
[5] S. Karimi, T. Nickchi, and A. Alfantazi, Effects of bovine serum albumin on the corrosion behaviour of AISI 316L, Co-28Cr-6Mo, and Ti-6Al-4V alloys in phosphate buffered saline solutions, Corros. Sci. 53, 3262 (2011). [6] Y. Yan, A. Neville, D. Dowson, Biotribocorrosion of CoCrMo orthopaedic implant materials-Assessing the formation and effect of the biofilm, Tribol. Int. 40 (2007) 1492–1499. Other minor corrections:
ce
1) Page 4 line 8: Use of stainless steel (correct grammatical error) As suggested by the reviewer the grammar have been corrected in the revised manuscript 2) Page 4 line 20: begins with which may lead ((correct grammatical error) The grammar have been corrected in the revised manuscript
Ac
1 2 3 4 5 6 7 8 9 10 11 12 13 14 15 16 17 18 19 20 21 22 23 24 25 26 27 28 29 30 31 32 33 34 35 36 37 38 39 40 41 42 43 44 45 46 47 48 49 50 51 52 53 54 55 56 57 58 59 60
Page 34 of 68
3)Page 4 line 37: coated with of ? (correct grammatical error) The grammar have been corrected in the revised manuscript 34
4) Page 5 line 9: Consider revising grammar: Few literature The grammar have been corrected in the revised manuscript
us cri
5) Page 9: 46: "It can be observed that there is adsorbed HA on the surface of the sample which may cause metal dissolution and hence initiation sites for pitting." There is no basis to make this statement based on SEM image. SEM image is not showing any adsorbed layer. Please revise this or put this in your XPS data interpretation. The statement about HA adsorption have been removed from the revised manuscript.
an
Referee: 2 COMMENTS TO THE AUTHOR(S) Review Report On the manuscript "Effect of concentration of Hyaluronic Acid and NaCl on Corrosion Behavior of 316L Austenitic Stainless Steel"
dM
1. Some grammar errors appear in the manuscript. All the grammar corrections have been made in the revised manuscript 2. Rewrite the abstract. Abstract have been rewritten.
3. Correct the mistakes words dictated which marked through the manuscript text. Thanks for the corrections. All the mistakes has been corrected.
pte
4. Rewrite the keywords. The keywords have been rewritten as suggested by the reviewer in the revised manuscript. 5. For abbreviations of the first appearance in the manuscript including conclusions, should give a full explanation such as EIS. Suggested changes have been made in the revised manuscript.
ce
6. Please, check the names of the authors in the reference [22]. The reference number 22 is corrected in the revised manuscript 7. There are too many sections and subsection dividing manuscript, it must be simplified. The section and sub sections have been reduced as suggested by the reviewer
Ac
1 2 3 4 5 6 7 8 9 10 11 12 13 14 15 16 17 18 19 20 21 22 23 24 25 26 27 28 29 30 31 32 33 34 35 36 37 38 39 40 41 42 43 44 45 46 47 48 49 50 51 52 53 54 55 56 57 58 59 60
AUTHOR SUBMITTED MANUSCRIPT - MRX-105287.R1
pt
Page 35 of 68
8. Modify the writing of all tables. All the tables have been rewritten in the revised manuscript. 35
AUTHOR SUBMITTED MANUSCRIPT - MRX-105287.R1
ce
pte
dM
an
us cri
We are highly hopeful that changes in the manuscript will be satisfactory.
pt
The authors appreciate the Reviewers for their constructive comments on the manuscript. It has helped us to improve the quality of the manuscript. We have tried to attend all the comments and amend our manuscript in order to improve the quality and readability.
Ac
1 2 3 4 5 6 7 8 9 10 11 12 13 14 15 16 17 18 19 20 21 22 23 24 25 26 27 28 29 30 31 32 33 34 35 36 37 38 39 40 41 42 43 44 45 46 47 48 49 50 51 52 53 54 55 56 57 58 59 60
Page 36 of 68
36
Page 37 of 68
pt
Effect of concentration of Hyaluronic Acid and NaCl on Corrosion Behavior of 316L Austenitic Stainless Steel
us cri
Ankur V. Bansod1, Nilay N. Khobragade2, Karansagar V. Giradkar3 and Awanikumar. P. Patil1
1) Ankur V. Bansod (Corresponding author) Affiliation: Department of Metallurgical and Materials Engineering, Visvesvaraya National Institute of Technology (VNIT), Nagpur-440010, India Phone: +919763939013 Email –
[email protected]
an
2) Nilay N. Khobragade Affiliation: Department of Metallurgical Engineering, Government College of Engineering, Amravati, 444604, India Phone: +919420569654 Email –
[email protected]
dM
3) Karansagar V. Giradkar Affiliation: Department of Mechanical Engineering Department of Mechanical Engineering, Dr. Babasaheb Ambedkar Technological University, Lonere, Raigad, India – 402103 Phone: +918149776997 Email –
[email protected]
ce
pte
4) Awanikumar P. Patil Affiliation: Department of Metallurgical and Materials Engineering, Visvesvaraya National Institute of Technology (VNIT), Nagpur-440010, India Phone: +919422163166 Email –
[email protected]
Ac
1 2 3 4 5 6 7 8 9 10 11 12 13 14 15 16 17 18 19 20 21 22 23 24 25 26 27 28 29 30 31 32 33 34 35 36 37 38 39 40 41 42 43 44 45 46 47 48 49 50 51 52 53 54 55 56 57 58 59 60
AUTHOR SUBMITTED MANUSCRIPT - MRX-105287.R1
1
AUTHOR SUBMITTED MANUSCRIPT - MRX-105287.R1
pt
Effect of concentration of Hyaluronic Acid and NaCl on Corrosion Behavior of 316L Austenitic Stainless Steel
us cri
Ankur V. Bansod1, Nilay N. Khobragade2, Karansagar V. Giradkar3 and Awanikumar. P. Patil1 1) Department of Metallurgy and Material Science, Visvesvaraya National Institute of Technology, Nagpur, India - 440010
2) Department of Metallurgical Engineering, Government College of Engineering, Amravati, 444604, India
ce
pte
dM
an
3) Department of Mechanical Engineering, Dr. Babasaheb Ambedkar Technological University, Lonere, Raigad, India – 402103
Ac
1 2 3 4 5 6 7 8 9 10 11 12 13 14 15 16 17 18 19 20 21 22 23 24 25 26 27 28 29 30 31 32 33 34 35 36 37 38 39 40 41 42 43 44 45 46 47 48 49 50 51 52 53 54 55 56 57 58 59 60
Page 38 of 68
2
Page 39 of 68
pt
ABSTRACT
an
us cri
Due to low cost and easily available material, 316L stainless steel (SS) is used for biomedical implants. The electrochemical corrosion behavior of 316L (SS) was studied as a function of the concentration of simulated biological fluid (Hyaluronic acid), the influence of Cl- and the combined effect of NaCl and Hyaluronic acid (HA). For the electrochemical tests, potentiodynamic polarization test and electrochemical impedance spectroscopy (EIS) were undertaken. With the increase in HA concentration, corrosion rate increases. Whereas, with the addition of NaCl to HA the solution, the corrosion resistance of the sample was enhanced. Also, in pure NaCl solution, the corrosion current density (icorr) increased as compared to bare HA and HA + NaCl. This is due to the adhesion property of the HA on the sample surface. EIS result agrees with the findings of potentiodynamic polarization tests. X-ray photoelectron spectroscopy (XPS) was executed to analyze the passive film formed in the solution of HA and NaCl on 316L SS. XPS spectra confirms the formation of the passive film containing chromium oxide and hydroxides. Also, the formation of MoO2 helps in improving better corrosion resistance. The peak of nitrogen was observed in the sample immersed in HA solution. Scanning electron microscope (SEM) was carried out to analyze the surface morphology.
ce
pte
dM
Keywords: Hyaluronic acid; Biomaterials (316L SS); Adsorption; X-ray photoelectron spectroscopy (XPS).
Ac
1 2 3 4 5 6 7 8 9 10 11 12 13 14 15 16 17 18 19 20 21 22 23 24 25 26 27 28 29 30 31 32 33 34 35 36 37 38 39 40 41 42 43 44 45 46 47 48 49 50 51 52 53 54 55 56 57 58 59 60
AUTHOR SUBMITTED MANUSCRIPT - MRX-105287.R1
3
AUTHOR SUBMITTED MANUSCRIPT - MRX-105287.R1
pt
1. INTRODUCTION
an
us cri
Various alloys like titanium and cobalt as well as few grades of stainless steel like 316L are commonly used in artificial implants [1]. In developed countries, titanium and cobalt are extensively used due to their better corrosion resistance and better mechanical properties. However, in developing countries, use of stainless steels as temporary as well as permanent implants due to its economic aspects and adequate corrosion resistance although lower than the predecessor. It is imperative for biomedical implants that it should have better mechanical properties when placed in service [1]. Also, the implants should be completely inert in the human body fluids. However, it is difficult to achieve complete inertness in the body. Organic fluid is reactive to metallic implants and can release metal ions inside the body [2]. If the corrosion process occurred inside the human body, the release of metallic ions such as Ni+2, Cr+3 and Cr+6, would produce serious health risks [3]. All implants have the tendency to corrode which could be minimized by the formation of the passive layer over the surface. The acceptable level of corrosion level is highly important for the implants. High corrosion rate may lead to damage of the surrounding tissues of the body [4]. The efficiency of the implants depends on the passivation and repassivation of the protective film under immersion media. In general, the passive film formed over the surface of 316L stainless steel (SS) is mainly composed of the film of oxide and hydroxide which helps in reducing dissolution of metal ions [5].
pte
dM
In human body Hyaluronic acid (HA) occurs naturally, It is a carbohydrate (mucopolysaccharide), made up of a long chain of sugars (carbohydrates). Hyaluronic acid (HA) consists of a linear polysaccharide of alternating D-glucuronic acid (GlcU) and N-acetyl-D- glucosamine (GlcNAc) units, which has a three-dimensional structure in solution that shows extensive intramolecular hydrogen bonding [6]. HA has high molecular weight (105–107 Da), and when mixed with water exhibits gel-like properties including viscosity as a function of molecular weight [7]. Numerous biological functions have been associated with HA. HA plays a vital role in the orthopedic application. It helps in the development of cartilage, maintenance of the synovial fluid and the regeneration of the tendons. It also acts as a lubricant and shock absorber in the joints. Pitt et al. have found that the 316L SS surface is adversely affected by biological activity and it can be mitigated by bioactive when coated with HA [6].
ce
The corrosion resistance of the passive film of 316L is high, however, the passive film of SS is highly susceptible to pitting corrosion in presence of halides. Pitting corrosion limits the application of biomedical implants by adversely affecting both the biocompatibility and mechanical strength of the implants [8]. Various authors have studies the electrochemical behavior of stainless steel in simulated body fluids in stainless steel. Frateur et al. carried out the electrochemical tests on ferritic stainless steel using time-potential plots and potentiodynamic polarization tests in bovine serum albumin [9]. Kocijan et al. worked on the AISI 316L SS to study the effect of model proteins on the passivation behavior [10]. Karimi et al. have studied the effect of concentration of bovine serum albumin (BSA) on corrosion behavior of AISI 316L, Co–28Cr– 6Mo, and Ti–6Al–4V alloys in phosphate buffered saline solutions [11]. It was observed that with an increase in the concentration of BSA the stability of passive film increase [11]. Milosev et al. investigated on Co-Cr-Mo in NaCl with other biological solutions and concluded that the corrosion potential (Ecorr) was approximately equal to -0.3V vs SCE and its passive current density (ip) was approximately 1µA/cm2 [12]. It is generally found that the Cl ion concentration in body fluid was found to be 87-138 mmol/L in synovial fluid [13]. Igual et al. investigated in-vivo electrochemical
Ac
1 2 3 4 5 6 7 8 9 10 11 12 13 14 15 16 17 18 19 20 21 22 23 24 25 26 27 28 29 30 31 32 33 34 35 36 37 38 39 40 41 42 43 44 45 46 47 48 49 50 51 52 53 54 55 56 57 58 59 60
Page 40 of 68
4
Page 41 of 68
us cri
pt
corrosion studies on synovial fluid and found that the corrosion rate significantly varies with the concentrations of synovial fluid [14]. In another experiment by Milosev et al., HA + NaCl and Hanks solution were used and they found that the passive current density remains constant in NaCl up to 0.6V vs SCE, whereas, on an addition of HA passive current density remains constant only up to 0.2V vs SCE [15]. It has been reported that Cr and Ni are predominantly present as free ions (Cr3+ and Ni2+) which release into the body [16]. Also, the release of metal ions in the body is not proportional to bulk alloy composition. Hence change in alloy content in the human body is not always useful [17]. Various researchers have worked on biomaterials in various chloride concentration of which Yan et al. have investigated on bio tribocorrosion of CoCrMo orthopedic implant materials-assessing the formation and effect of the biofilm in 0.36% NaCl solution [18][11][12][19].
dM
an
Various studies have been conducted on the corrosion behaviour of metallic implants in numerous biological solutions. Few literature concerning the corrosion behavior of 316L SS in HA is available. Since Surface characterization of the alloys used in bioimplants have great significance and influence the performance of the implant through the interaction between the film and the tissue, and the possible migration of metallic ions from the base metal to the surrounding tissues. To evaluate the corrosion behavior of our steel we have varied the NaCl concentration to one order of magnitude (0.036%, 0.36% and 3.6 wt.% NaCl) in HA solution. In this study on electrochemical behavior using potentiodynamic polarization test, electrochemical impedance spectroscopy (EIS) and surface characterization using X-ray photoelectron spectroscopy (XPS) of 316L SS in HA and NaCl solution are investigated. 2. MATERIALS AND METHOD
ce
pte
The presented work was conducted on commercially available 316L alloy having a composition (weight %) as Cr 18.1, Ni 12.1, Mo 2.45, C 0.03, Si 0.37, N 0.06 and remaining Fe. To study the effect of concentration of biological media and NaCl on the corrosion behavior of 316L alloy, three different investigations were conducted. One comprising of a variety of concentrations of hyaluronic acid (HA), another perceive the effect of increasing in Cl ions concentration and finally combined effect of HA + NaCl as an electrolyte for the corrosion tests of 316L alloy. In this investigation, simulated biological media was prepared with the help of hyaluronic acid (HA). Hyaluronic acid was procured from Kopuron Max, Kumar Organic Products Limited, Bangalore, India. Figure 1 shows the structure of HA. The concentration of HA in the test solution (HA + NaCl) was taken as 321mg/100mL according to the medical reports from Decker et al. [20]. This concentration is similar to the concentration of HA in synovial fluid of a healthy person [20]. The concentration of sodium chloride was increased by one order of magnitude from 0.036 wt%, 0.36 wt% and 3.6 wt% in 321mg/100mL HA solution. The pH of the test solution was also noted and it was observed that no significant alteration was caused before and after the polarization test of each sample. During each test, the temperature was maintained at 37 ºC with a constant temperature bath and it was conducted in an aerated environment. The samples with a dimension of 10 mm × 10 mm × 3 mm was prepared using the wire cut electron discharge machine (EDM). These samples were polished with emery papers of gradually decreasing grit sizes (150, 320, 600, 800, 1000, 1200 and 1500) on a polishing disc and ultrasonically cleaned thereafter in the distilled water bath. Electrochemical measurements were carried out using a conventional three-electrode electrochemical cell (counter electrode, the
Ac
1 2 3 4 5 6 7 8 9 10 11 12 13 14 15 16 17 18 19 20 21 22 23 24 25 26 27 28 29 30 31 32 33 34 35 36 37 38 39 40 41 42 43 44 45 46 47 48 49 50 51 52 53 54 55 56 57 58 59 60
AUTHOR SUBMITTED MANUSCRIPT - MRX-105287.R1
5
AUTHOR SUBMITTED MANUSCRIPT - MRX-105287.R1
dM
an
us cri
pt
reference electrode and working electrode) in fully aerated condition. A constant temperature of 37 ºC was maintained in all the experiments using Cyber Lab CB 2000, a constant temperature bath. A platinum wire mesh and an SCE electrode were employed as a counter and a reference electrode, respectively. Electrochemical measurements were performed using a Biologic potentiostat (model VMP 300) and EC-lab software. Open circuit potential (OCP) or time potential measurement was executed in order to stabilize the potential for 60 min. Stable OCP was attained in less than 60 minutes in all the cases. Electrochemical impedance spectroscopy (EIS) tests were carried out under open circuit conditions. A sinusoidal AC signal of 10mV was applied in the frequency range of 105 to 10-2 Hz using a potentiostat. The results were subsequently analyzed by EC-lab software and fitted with the corresponding equivalent circuit. The equivalent circuit is shown in Figure 2. Potentiodynamic polarization was conducted in the range of -500 mV to 1200 mV vs saturated calomel electrode (SCE) at a scan rate of 0.1667 mV/s (Ref 24). Tests were conducted at the end of EIS measurement in order to determine the corrosion rate of each sample. Corrosion potential (Ecorr), as well as the corrosion current density (icorr), were measured from the polarization graphs by Tafel extrapolation method. Passive current density (ip) and breakdown potential (Eb) were also obtained from the potentiodynamic curves. Moreover, each experiment was repeated thrice to verify the reproducibility. The surface analysis is carried out using scanning electron microscopy (SEM) (JEOL JSM 6380). X-ray photoelectron microscopy (XPS) was conducted for two samples of 316L alloy after dipping in 321mg/100mL HA and 3.6% NaCl respectively for 15-days duration. Specimens were later rinsed, ultrasonically cleaned and dried off. 3. RESULTS AND DISCUSSIONS
3.1 Influence of increasing concentration of HA
ce
pte
Figure 3 shows the variation in potentiodynamic polarization curves of 316L alloy with the change in concentration of hyaluronic acid from 250mg/100ml to 365mg/100ml at 37 ºC. Cathodic current density was observed to change by more than one order of magnitude. After cathodic region, the specimen revels passive region followed by transpassive region. In cathodic reaction, mainly oxygen reduction reaction will take place. This is due to the scavenging action of HA, which reduces the level of reacting oxygen species [21]. Karimi et al. reported the presence of some reduction of proteins over the surface [11]. The passive region extends from 0 to 1.0 V vs SCE. The breakdown of passivity occurred at almost 1.1 V which is the start of the transpassive region. Cathodic part of the plots is almost linear indicating reactions are activation controlled and are shifted to lower potentials when there was a surge in the HA concentration. These results are in agreement with the findings led by Vidal and Munoz [18] [14]. Also, no distinctive difference in passive current density was observed in the plots, which is in agreement with the results of previous studies [22]. Table 1 shows that with an increase in the concentration of HA, the corrosion rate of the alloy slightly increases manifested with an increase in icorr values. The increase in icorr could be attributed to the absorption of HA on the surface of alloy causing metal dissolution. The value of Ecorr shifts in the noble direction (positive) with increase in HA concentration. Hence stability of the passive film is more in higher concentration of HA. The passive current density increases with increase in HA concentration measured at the potential of 0.4 V (0.64, 0.82 and 1.3 µA respectively).
Ac
1 2 3 4 5 6 7 8 9 10 11 12 13 14 15 16 17 18 19 20 21 22 23 24 25 26 27 28 29 30 31 32 33 34 35 36 37 38 39 40 41 42 43 44 45 46 47 48 49 50 51 52 53 54 55 56 57 58 59 60
Page 42 of 68
6
𝑍(𝑓) = 𝑅𝑠 +
𝑅2 𝑅2 .𝐶𝑃𝐸2 .(𝑗𝜔)𝑛2 +1
+
us cri
Figure 4 shows the Nyquist plots for 316L samples with increased concentrations of HA solution at 37 ºC. Plots represent a large semi-circular capacitive loop. The circuit fitting of EIS data was accomplished with the help of five element equivalent electrical circuits as shown in Figure 2. Similar circuit was also used by other authors [11][23] for explaining adsorption phenomena. Some authors have also used simple Randle’s circuit with one time constant [22] [24], however, circuit presented in Figure 2, best fits the EIS data. The fitted data is shown by continuous lines whereas the original data is shown with different symbols. To consider the non-homogeneities related to adsorption of HA on the sample surface, constant phase element (CPE) was used instead of a pure capacitor. The impedance of the circuit can be evaluated by Eq. 1. 𝑅3 𝑅3 .𝐶𝑃𝐸3 .(𝑗𝜔)𝑛3 +1
(1)
dM
an
Where, ω = 2πf, exponent n2 and n3 is a coefficient related to the deviation between real and pure capacitance, ω is angular frequency and f is frequency. The plot was fitted with the help of Z Fit software package provided in the EC-lab software. Similarly, Rs is the solution resistance, R2 is the resistance provided by adsorbed layer and oxide layer resistance is designated by R3. CPE2 and CPE3 are the corresponding constant phase elements for adsorbed layer and oxide layer as shown in Figure 4. Fitted values of the Nyquist plots are presented in Table 2. In Impedance measurement, the higher value of R2 implies higher corrosion resistance in the alloy. Hence, results in lower dissolution of cations from the alloy surface [11]. The increase in HA results in less value of R2. It is probably because of HA adsorption on the surface causing metal dissolution [18]. The increase in R2 signifies low capacitance (CPE2) which resembles long term stability of the passive film formed on the surface. Vidal et.al. has explained that alteration of ionic conductivity is due to the increase in the concentration of simulated biological fluid [25]. 3.2 Influence of increasing concentration of NaCl
ce
pte
Figure 5 shows potentiodynamic polarization of different concentration of NaCl showing anodic and cathodic parts of polarization curves. It can be observed that cathodic part of the polarization curve does not change too much with the increase in NaCl concentration. The cathodic reaction in NaCl solution is mainly due to oxygen reduction reaction. It is evident from the Figure 5 that Ecorr is the function of Cl-. The increase in Cl- shifts the Ecorr in active (negative direction) as given in Table 3. The cathodic part of the plots in Cl- is almost activation controlled (just below the Ecorr) towards active potential. In anodic part of polarization is activation controlled for all concentrations. The equations given by Sato for explaining the effect of hydroxyl and chloride ions in metal dissolution is given below [26][27].
(4)
M + Cl- → MClad + H+ + e-
(5)
MClad → MCl+ + e-
(6)
M + H2O → MOHad + H+ + e-
(2)
MOHad → MOH+ + e-
(3)
MOH+ → M2+ + OH-
Ac
1 2 3 4 5 6 7 8 9 10 11 12 13 14 15 16 17 18 19 20 21 22 23 24 25 26 27 28 29 30 31 32 33 34 35 36 37 38 39 40 41 42 43 44 45 46 47 48 49 50 51 52 53 54 55 56 57 58 59 60
AUTHOR SUBMITTED MANUSCRIPT - MRX-105287.R1
pt
Page 43 of 68
7
AUTHOR SUBMITTED MANUSCRIPT - MRX-105287.R1
MCl+ → M2+ + Cl-
pt
(7)
2Cr + 3H2O → Cr2O3 + 6H+ + 6e-
(8)
us cri
Hydroxyl mechanism is given in Eq. 2-4, chloride mechanism in Eq. 5-7 and formation of the passive film in aqueous media are given in Eq. 8. Since pH of the solution was almost constant. Hence the effect of hydroxyl ions (OH-) concentration will be same. However, there is a change in Cl- concentration which results in the change in Ecorr. The value of icorr increases as the concentration of Cl- increases. At potential of 0.2 V (SCE), it can be observed that anodic current density increases with the increase in Cl- which is attributed to high dissolution of metal ions (metal dissolution, Eq.5-7) in the solution. At the pitting potential there is a sudden increase in the current density. A linear relationship coexists between the Cl- concentrations according to the Eq. 9 [28] Epit = a – b log CCl-
(9)
dM
an
Where a and b are constants and depends upon the chemical composition of the alloy. Hence, for a given chemical composition the value of Epit mainly depends upon the Cl- concentration. It has been reported that Cl- in the environment deteriorates the passive film which results in preferential sites for the pit to form on the surface. Once the pit is initiated the pitting growth and propagation is continued in active dissolution mode and anodic current density increases rapidly as seen in Figure 5.
pte
Figure 6 shows fitted Nyquist plots for various solutions (1%, 2% and 3%) of NaCl. The fitted parameters are listed in Table 4. The fitted equivalent circuit is shown in Figure 2 and was valid for all the Nyquist graphs. It is observed the value of R2 decreases with increase in NaCl concentrations. This is attributed to decrease of corrosion resistance of the passive film over the surface. The resistance of the passive film was higher in 1% NaCl solution. It was also observed that resistance of the porous film (R3) was lower than the resistance of the passive film. This may be due to the fact that the electrolyte solution in the micropores or interstitials was partly shortcircuited [29]. 3.3 Influence of hyaluronic acid and sodium chloride
ce
Figure 7 displays potentiodynamic polarization plots of 316L alloy with increasing concentration of NaCl (from 0.036% to 3.6%) in 321mg/100mL HA solution. The cathodic part of the plots is almost similar in behavior (activation just below Ecorr). Passive current density was found to be of the order of 1 µA/cm2. Ecorr, icorr, and Epit values were evaluated using the EC-lab software and are listed in Table 5. The passive region can be observed for all the three solutions. With increase in NaCl concentration the passive region decreases substantially followed by stable pit over the surface (Epit). In general, comparing the polarization data with the pure NaCl solution the Epit increases. Hence, there is an increase in the passive region also. With an increase in NaCl concentration, the polarization graph shift towards the right (with current density) followed by shift in Ecorr towards active (negative) direction. This shift of Ecorr deteriorates the formation of a passive film over the surface. The corrosion current density also increases. Hence, it was evident that higher the concentration of NaCl in presence of hyaluronic acid, the more the corrosion rate
Ac
1 2 3 4 5 6 7 8 9 10 11 12 13 14 15 16 17 18 19 20 21 22 23 24 25 26 27 28 29 30 31 32 33 34 35 36 37 38 39 40 41 42 43 44 45 46 47 48 49 50 51 52 53 54 55 56 57 58 59 60
Page 44 of 68
8
Page 45 of 68
us cri
pt
of the alloy. However, comparing icorr of 316L in various NaCl solution (Table 3) with that of 316L in various HA + NaCl solution (Table 5) it is observed that on addition of HA to NaCl improves corrosion resistance. Similarly, on comparting icorr of 316L in 321mg/100mi solution of HA (Table 1) with that of 316L in various HA + NaCl solution (Table 5). It is seen that addition of NaCl (upto 0.36%) too improves corrosion resistance. It is also seen that addition of 3.6 % NaCl has almost negligible effect. It follows that HA and NaCl together are more effective in improving corrosion resistance.
3.4 Surface characterization
an
Figure 8 shows Nyquist plot for 316L SS samples in 321mg/100mL HA solution with increased concentration of NaCl from 0.036% to 3.6% at 37 °C. Nyquist plots represent a large semi-circular capacitive loop. For fitting of the EIS data, the five-element equivalent circuit was employed as depicted in Figure 2 and the corresponding parameter is presented in Table 6. It was further observed from the values that polarization resistance decreases with an increase in the concentration of NaCl in HA. On comparing Table 2 and Table 6, it can be deduced that polarization resistance decrease in solutions of HA containing NaCl than that of purely HA solution. This can results in more metal dissolution in an alloy containing NaCl.
ce
pte
dM
Figure 9 (a and b) shows the XPS analysis of 316 SS sample immersed in 0.36% NaCl and 321mg/100mL HA + 0.36% NaCl solution for 15 days at 37 °C temperature (pH = 7). The XPS analysis of the surface revealed the following elements: Carbon (C 1s), Oxygen (O 1s), Chromium (Cr 2p), Molybdenum (Mo 3d), Nickel (Ni 2p) and Iron (Fe 2p). XPS analysis reveals separate binding energy for Cr (575.6 eV) in the form of Cr2p3/2 and Cr2p1/2 as shown in Figure 10 (a). They corresponds to trivalent chromium. The higher binding energy of Cr correspond to the formation of CrO3. The formation of Cr3+ oxide confirms the formation of Cr2O3 [30]. The XPS spectra of Mo (227.5 eV) can be seen to form Mo 3d5/2 and Mo 3d3/2 as shown in Figure 10 (b). It was reported that Mo is present in mixed valance state Mo6+ and Mo5+ with higher predominance of Mo6+ over Mo5+. Hence, the formation of MoO3 and MoO2 may be expected [31]. The binding energy of Ni (857.8 eV) in the form of Ni 2p3/2 and Ni 2p1/2 XPS spectra can be seen in Figure 10 (c). The binding energy represents the formation of Ni(OH)2 and NiO [30]. Also, the presence of Fe (708.1 eV) in the form of Fe2p3/2 and Fe2p1/2 establishes the evidence of the formation of Fe3O4 and FeO(OH) [32]. The deconvoluted O 1s (530.1 eV) spectra result in three peaks as shown in Figure 10 (e). The first peak at lower binding energy resembles the metal oxide (may be oxide of Cr). The second intermediate peak is due to the formation of metal hydroxide and peak at higher binding energy is due to adsorption of H2O. The peak of nitrogen (N 1s) was also observed in the sample containing HA which also helps in reducing metal dilution as compared to pure NaCl solution. Moreover, N 1s (394.4 eV) spectrum in the XPS analysis confirmed the adsorption of HA on the sample surface. This is because N 1s spectrum corresponds to the formation of adsorbed layer by organic matter as explained by Munoz et al. [14]. Figure 11 (a-c) shows the SEM micrograph after potentiodynamic polarization.
Ac
1 2 3 4 5 6 7 8 9 10 11 12 13 14 15 16 17 18 19 20 21 22 23 24 25 26 27 28 29 30 31 32 33 34 35 36 37 38 39 40 41 42 43 44 45 46 47 48 49 50 51 52 53 54 55 56 57 58 59 60
AUTHOR SUBMITTED MANUSCRIPT - MRX-105287.R1
4. CONCLUSIONS On the basis of the experimental study conducted on corrosion behavior of 316L SS, the following critical findings were noted. 9
ce
pte
dM
an
us cri
1. It was observed that with the increase in HA concentration, there was increased dissolution of metal in the solution. There is a marginal increase in the value of icorr. Electrochemical impedance spectroscopy and polarization test reveal that with the increase in HA concentration, there is a retardation of the film formation causing metal dissolution. 2. In pure NaCl solution the value of icorr increases with increase in NaCl concentration. Also, the polarization plots shift towards right indicating higher metal dissolution. These findings correlate with the results of EIS. 3. However, with the addition of NaCl (0.036, 0.36 and 3.6 wt. %) in 321mg/100ml HA solution, it was observed that corrosion resistance of the metal improves as compared to pure NaCl solution. Thus Cl- acts as a barrier for the metal dissolution and hence improves adsorption of HA molecules, thereby forming a thick layer of proteins causing improvement in corrosion resistance. Also, the increase in pitting potential was observed. 4. XPS analysis confirms the formation of the passive film containing oxide and hydroxide of chromium and also beneficial effect of addition of molybdenum. Also, the formation of nickel oxide was observed. Nitrogen peak (N 1s) was observed in the sample containing HA, which could help in improving the stability of the passive film causing lower metal dissolution.
Ac
1 2 3 4 5 6 7 8 9 10 11 12 13 14 15 16 17 18 19 20 21 22 23 24 25 26 27 28 29 30 31 32 33 34 35 36 37 38 39 40 41 42 43 44 45 46 47 48 49 50 51 52 53 54 55 56 57 58 59 60
Page 46 of 68
pt
AUTHOR SUBMITTED MANUSCRIPT - MRX-105287.R1
10
Page 47 of 68
pt
REFERENCES D. A. López, A. Durán, and S. M. Ceré, Electrochemical characterization of AISI 316L stainless steel in contact with simulated body fluid under infection conditions, J. Mater. Sci. Mater. Med. 19, 2137 (2008).
[2]
S. El-Hadad, W. Khalifa, and A. Nofal, Surface modification of investment cast-316L implants: Microstructure effects, Mater. Sci. Eng. C, 48, 320 (2015).
[3]
M. Costa and M. Fernandes, Proliferation / differentiation of osteoblastic human alveolar bone cell cultures in the presence of stainless steel corrosion products, J. Mater. Sci. Mater. Med.11, 141 (2000).
[4]
R. Singh and N. B. Dahotre, Corrosion degradation and prevention by surface modification of biometallic materials, J. Mater. Sci. Mater. Med.18, 725 (2007).
[5]
J. J. Kim and Y. M. Young, Study on the passive film of type 316 stainless steel, Int. J. Electrochem. Sci. 8, 11847 (2013).
[6]
W. G. Pitt, R. N. Morris, M. L. Mason, M. W. Hall, Y. Luo, and G. D. Prestwich, Attachment of hyaluronan to metallic surfaces, J. Biomed. Mater. Res., 68A, 95 (2004).
[7]
J. Necas, L. Bartosikova, P. Brauner, and J. Kolar, Hyaluronic acid (hyaluronan): A review, Vet. Med. (Praha). 53, 397 (2008).
[8]
A. Shahryari, S. Omanovic, and J. A. Szpunar, Electrochemical formation of highly pitting resistant passive films on a biomedical grade 316LVM stainless steel surface, Mater. Sci. Eng. C. 28, 94 (2008).
[9]
I. Frateur, L. Lartundo-Rojas, C. Méthivier, A. Galtayries, and P. Marcus, Influence of bovine serum albumin in sulphuric acid aqueous solution on the corrosion and the passivation of an iron-chromium alloy, Electrochim. Acta, 51, 1550 (2006).
dM
an
us cri
[1]
pte
[10] A. Kocijan, I. Milošev, and B. Pihlar, The influence of complexing agent and proteins on the corrosion of stainless steels and their metal components, J. Mater. Sci. Mater. Med., 14, 69 (2003). [11] S. Karimi, T. Nickchi, and A. Alfantazi, Effects of bovine serum albumin on the corrosion behaviour of AISI 316L, Co-28Cr-6Mo, and Ti-6Al-4V alloys in phosphate buffered saline solutions, Corros. Sci., 53, 3262 (2011).
ce
[12] I. Milošev, The effect of biomolecules on the behaviour of CoCrMo alloy in various simulated physiological solutions, Electrochim. Acta, 78, 259 (2012). [13] E. Bortel, B. Charbonnier, and R. Heuberger, Development of a Synthetic Synovial Fluid for Tribological Testing, Lubricants, 3, 664 (2015). [14] A. I. Muñoz and S. Mischler, Interactive Effects of Albumin and Phosphate Ions on the Corrosion of CoCrMo Implant Alloy, J. Electrochem. Soc. 154, 562 (2007).
Ac
1 2 3 4 5 6 7 8 9 10 11 12 13 14 15 16 17 18 19 20 21 22 23 24 25 26 27 28 29 30 31 32 33 34 35 36 37 38 39 40 41 42 43 44 45 46 47 48 49 50 51 52 53 54 55 56 57 58 59 60
AUTHOR SUBMITTED MANUSCRIPT - MRX-105287.R1
[15] I. Milošev, J. Hmeljak, and A. Cör, Hyaluronic acid stimulates the formation of calcium phosphate on CoCrMo alloy in simulated physiological solution, J. Mater. Sci. Mater. Med., 24, 555 (2013). 11
AUTHOR SUBMITTED MANUSCRIPT - MRX-105287.R1
pt
[16] I. O. Wallinder, S. Bertling, D. B. Kleja, and C. Leygraf, Corrosion-induced release and environmental interaction of chromium, nickel and iron from stainless steel, Water. Air. Soil Pollut., 170, 17 (2006).
us cri
[17] M. Talha, C. K. Behera, and O. P. Sinha, A review on nickel-free nitrogen containing austenitic stainless steels for biomedical applications, Mater. Sci. Eng. C, 33, 3563 (2013). [18] C. Valero Vidal and A. Igual Muñoz, Electrochemical characterisation of biomedical alloys for surgical implants in simulated body fluids, Corros. Sci., 50, 1954 (2008). [19] Y. Yan, A. Neville, and D. Dowson, Biotribocorrosion of CoCrMo orthopaedic implant materials-Assessing the formation and effect of the biofilm, Tribol. Int., 40, 1492 (2007). [20] B. Decker, W. F. Mcguckin, B. F. Mckenzie, And C. H. Slocumb, Concentration of hyaluronic acid in synovial fluid., Clin. Chem., 5, 465 (1959).
an
[21] Y.-C. Tang, S. Katsuma, S. Fujimoto, and S. Hiromoto, Electrochemical study of Type 304 and 316L stainless steels in simulated body fluids and cell cultures., Acta Biomater., 2, 709 (2006). [22] R. W. W. Hsu, C. C. Yang, C. A. Huang, and Y. S. Chen, Electrochemical corrosion studies on Co-Cr-Mo implant alloy in biological solutions, Mater. Chem. Phys., 93, 531 (2005).
dM
[23] C. Valero Vidal and A. Igual Muñoz, Study of the adsorption process of bovine serum albumin on passivated surfaces of CoCrMo biomedical alloy, Electrochim. Acta, 55, 8445 (2010). [24] F. Contu and B. Elsener H. Bhni, Characterization of implant materials in fetal bovine serum and sodium sulfate by electrochemical impedance spectroscopy. I. Mechanically polished samples, J. Biomed. Mater. Res., 62, 412 (2002). [25] C. Valero-Vidal, L. Casabn-Julin, I. Herraiz-Cardona, and A. Igual-Munoz, Influence of carbides and microstructure of CoCrMo alloys on their metallic dissolution resistance, Mater. Sci. Eng. C, 33, 4667 (2013).
pte
[26] N. N. Khobragade, M. I. Khan, and A. P. Patil, Corrosion Behaviour of Chrome-Manganese Austenitic Stainless Steels and AISI 304 Stainless Steel in Chloride Environment. Trans. Indian Inst. Met. 67, 263 (2014). [27] N. Sato, Toward a More Fundamental Under standing of Corrosion Processes, Corrosion, 511, 495 (1990).
ce
[28] M. A. M. Ibrahim, S. S. Abd El Rehim, and M. M. Hamza, Corrosion behavior of some austenitic stainless steels in chloride environments, Mater. Chem. Phys.,115, 80 (2009). [29] C. Hitz and A. Lasia, Experimental study and modeling of impedance of the her on porous Ni electrodes, J. Electroanal. Chem., 500, 213 (2001). [30] M. C. Biesinger, B. P. Payne, A. P. Grosvenor, L. W. M. Lau, A. R. Gerson, R. St, and C. Smart, Applied Surface Science Resolving surface chemical states in XPS analysis of first row transition metals , oxides and hydroxides : Cr , Mn , Fe , Co and Ni, Appl. Surf. Sci., 257, 2717 (2011).
Ac
1 2 3 4 5 6 7 8 9 10 11 12 13 14 15 16 17 18 19 20 21 22 23 24 25 26 27 28 29 30 31 32 33 34 35 36 37 38 39 40 41 42 43 44 45 46 47 48 49 50 51 52 53 54 55 56 57 58 59 60
Page 48 of 68
12
Page 49 of 68
pt
[31] W. Ji, R. Shen, R. Yang, G. Yu, X. Guo, L. Peng, and W. Ding, Partially nitrided molybdenum trioxide with promoted performance as an anode material for lithium-ion batteries, J. Mater. Chem. A, 2, 699 (2014).
ce
pte
dM
an
us cri
[32] A. P. Grosvenor, M. C. Biesinger, R. S. C. Smart, and N. S. McIntyre, New interpretations of XPS spectra of nickel metal and oxides, Surf. Sci., 600, 1771 (2006).
Ac
1 2 3 4 5 6 7 8 9 10 11 12 13 14 15 16 17 18 19 20 21 22 23 24 25 26 27 28 29 30 31 32 33 34 35 36 37 38 39 40 41 42 43 44 45 46 47 48 49 50 51 52 53 54 55 56 57 58 59 60
AUTHOR SUBMITTED MANUSCRIPT - MRX-105287.R1
13
AUTHOR SUBMITTED MANUSCRIPT - MRX-105287.R1
pt
List of Figures
ce
pte
dM
an
us cri
Figure 1: Structure of hyaluronic acid Figure 2: Equivalent circuit for fitting Nyquist plots Figure 3: Potentiodynamic polarization plots of 316L SS different HA concentrations at 37 °C Figure 4: Nyquist plots of 316L SS different HA concentrations at 37 °C Figure 5: Potentiodynamic polarization plots of 316L SS different NaCl concentrations at 37 °C Figure 6: Nyquist plots of 316L SS different NaCl concentrations at 37 °C Figure 7: Potentiodynamic polarization plots of 316L SS in 321mg/100ml HA with increasing concentration of NaCl at 37 °C Figure 8: Nyquist plots of 316L SS in 321mg/100ml HA with increasing concentration of NaCl at 37 °C Figure 9: XPS survey spectra of 316L in (a) 0.36% NaCl (b) 321 mg/100ml HA Figure 10: XPS spectra of (a) Cr (b) Mo (c) Ni (d) Fe and (e) O Figure 11: SEM micrograph of 316L after potentiodynamic polarization in (a) HA (b) HA + NaCl (c) NaCl
Ac
1 2 3 4 5 6 7 8 9 10 11 12 13 14 15 16 17 18 19 20 21 22 23 24 25 26 27 28 29 30 31 32 33 34 35 36 37 38 39 40 41 42 43 44 45 46 47 48 49 50 51 52 53 54 55 56 57 58 59 60
Page 50 of 68
14
us cri
ce
pte
dM
an
Figure 1: Structure of hyaluronic acid
Ac
1 2 3 4 5 6 7 8 9 10 11 12 13 14 15 16 17 18 19 20 21 22 23 24 25 26 27 28 29 30 31 32 33 34 35 36 37 38 39 40 41 42 43 44 45 46 47 48 49 50 51 52 53 54 55 56 57 58 59 60
AUTHOR SUBMITTED MANUSCRIPT - MRX-105287.R1
pt
Page 51 of 68
15
us cri
ce
pte
dM
an
Figure 2: Equivalent circuit for fitting Nyquist plots
Ac
1 2 3 4 5 6 7 8 9 10 11 12 13 14 15 16 17 18 19 20 21 22 23 24 25 26 27 28 29 30 31 32 33 34 35 36 37 38 39 40 41 42 43 44 45 46 47 48 49 50 51 52 53 54 55 56 57 58 59 60
Page 52 of 68
pt
AUTHOR SUBMITTED MANUSCRIPT - MRX-105287.R1
16
us cri an
ce
pte
dM
Figure 3: Potentiodynamic polarization plots of 316L SS different HA concentrations at 37 °C
Ac
1 2 3 4 5 6 7 8 9 10 11 12 13 14 15 16 17 18 19 20 21 22 23 24 25 26 27 28 29 30 31 32 33 34 35 36 37 38 39 40 41 42 43 44 45 46 47 48 49 50 51 52 53 54 55 56 57 58 59 60
AUTHOR SUBMITTED MANUSCRIPT - MRX-105287.R1
pt
Page 53 of 68
17
us cri an
ce
pte
dM
Figure 4: Nyquist plots of 316L SS different HA concentrations at 37 °C
Ac
1 2 3 4 5 6 7 8 9 10 11 12 13 14 15 16 17 18 19 20 21 22 23 24 25 26 27 28 29 30 31 32 33 34 35 36 37 38 39 40 41 42 43 44 45 46 47 48 49 50 51 52 53 54 55 56 57 58 59 60
Page 54 of 68
pt
AUTHOR SUBMITTED MANUSCRIPT - MRX-105287.R1
18
us cri an
ce
pte
dM
Figure 5: Potentiodynamic polarization plots of 316L SS different NaCl concentrations at 37 °C
Ac
1 2 3 4 5 6 7 8 9 10 11 12 13 14 15 16 17 18 19 20 21 22 23 24 25 26 27 28 29 30 31 32 33 34 35 36 37 38 39 40 41 42 43 44 45 46 47 48 49 50 51 52 53 54 55 56 57 58 59 60
AUTHOR SUBMITTED MANUSCRIPT - MRX-105287.R1
pt
Page 55 of 68
19
us cri an
ce
pte
dM
Figure 6: Nyquist plots of 316L SS different NaCl concentrations at 37 °C
Ac
1 2 3 4 5 6 7 8 9 10 11 12 13 14 15 16 17 18 19 20 21 22 23 24 25 26 27 28 29 30 31 32 33 34 35 36 37 38 39 40 41 42 43 44 45 46 47 48 49 50 51 52 53 54 55 56 57 58 59 60
Page 56 of 68
pt
AUTHOR SUBMITTED MANUSCRIPT - MRX-105287.R1
20
us cri an
ce
pte
dM
Figure 7: Potentiodynamic polarization plots of 316L SS in 321mg/100ml HA with increasing concentration of NaCl at 37 °C
Ac
1 2 3 4 5 6 7 8 9 10 11 12 13 14 15 16 17 18 19 20 21 22 23 24 25 26 27 28 29 30 31 32 33 34 35 36 37 38 39 40 41 42 43 44 45 46 47 48 49 50 51 52 53 54 55 56 57 58 59 60
AUTHOR SUBMITTED MANUSCRIPT - MRX-105287.R1
pt
Page 57 of 68
21
us cri an dM
ce
pte
Figure 8: Nyquist plots of 316L SS in 321mg/100ml HA with increasing concentration of NaCl at 37 °C
Ac
1 2 3 4 5 6 7 8 9 10 11 12 13 14 15 16 17 18 19 20 21 22 23 24 25 26 27 28 29 30 31 32 33 34 35 36 37 38 39 40 41 42 43 44 45 46 47 48 49 50 51 52 53 54 55 56 57 58 59 60
Page 58 of 68
pt
AUTHOR SUBMITTED MANUSCRIPT - MRX-105287.R1
22
us cri an
ce
pte
dM
Figure 9: XPS survey spectra of 316L in (a) 0.36% NaCl (b) 321 mg/100ml HA
Ac
1 2 3 4 5 6 7 8 9 10 11 12 13 14 15 16 17 18 19 20 21 22 23 24 25 26 27 28 29 30 31 32 33 34 35 36 37 38 39 40 41 42 43 44 45 46 47 48 49 50 51 52 53 54 55 56 57 58 59 60
AUTHOR SUBMITTED MANUSCRIPT - MRX-105287.R1
pt
Page 59 of 68
23
us cri an dM pte ce
Ac
1 2 3 4 5 6 7 8 9 10 11 12 13 14 15 16 17 18 19 20 21 22 23 24 25 26 27 28 29 30 31 32 33 34 35 36 37 38 39 40 41 42 43 44 45 46 47 48 49 50 51 52 53 54 55 56 57 58 59 60
Page 60 of 68
pt
AUTHOR SUBMITTED MANUSCRIPT - MRX-105287.R1
Figure 10: XPS spectra of (a) Cr (b) Mo (c) Ni (d) Fe and (e) O 24
us cri
ce
pte
dM
an
Figure 11: SEM micrograph of 316L after potentiodynamic polarization in (a) HA (b) HA + NaCl (c) NaCl
Ac
1 2 3 4 5 6 7 8 9 10 11 12 13 14 15 16 17 18 19 20 21 22 23 24 25 26 27 28 29 30 31 32 33 34 35 36 37 38 39 40 41 42 43 44 45 46 47 48 49 50 51 52 53 54 55 56 57 58 59 60
AUTHOR SUBMITTED MANUSCRIPT - MRX-105287.R1
pt
Page 61 of 68
25
AUTHOR SUBMITTED MANUSCRIPT - MRX-105287.R1
pt
List of tables Table 1: Potentiodynamic polarization data of various concentrations of HA at 37 °C Table 2. Nyquist data of various concentrations of HA at 37 °C
us cri
Table 3: Potentiodynamic polarization data of various concentrations of NaCl at 37 °C Table 4: Nyquist data of various concentrations of NaCl at 37 °C
Table 5: Potentiodynamic polarization of 316L SS in 321mg/100ml HA with various concentrations of NaCl at 37 °C
ce
pte
dM
an
Table 6: Nyquist data of 316L SS in 321mg/100ml HA with various concentrations of NaCl at 37 °C
Ac
1 2 3 4 5 6 7 8 9 10 11 12 13 14 15 16 17 18 19 20 21 22 23 24 25 26 27 28 29 30 31 32 33 34 35 36 37 38 39 40 41 42 43 44 45 46 47 48 49 50 51 52 53 54 55 56 57 58 59 60
Page 62 of 68
26
Page 63 of 68
Ecorr
icorr
βa
(mV)
(µA/cm2)
(mV)
250
-206.1
0.076
321
-183.1
0.108
365
-168.9
0.126
(mV)
336.6
149.1
371.1
145.1
432.3
188.5
an dM pte ce 27
βc
us cri
Concentration of HA (mg/100mL)
pt
Table 1: Potentiodynamic polarization data of various concentrations of HA at 37 °C
Ac
1 2 3 4 5 6 7 8 9 10 11 12 13 14 15 16 17 18 19 20 21 22 23 24 25 26 27 28 29 30 31 32 33 34 35 36 37 38 39 40 41 42 43 44 45 46 47 48 49 50 51 52 53 54 55 56 57 58 59 60
AUTHOR SUBMITTED MANUSCRIPT - MRX-105287.R1
Table 2. Nyquist data of various concentrations of HA at 37 °C CPE2 (F.s(a-1))
n2
R2 (Ω.cm2)
CPE3 (F.s(a-1))
22.1×10⁻⁶
0.74
2.30 ×10⁶
3.15×10⁻⁹
0.56
173.9
n3
R3 (Ω.cm2)
us cri
Concentration Rs of HA (Ω.cm2) (mg/100mL) 250 197.8 334.3
26.4×10⁻⁶
0.70
1.66 ×10⁶
3.85×10⁻⁹
0.46
302.9
365
169.9
29.3×10⁻⁶
0.72
6.5 ×10⁵
9.06×10⁻⁶
0.85
21.9
ce
pte
dM
an
321
Ac
1 2 3 4 5 6 7 8 9 10 11 12 13 14 15 16 17 18 19 20 21 22 23 24 25 26 27 28 29 30 31 32 33 34 35 36 37 38 39 40 41 42 43 44 45 46 47 48 49 50 51 52 53 54 55 56 57 58 59 60
Page 64 of 68
pt
AUTHOR SUBMITTED MANUSCRIPT - MRX-105287.R1
28
Table 3: Potentiodynamic polarization data of various concentrations of NaCl at 37 °C Concentration of NaCl
Ecorr
icorr
βa
βc
(mV)
(µA/cm2)
(mV)
(mV)
0.036 wt.%
-111.2
0.135
497.2
156.9
686.2
0.36 wt.%
-155.0
0.170
307.5
118.7
379.6
3.6 wt.%
-230.9
0.239
396.1
119.5
178.0
29
Epit
us cri
an dM pte ce
Ac
1 2 3 4 5 6 7 8 9 10 11 12 13 14 15 16 17 18 19 20 21 22 23 24 25 26 27 28 29 30 31 32 33 34 35 36 37 38 39 40 41 42 43 44 45 46 47 48 49 50 51 52 53 54 55 56 57 58 59 60
AUTHOR SUBMITTED MANUSCRIPT - MRX-105287.R1
pt
Page 65 of 68
Table 4: Nyquist data of various concentrations of NaCl at 37 °C CPE2 (F.s(a-1))
n2
R2 (Ω.cm2)
CPE3 (F.s(a-1))
n3
R3 (Ω.cm2)
us cri
Concentration Rs of NaCl (Ω.cm2) 2.5
34.2×10⁻⁶
0.80
1.11 ×10⁶
12.7×10⁻⁶
0.54
106.2
0.36 wt.%
17.6
35.5×10⁻⁶
0.85
3.70×10⁵
0.26×10⁻⁶
0.74
839.6
3.6 wt.%
25.3
57.7×10⁻⁶
0.83
1.41 ×10⁵
0.14×10⁻⁶
0.59
1015.3
ce
pte
dM
an
0.036 wt.%
Ac
1 2 3 4 5 6 7 8 9 10 11 12 13 14 15 16 17 18 19 20 21 22 23 24 25 26 27 28 29 30 31 32 33 34 35 36 37 38 39 40 41 42 43 44 45 46 47 48 49 50 51 52 53 54 55 56 57 58 59 60
Page 66 of 68
pt
AUTHOR SUBMITTED MANUSCRIPT - MRX-105287.R1
30
Page 67 of 68
pt
Table 5: Potentiodynamic polarization of 316L SS in 321mg/100ml HA with various concentrations of NaCl at 37 °C Concentration of NaCl
Ecorr
icorr
βa
βc
(mV)
(µA/cm2)
(mV)
(mV)
0.036 wt.%
-173.6
0.047
368.2
158.7
980.7
0.36 wt.%
-197.3
0.070
427.1
175.8
379.1
3.6 wt.%
-236.2
0.110
396.1
157.9
270.2
31
Epit
us cri
an dM pte ce
Ac
1 2 3 4 5 6 7 8 9 10 11 12 13 14 15 16 17 18 19 20 21 22 23 24 25 26 27 28 29 30 31 32 33 34 35 36 37 38 39 40 41 42 43 44 45 46 47 48 49 50 51 52 53 54 55 56 57 58 59 60
AUTHOR SUBMITTED MANUSCRIPT - MRX-105287.R1
AUTHOR SUBMITTED MANUSCRIPT - MRX-105287.R1
CPE2
R2
CPE3
of NaCl
(Ω.cm2)
(F.s(a-1))
(Ω.cm2)
(F.s(a-1))
0.036 wt.%
2.2
32.2×10⁻⁶
0.77
3.51 ×10⁶
11.7×10⁻⁶
0.92
104.3
0.36 wt.%
14.4
34.5×10⁻⁶
0.84
2.74×10⁶
0.29×10⁻⁶
0.47
217.6
3.6 wt.%
87.7
51.7×10⁻⁶
0.82
5.02 ×10⁵
0.96×10⁻⁶
0.55
141.0
n2
n3
R3
(Ω.cm2)
us cri
Rs
ce
pte
dM
an
Concentration
pt
Table 6: Nyquist data of 316L SS in 321mg/100ml HA with various concentrations of NaCl at 37 °C
Ac
1 2 3 4 5 6 7 8 9 10 11 12 13 14 15 16 17 18 19 20 21 22 23 24 25 26 27 28 29 30 31 32 33 34 35 36 37 38 39 40 41 42 43 44 45 46 47 48 49 50 51 52 53 54 55 56 57 58 59 60
Page 68 of 68
32