was filtered through a series of Nitex screen filters, the smallest of which had ... approximated by the following spheroid equation (Laurence. 1973): ..... We wish to thank Lucie Olivier de Lafontaine, Kathy Tallon,. Carolyn .... stage V. J. Mar. Biol.
Effect of Container Size on Estimates o Rates in Experiments with Macrozoo Can. J. Fish. Aquat. Sci. Downloaded from www.nrcresearchpress.com by Canadian Science Publishing on 09/30/15 For personal use only.
Yves de ~ a f o n t a i n eand ~ William C. Leggett Department of Biology, M c G i l l University, 1285 Dr. Penfield Avenue, Montreal, Que. H3A 1 B %
de Lafontaiwe, Y., and W. C. Leggett. 1987. Effect of container size sn estimates of mortality and predation rates in experiments with macrsmsoplanktsn and larval fish. Can. J. Fish. Aquat. Sci. 44: 1534-1 543. We investigated the effect of container sine on the predation rate of the jellyfish AureBia aurita on postemergent capelin (MaBlsters villssus) farvae in large in situ cylindrical enclosures. Total depth of the enclosures varied between 1 and 9 m and yielded volumes that ranged from 0.26 to 6.35 rn" Instantaneous mortality rates of capelin larvae dare to jellyfish predation varied inversely and nonlinearly with the volume of the enclosure. Over the range of container sines used, mortality rates differed by one order of magnitude. Container volume explained 88% of the variance in mortality rates, while predator sine and larval size accounted for 8.3 and 2.3% of the variability, respectively. Mortality rate was independent of the initial larval density within each container size. Differences i n mortality rates among container sines are explained by the observed differences i n the vertical patchiness of larvae among various enclosure sizes. These findings indicate that experiments conducted i n small containers typical of those used i n laboratory studies seriously overestimate rates of larval mortality due to predation. Direct extrapolation of the results of such laboratory studies t o field conditions is therefore not warranted. We conclude that the vertical distributions of predator and prey may be the most important factor controlling predator-prey relationships i n situ. L'effet de la taille dar contenant sur le taux de prkdation par la m4duseAureBia aurita sur les larves de capelan (MaElsters villssus) nouvellement ecloses a ete evalue B I'aide de larges enclos cylindriques places in situ. La profondeur des enclos a varie entre 1 et 9 rn pour downer des volumes variant de 0'26 6,35 m3. Les taux instantant% de mortalite des larves de capelan resultant de la predation par les meduses a varie de facon inverse et non-lin4aire avec le volume de l'enclos. bes taux de mortalit6 ont varie d'un ordre de grandeur A I'interieur de la gamme de tailles des contenants utilis6s. Le volume d u contenant a explique 88 % de la variance des taux de rnsrtalite, alsrs que la taille des predateurs et la taille des larves ont contribue respectivement pour 8,3 et 2,3 % de la variabilite. Le taux de mortalit4 etait independant de la densit6 lawlaire initiale ii I'interieur de chaque contenant. Les variations des taux de mortalit6 entre les contenants de diffkrentes tailles s'ewpliquent par les differents niveasrx d'heterogenkite verticale des larves observes dans Bes enclss de differents tailles. Ces resultats demontrent que des experiences realisees dans de petits contenants sernblables ceux typiquement utilises lors d'ktudes en laboratoire surestirnewt grandement les taux de mortalit6 lawaire due a la predation. L'extrapolation directe des r6sultats de telles ktudes de laboratoire auw conditions en nature n'est donc pas recommandke. Nous csncluons que la distribution verticale des predateurs et des proies peut &re le facteur les plus important contrblant les relations pr4dateur-proie in sitep. Received September 5, 1986 Accepted May 4, 1987
(J8929)
lthsugh predation is a major source sf natural mortality for larval fishes, its contribution to total l m a l mortality , and subsequent recruitment, remains unclear (Hunter 1984). The difficulty of assessing in situ the natural mortality of fish larvae and estimating the proportion of this mortality attributable to predation has led many scientists to study predation in the laboratory. This laboratory work has sought to understand the functional relationship between preda'~sntributionto the program of GIWOQ (Groupe Intemniversitaire de Reckerehes OcCanographiques du Qukbec). 2~resentaddress: Pkehes et OcCans Canada, Division de la Recherche sur les Pt?ches, Inskiteat Maurice Lamontagne, 850 Route de la Mer, Mont-Soli (QuC.) G5H 32%.
tors and prey with the object of linking this relationship to their numerical in situ abundance. The ultimate objective has been to describe and explain the dynamics of the predator-prey system. Large pelagic invertebrates are important potential predators of I m a l fish (Hunter 1984; M8ller 1984; Purcell 1985). The predation rate as a function of prey density, i.e. the predator's functional response (Holling 1966), has been experimentally determined for several pelagic invertebrates fed larval fish (Table 1). These studies show that macroinvertebrate predators can inflict high mortality rates on the early larval stages of fish under experimental situations. Except for the work sf Frank and Leggett (198%) who used 3-rn3 in situ enclosures, most experimenters have worked with relatively small laboratory containers ( (~-d-')
TABLE4. Stepwise multiple regression models for instantaneous mortality rate and standdized mortality rate (Z,) ( P I = 36).
6 Fa> (~.cm-~-d-l)
(a
% variance
Step
1 2 3
1 2
Variate
Coefficient (SE)
F
P
Mortality rate ( Z ) -0.6898 (0.0432) 131.04 0.0Wl In volume 2.0102 (0.3850) 22.53 0.0001 In diameter 7.52 0.8100 Lm~allengtk 0.5442(0.1992) Intercept -7.2341 Standardized mortacali@ rare (Z,) -0.6918 (0.0417) 252.23 0.0001 In volume 0.5822(4).1978) 8.66 0.0060 Lmallengah Intercept -7.1701
(a
differences in mean instantaneous mortality rate among experiments (F = 24.98, df = 2,224, g = 8.01) and among container volumes (F = 50.2 1, df = 5,24, g < 0.00 1) but no significant interaction between the two (F = 2.74, df = 4,24, p > 0.05). An a posteriori Duncan test showed mortality rates in the three experiments to be different (I > I%> %%I). The among-experiment differences in mortality rates may have resulted from differences in other variables (predator size, temperature, salinity, radiation, average larval size) which were not controlled. A stepwise multiple regression incoprating those variables, plus initial larval density and container volume, indicated that container volume contributed 79.9% to the variability in Z , while predator diameter (log transformed) and larval length contributed 8 . 3 and 2.3% to the total variance, respectively (Table 4). No other variable was found to be significant. The coefficient for the log diameter of predator in this regression was 2.0. This suggested that larval mortality rate was directly related to the umbrella cross-sectional area of AureLiia aurita rather than its wet weight which varies as the cube of umbrella diameter (M6ller 1980). All mortality rates were thus standardized by the predator cross-sectional area. The relationship between the standardized rates (Z, = Zlumbrella area in square centimetres) and container volume is presented in Fig. 2.
R~
explained
0.799 0.882 0.905
79.8 8.3 2.3
0.884 0.909
88.4 2.5
When subjected to a stepwise multiple regression, only container volume (88.4%) and larval length (2.5%) contributed significantly to the variance in Z, (Table 4). The positive coefficient for l m a l length in the regression analyses for both Z and Z, indicated that larger larvae suffered higher mortality in these experiments. Because of the potential covariation between variables, the effect of any particular variable might be confounded with that of another. A simple con-elation matrix (Table 5) indicated that temperature was highly correlated with both Z and container volume. These strong correlations may have precluded the selection of temperature in the stepwise precedure and could have biased (overweighted) the influence of volume on mortality rates. The relationship between mortality rate and container volume was statistically evaluated by partial correlation holding the effect of predator size and temperature constant. The correlation coefficient declined slightly from -0.895 to -0.859. Container volume still was judged to be the major factor influencing larval mortality rate. Edge Effect As previously indicated, the changes in enclosure volumes were achieved by varying container depth only. The containers Can. J . Fish. Aquat. Sci., Vol. 44, 1987
Can. J. Fish. Aquat. Sci. Downloaded from www.nrcresearchpress.com by Canadian Science Publishing on 09/30/15 For personal use only.
CONTAINER
VOLUME ( m 3 ) m
0 27
c-
089
e
3 21
'J
INITIAL DENSITY ( i a r v a e
6.35
m3)
e
FIG. 2. Relationship between larval mortality rate standardized for predator size QZ,) and volume s f experimental container. Mean and standard deviation are presented for each enclosure volume. TABLE5. Matrix of simple correlation coefficients for measured variables: Z = log mortality rate, Vol. = log volume of container, Diam. = Isg diameter of predator, Length = larval length, Temp. = water temperature, Light = radiation.
Z Vol . Diam. Length Temp.
Vol.
Dim.
Length
-0.895'
0.068 0.237
0.34%" -0.245 -0.055
Temp.
Light
0.752" -0.686" 0.126 84.467
-0.310 0.197 -0.152 -0.790' -0.399"
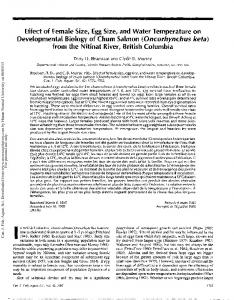
FIG.3. Predation rate (number of larvae taken per predator per day) as a function of initial larval densities in four container volumes. Predation rates have been standardized for a 5-cm-diameter predator, the average predator size used in this study. Regression lines calculated for each container volume are shown.
aurita on larval capelin was linearly related to the initid density of larvae offered within a given container volume (Fig. 3). At similar prey density, predation rate did, however, vary among container sizes.
Discussion Container Size and Mortality Rates Our results clearly demonstrate that the mortality rates of' yolk-sac larval capelin imposed by jellyfish predators varied inversely and nonlinearly with container volume. Mortality decreased logarithmically from 71%0dsa ( 2 = 1.236) to 7 -996.6- (2 = 0.0828), a decline of approximately one order of magnitude over the range of container volumes tested (Table 3: Fig. I ) . This inverse relationship indicates that experiments involving small containers typical of those used in laboratorybased predation studies (Table 1) may seriously overestimate in situ larval mortality rates due to predation. The extrapolation sf the results of such laboratory studies to field situations should therefore be avoided. Absolute mortality rates were higher and more variable in small enclosurgs than in large ones, but the coefficients of variation (100 s W X ) for Z varied between 26 and 49% (average 36%)irrespective of the container size. The mean coefficient of variation for Za was 26%. Bailey (1984) and Bailey and Batty (1983,1984) investigated the predation rate of Auaelia uuabta on larval fish in experiments using 5-L laboratory containers. In these experiments, predation rates were found to be dependent on several factors (larval density, larval size and species, predator size). The experiments also differed markedly in duration (1 and 24 h). Calculated daily mortality therefore varied between 8 and 100%. At a nonsaturation concentration of 5-mm larvae, predation rates, adjusted for cross-sectional area of Auaelia, ranged between 8 and 16 larvaeed-I (table 3 and fig. 2 in Bailey 1984). This corresponds to a daily mortality rate of 53-10896. By extrapolation of the relationship between mortality rate and container volume derived from our experiments (Table 4) to a 5-L container, we estimated a standardized instantaneous mortality rate (2,) of 0.5521, or 439b.d-' . Although this comparison is speculative, due to the differences in predator size and larval species used,
'
therefore differed in their wall surface mdvolume ratios (Table 3). Consequently, the mortality rates observed were also significantly related to the container depth and to the wall aredvolunae ratio (Table 6). The calculated slope of the log-log regression between mean standardized mortality rates (2,) and the total depth sf containers did not differ significantly from - I. This suggests that mortality rates are inversely proportional to water depth. Although the wall aredvolume ratios varied little (4.1 and 4.2) between the two largest enclosures (3.21 and 6.35 m3), mean standardized mortality rates differed significantly (Table 3). However, standardized mortality rates were not significantly different in the containers having approximately q u a l volumes (0.26 and 0.27 m3) but very different aredvolume ratios (6.0 and 7.6) (Table 3). This suggests that the "edge-effect" was Bess important than enclosure volume and/or water depth in determining the predation rate of jellyfish predators in these confined conditions. Effect of Initial Larval Density The effect of initial larval density on mortality rate standardized for predator size (2,) was evaluated for each container size (where n ) 3) using regression analysis. No significant relation @ = 0.17-0.74) existed. This lack of relationship between mortality rate md initial prey density indicated that the predation rate (number of prey taken per predator per day) of Auaelia Can. J . Fish. Aquat. Sci., Vol. 44, 1987
TABLE6. Regression analysis of mean larval mortality ( n = 6) rates (both Z and Z,) as a function of container sizes (volume, depth, and area/volume ratio). Intercept ( s ~ )
Can. J. Fish. Aquat. Sci. Downloaded from www.nrcresearchpress.com by Canadian Science Publishing on 09/30/15 For personal use only.
In Z ,
-4.304 (0.085) -3.684 (0.2%) - 18. 177 (1.%I)
Slope (SE)
-0.761 (0.071) -0.915 (0.168) 3.595 (0.900)
TABLE7. Results of simulation models of instantaneous larval mortality in relation to predator movement and prey distribution in 1-, 5-, and 9-rn-deep enclosures (see text for details). Mortality rates, mean Model 1
lm
5m
9m
115
119
519
0.955
Surface Mid-depth Bottom I%
HI1 IV V
Observed
F
P
0.97 0.88 0.80
113.2 29.7 15.9
0.0004 0.0055 0.016
needed to fully evaluate the validity of this relationship for Aurelia aurita. Effect of Larval Size and L m a l Density
Ratios
(SD)
In volume In depth In area/volurne
r2
0.974
our predicted value is only slightly lower than the minimum observed by Bailey. This supports our finding that mortality rates developed from experiments using small experimental containers are seriously biased. The inverse log-log relationship between mortality rate and container volume (Fig. 1 and 2) suggests that enclosures having a volume of 3 m3 or greater should yield predation rates that may compare favorably with those occurring in situ. A limited number sf studies have been conducted in much larger experimentalcontainers. While they did not specifically address the problem of larval mortality induced by jellyfish predators, reported instantaneous mortality rates in these enclosures (300 m3) and basins (4000 m3), where jellyfish were abundant, ranged from 0.015 to 0.12 (Gamble and Houde 1984; Oiestad 1985). Although different fish species and jellyfish species were used in these experiments, the reported mortality rate values bracket those we observed (8.078) in our largest enclosures (Table 3). The significant increase in mortality rate with predator size evident in our results is consistent with previous reports of a linear relationship between predation rates and the Aurelia aurita cross-sectional area of