Research Journal of Agriculture and Environmental Management Vol. 5(4), pp. 114-121, May, 2016 Available online at http://www.apexjournal.org ISSN 2315-8719© 2016 Apex Journal International
Full Length Research
Effect of different tillage practices on cassava production in Osun state of Nigeria Wasiu Agunbiade LAMIDI College of Agriculture, Ejigbo Campus, Osun State University, Osogbo, Nigeria. E-mail Address:
[email protected];
[email protected] Tel: +2348072893256, +2348062085175 Accepted 20 April, 2016; Published 30 May, 2016 Different tillage practices on cassava (Manihot esculentum) plants, roots’ yield and quality in Aba Odan farm via Ileogbo in Ayedire Local Government Area of Osun State of Nigeria were studied. The objective was to find out the type of tillage system that will give highest yield and quality of some of its extracts. Acreages of land were planted with bitter variety 98/0581 fresh cassava stems. Three treatments: zero tillage (0), minimum tillage (1) and maximum tillage (2) were used; each treatment replicated thrice; 0A, 0B, 0C; 1A, 1B, 1C and 2A, 2B, 2C respectively. The heights of cassava plants and leaves’ areas in the first three months were measured at ten day intervals. Leaf Area Index (LAI), throughout the first nine months, weights of harvested roots per acre and quality (using proximate analysis) in term of its paste were also determined. One-way ANOVA statistics was used for data analysis to test for significance and means’ separations. Significant effects (p < 0.05) of minimum and maximum tillage were observed respectively on yield (p = 0.027, 0.014) and quality of cassava tubers through proximate analysis (p = 0.041, 0.008). There were stronger correlations depicting stronger relationships (R2 = 0.999, 0.997, 0.999) between tillage methods and LAI, vis-a-vis between tillage methods and growth rate with stronger correlation, R2 = 0.991, 0.995 and 0.998 respectively for zero, minimum and maximum tillage practices. Maximum tillage system had highest area for longest leaves at 70, 80 and 90 days and zero tillage had less. The maximum tillage has higher LAI than any other treatments. The highest yield of cassava roots was 4,532 kg/acre in the maximum tillage and zero tillage gave lowest of 4,000 kg/acre representing 5.2% increment of maximum over minimum tillage. For farmers, although, cost of operations that will be incurred in maximum tillage may be higher than others, resulted increase yield will make its turn over better than others, thus farmers are encouraged to till soil to maximum level. Key words: Maximum tillage, Minimum tillage, Osun State INTRODUCTION Cassava (Manihot esculentum) is a tropical tuber broadly categorized into bitter cassava (Manihot utilisssima) and sweet cassava (Manihot palmate). It is between 2 m and 3m tall when fully matured, some species may reach 4 m height and their maturity period ranges between 9 months and 2 years (International Institute of Tropical Agriculture, IITA, 1990). Tillage encompasses different soil cultivation systems using mechanical/manual equipment before planting (Magani and Shave, 2011). It is a disruptive and energyintensive task that should be limited to modifying the soil to alleviate productivity constraints in the rooting zone (Walters, 2005). The tillage depth of soil depends on factors like the soil development stages, equipment’
properties like orientations and tilting angle of discs (National Resources Conservation Service, NRCS, 2002). Most commercial farmers (91%) in south-western Nigeria (a tropical humid region) use primary tillage (Magani and Shave, 2011), some peasant farmers use zero tillage while few commercial farmers (9%) use secondary tillage systems (Akande, 2009; Osun State Information Services, 2005). Good tillage practices are good steps toward proper soil management. Proper soil management is a key to sustainable agricultural production (Simmons and Nafziger, 2010). Good soil preparation does the followings: reduces weed growth; incorporates fertilizer, manure and organic matter into the soil; speeds crops growth via number of tillage operations
Lamidi
115
and tillage depth (USDA ERS, 2012) Its yield was estimated to be on average yield of 24 tonnes/ha at the rate of 10,000 – 12,000 stands per ha, (Osun State Diary, 2010). The relationship between the total dry weight and total root weight in cassava is linear (IITA, 1990), this suggests that the tuber bulking rate keeps pace with the rate of crop growth. The cassava variety used in this research was 98/0581 with the expected yield of more than 25 tonnes/ha (IITA, 1990). Farmers’ awareness in Osun State to the usage of secondary implement like harrow on the farm is low (Lamidi, 2005). This may be due to low literacy level, unavailability of harrow and other mountable secondary implements and their costs or fuel consumption. In a research on the use of secondary tillage equipment by farmers, 91% of the farmers interviewed have never used harrow on their farm lands, others who have confessed that it was used only once or twice before (NRCS, 2002; Lamidi, 2005). This may also be because of cost, illiteracy level, wrong perception of the implement about its no difference from primary tillage implement when used and unawareness of the benefits of maximum tillage (secondary tillage) by farmers. In Osun State of Nigeria, it is common that most farmers only use plough and it may be two to three times on a plot for the same planting instead of combining plough and harrow as maximum tillage tools. This could be a reason for this study for the end users to be aware of the benefits of both minimum (primary tillage) and maximum tillage operations when combined for the same planting. Therefore, the following questions could be raised concerning the farmers, their environment, their dispositions toward these different practices and farmers’ awareness of these practices and yields of their produce. Are there any differences between minimum and maximum tillage systems on the farm? Do we have anything to show to the farmers the extent of soil differences as a result of tillage system as stimulant to imbibe such operations in their farming systems? How can farmers be encouraged to cultivate habits of using maximum tillage equipment? Is there anything to convince farmers that tilling soil to maximum level will increase their yield in the farm? Are there evidence of increased production when maximum tillage equipment is used? Will depth of cultivation of land as a result of using maximum equipment bring more yield to farmers? These and other questions will be answered in this research. Hence, it was necessary to investigate effects of various types of soil tillage methods on cassava plants and to determine the type of tillage practices that give highest yield of cassava roots and good quality of its some extracts.
classes as developed by the United States Soil Conservation Service (Allan, 1996); for good soil for cassava production. An expanse of land of about 10 ha was used, a well-drained sandy-loam soil in Aba-Odan village in Ayedire Local Government Area of Osun State (Osun State Diary, 2010). The land had not been tilled for more than five years before clearing, this was to make sure that soil fertility is intact. Osun State- south west Nigeria occupies approximately 14,875 sq. km, between longitude 04.545º’E; latitude 07.785oN. Though, with clay deposit, hilly lands and rocks in some Local Government Areas (LGAs), 85% of this mass is cultivable and about 80% (11,900 sq. km) of this support cassava production (Osun State Diary, 2010; Lamidi, 2005; Allan, 1996). There are same soil-profiles throughout the state, portraying same geographic location and soils formed from the same parent materials (Allan, 1996). Thereby, it is appropriate to say that the experiment in a part of the state may be a representation of the whole Osun State.
MATERIALS AND METHODS
Collection of data from field
Site selection
Shoot’s heights, widths, growth rate and cassava yield
Selection of the site was done using land use capability
The heights of the cassava shoots for the first three
Experimental design Three treatments as methods of tillage systems namely zero tillage-0; primary or minimum tillage-1 and secondary or maximum tillage-2 were employed with replicates. Half an acre of land each was cultivated for each of the three replicates for a treatment making the total acreage per method to be 1½. Each treatment was divided into three plots with designations 0A, 0B and 0C for zero tillage, 1A, 1B and 1C for the minimum tillage and 2A, 2B and 2C for the maximum tillage. Each of the plots was planted with 98/0581 bitter cassava species. For zero tillage cassava stems were planted without opening the soil at all. Spacing was 120 cm by 90 cm, making a total of 3705 cassava plants per acre. 100 kg of NPK fertilizer was applied to the crop 5 weeks, for good growth and yield. For minimum tillage plots, ploughing was done to open the soil, no harrowing was done, the cassava stems were planted, the same was applicable to maximum tillage operation and plots 2A, 2B and 2C where ploughing, harrowing and ridging were done subsequently one after the other. Wherever the soil was worked upon, it was done in such a way that the soil was allowed to flow laterally around the implement during the operations for good soil softening, this allows cassava roots to respire well. Both the minimum and the maximum operations were done to the required standards respectively to be assured that plants had necessary conditions under the required tillage methods. The soil moisture content level at the time of tillage was 78% (Lamidi, 2009).
116
Res. J. Agric. Environ. Manage
months at 10 days intervals were measured. Similarly, length and widths (longest widths of the leaves) were also recorded every ten days, the averages were recorded. The random sampling of the heights of shoot and leaf’s areas were taken in replicates (n=160) and in whole plot (n=480) representing 10% of the number of cassava plants. The choice of cassava leaves in this case was on the longest and widest laminas and their means. The average growth rates (increase in heights of cassava shoot per unit period of time (number of days) were calculated using initial and final heights during the days of measurement, Equation 1. The total cassava roots (per ½acre) in each plot and their replicates were uprooted and weighed to record their yield/ha, this was done at the end of the nine months. Growth rate is the difference in growth over a specific period of time divided by the time interval in between, that is,
contents, moisture content and ether extract of the paste were determined by method explained by Saura-Calixto et al.,(1983) method. Each analytical method for each treatments (ntreatments=3) and each replicate (nreplicates=3) were done three (ntrial times=3) times (n=27). Data analysis All collected data were analysed using (SAS, 2008) with one-way analysis of variance- ANOVA . Regression analysis was used for LAI and average growth rate of cassava plants under different tillage methods. Where significant differences existed, treatment means were separated using Duncan Multiple Range Tests. RESULTS
(Final height – initial height) / number of days in between……… Equation 1 Leaf area measurements Leaf Area Index (LAI)- defined as the leaf area per unit ground area was calculated from measured data. The leaf area was determined through repeated area measurements on ‘single leaves’ and area (accumulation), these methods are hence considered the most accurate (Chen et al., 1997), and for that reason they are often implemented as calibration tools for indirect measurement techniques (Cutini et al., 1998). In this experiment, the model tree method- a direct method of measuring LAI was used. It consists of measuring the vertical distribution of leaf areas leaf by leaf from the destructive sampling of a small amount of representative cassava plants out of the stands. With even-aged plants like cassava plants of this research with normal leaves’ distribution, 3 or 5 plants’ sampling was sufficient (Breda, 2003; Schauvliege, 1995). Proximate composition of cassava paste Some cassava roots were randomly selected fresh, processed into cassava using burr mill, to evaluate quality of the roots per treatment using proximate analysis via percent crude fibre and ash content (dry matter contents), carbohydrate, crude protein and moisture content. The reason for using paste rather than cassava flour was to minimize the interference of possible external factors like fermentation, dewatering, sun drying/oven drying, milling/pulverizing/particulation and others, during their preparations. Such could have totally changed their compositions or interfere with them. Crude protein of the paste was determined by microkjeldahl method (AOAC, 2005). Crude fibre and ash
Heights and mean heights values of cassava plants Significant effects (p < 0.05) of primary and secondary tillage were observed (p = 0.027 and 0.014) on the yield/production of cassava, while no significant effect (p > 0.05) of zero tillage was observed (p = 0.137) on the yield/production of cassava at the harvest. The results of the average heights and the resulted mean values were respectively given in Table 1 at 10, 20, 30, 40, 50, 60, 70, 80 and 90 days when the heights’ growths were stabilised. Table 1 shows statistical differences among the heights’ mean values. Heights of shoot for secondary tillage were higher throughout the period. The mean values show significance between 10 and 50 days and at 80 days especially at secondary tillage. Similarly, areas of the leaves for the longest length/widths (longest length of the leaves and longest width of the leaves per plot) were also recorded at the periodic time of ten days Table 1. At early stage on growth, the internodes were smaller, whereas, internodes were longer at higher growth period in their heights of average 13.0 cm in zero tillage 0 at 10 days to 20 days compare to 14.6 cm or 14.4 cm at between 40 and 50 days, these account for higher heights, the same goes for 1A, 1B, 1C, 2A, 2B and 2C. The results of the heights of the shoot at 10 days interval showed the increasing values for maximum tillage than other two methods of tillage, also, there were increase lengths and widths of the laminas for the maximum tillage than their respective zero and minimum tillage. There were statistical differences among the mean values along the same row for each classification Table 1. Leaf Area Index (LAI) The graph for the average LAI for each tillage type are shown in Figure 1, maximum height was assumed
Lamidi
117
Table 1. Mean values of heights of Cassava Shoots in the first three months( n= 480/treatment).
Days
Heights of cassava shoots in plots (cm) Zero tillage
10
5.28 ± 50.02
(0) c
20
18.24 ± 40.080
30
27.40 ± 20.01
c
ab
37.84 ± 20.24
50
54.40 ± 30.3c
Maximum (2)
b
6.12 ± 40.32a
b
21.20 ± 50.22
5.87 ± 20.00 c
40
Minimum (1) 19.03 ± 40.6
b
30.02 ± 42.2
a
b
40.63 ± 31.4
a
29.82 ± 51.14 37.90 ± 39.17
71.10 ± 40.20b
b
60
90.00 ± 31.10
70
111.20 ± 22.32
c c
a
89.28 ± 40.21
71.22 ± 36.8a
c
90.52 ± 38.27a
112.00 ± 50.22
b
112.4 ± 40.22
b
131.90 ± 50.00
80
129.40 ± 21.03
130.15 ± 38.13
90
150.10 ± 18.55c
149.00 ± 41.22b
a a
150.02 ± 48.22a
Mean values with the same superscript(s) along same row are not statistically different
at (p ≤ 0.05)
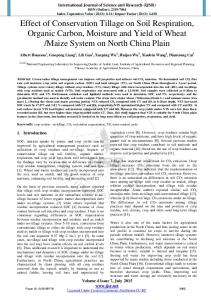
Figure 1. Average values of Leaf Area Index, LAI; is a dimensionless parameter.
between the sixth and the seventh months, after which the nodes’ number ceased to increase. After the sixth month, their heights have been stabilized, making the plants to have less average growth rate values Figure 2. Also, all the treatments LAI average values were close as the graph shows, but maximum tillage treatment had high values than others. Leaf Area Index (LAI) increases as the number and size of individual leaves increases, reaching a peak of 5 to 6 months after planting. It must be noted that the LAI has increased values because of the canopy formed by the shoots. Regression equations found from Figure 1, Equations 2 – 4 show that there were stronger relationships as shown by their higher R2 values (R2 = 0.999, 0.997, 0.999) between independent variable , (that is, methods of tillage) and (LAI average values of the leafiness of the cassava).
For zero tillage,
zero = -0.0008 3 + 0.05 2 + 0.031 + 0.05; R2 = 0.999
Equation 2
For minimum tillage,
min imum = -0.07 3 + 0.000 2 + 0.021 + 0.034; 0.997
2
R = Equation 3
For maximum tillage,
max imum =-0.0000008 3 +0.00005 2 + 0.033 - 0.006; 2
R = 0.999
Equation 4
118
Res. J. Agric. Environ. Manage
Table 2. Mean Area of Cassava leaves in the first three Months; n= 480/treatment.
Days
Classifications of leaves as to longest or widest For the longest leaves, cm 2 0
10 20 30 40 50 60 70 80 90
1 c
7.2±70.01 c 10.0± 50.02 b 11.8± 20.4 c 11.9± 24.3 b 12.8±70.2 c 14.2±40.0 b 15.4±30.24 c 16.7±82.06 c 18.1±112.7
For the widest leaves, cm2 2
a
8.0±41.02 b 9.8±32.42 c 11.1±10.03 b 12.0± 32.6 c 12.6±42.3 b 14.5±32.6 c 15.3±40.05 b 16.7 ±120.7 b 18.4 ±80.3
0 b
1 c
7.9±22.1 c 10.4±31.6 a 11.9±21.41 a 12.4±12.08 a 12.9±30.04 a 14.7±44.11 a 15.7±160.4 a 16.8±110.3 a 18.8±120.02
2 b
2.2±40.4 b 4.1±50.12 a 4.4±11.0 b 4.5±32.2 b 4.8±40.5 b 5.0±10.0 b 5.6±28.1 c 6.3±40.0 c 6.7±90.1
2.1± 38.1 a 4.4±22.21 c 4.3±18.8 b 4.5±32.0 b 4.8±10.02 a 5.2±30.0 b 5.6±30.3 b 6.4±60.0 b 6.7±85.02
2.2±53.01a c 4.0±32.2 b 4.3±22.1 a 4.5±40.0 a 4.7±34.3 b 5.0±20.2 a 5.8±45.0 a 6.6±40.1 a 6.8±100.1
Mean values with the same superscripts along the same row for the same classification are not significantly different at 5% l evel.
Figure 2: Average growth rate of Cassava in 9 months.
The maximum tillage has higher LAI values at all stages of the experiment than any other two methods (discrepancies was at 120 and 240 days). Growth, development and average yield of cassava tubers The mean values of area for the longest and widest leaves are recorded in Table 2. There were statistical differences (p