ISSN 1392–1320 MATERIALS SCIENCE (MEDŽIAGOTYRA). Vol. 14, No. 3. 2008
Effect of Dynamic Load on Value of Point Load of Mineral Wool Boards Andrius BUSKA1∗, Dorthe LYBYE2, Romualdas MAČIULAITIS1 Department of Building Materials, Vilnius Gediminas Technical University, Saulėtekio al. 11, LT-10223 Vilnius, Lithuania 2 Rockwool International A/S, Hovedgaden 584, DK-2640 Hedehusene, Denmark 1
Received 01 June 2008; accepted 29 June 2008 This paper presents the research on the effect of dynamic load on the point load value of mineral wool boards used for thermal insulation in low-slope roofs. Mineral wool boards for thermal insulation of low-slope roofs are described by the values of compressive stress (σ10) and point load (F5). For this work, three types of mineral wool boards normally used as thermal insulating layer and/or as basis for the waterproof roofing membranes were tested. Usually, during roof installation or regular maintenance, these boards are affected by reoccurring short-term loads acting on a small area which is due to “walking”. In order to simulate the effects of short-term dynamic loading, a JW fatigue machine with a special construction was used. The surface of a test specimen was compressed till its deformation would reach 5 mm, using a periodic load of 147 kPa repeated every 2 seconds – in the same way as the board would have been affected while by “walking” on it during its operation use. In order to determine how the short-term loads affect the strength of the test specimen, the initial values of density and point load were measured. After dynamic fatigue test the changes of these values were determined again. The results show that the surfaces of all types of mineral wool boards were damaged. Residual deformations appeared on the surface due to strain concentration and plastic deformations. The presented results show that the value of point load dynamic resistance σPL(DR) amounted to 63 % – 86 % of the point load value measured before the tests. Some test specimens showed an increased value of point load, compared to the value before the tests. This demonstrates the structural non-homogeneous of the mineral wool. Keywords: mineral wool, stone wool, dynamic load, point load, dynamic fatigue, layered structure.
1. INTRODUCTION ∗
characteristics in normal operation conditions. Moreover, there are practically no tests of materials durability and characteristic changes during normal operation [4]. Thermal insulation products used in low-slope roofs are normally affected by the short-term dynamic load which occurs because of human weight. In the references [5, 6] it is stated that the load of one standing person can reach from 25 kPa – 62 kPa, in the average 32.9 kPa. The size of static load depend on human weight (approximately 80.1 kg) and the shoe size (supporting area about 440 cm2). However, the author [6] states that the dynamic loads occuring during walking increase approximately 4 times, this will give a load in the average of 130 kPa – 150 kPa. In order to avoid damaging of the roof system by destroying the thermal insulation layer during of its installation (see Fig. 1 and Fig. 2) or later by regular maintenance it is needed to determinate the resistance of the thermal insulation materials to the reoccurring dynamic load due to frequent pedestrian traffic.
Low-slope roof is the part of the building envelope which is affected by the largest possible combination of loads: wind, snow, pedestrian traffic during roof installation and maintenance that is why thermal insulation materials must have high physical-mechanical features. Only rigid load-bearing products should be used as thermal insulation layer. For mineral wool boards the declared values should be the compression stress at the 10 % deformation (σ10) or the compression strength (σm) as well as the value of point load (F5). The values should be determined in accordance with standard LST EN 13162 [1]. The European Organization for Technical Approvals (EOTA) has prepared and approved the European Technical Approval Guideline ETAG 006 [2] that includes the technical requirements for the thermal insulation materials used in the low-slope roof systems. According to [2] Clause 6.4.3.1, it is recommended that the value of point load (at 5 mm deformation) of thermal insulation products used for the top layer of the low-slope roofs, must be F5 ≥ 500 N (or after conversion to the area measures σPL ≥ 100 kPa) according to LST EN 12430 [3]. The aim of the point load test is to determinate the influence of the direct load (affecting a small surface area) on thermal insulation materials. Direct load will occur during installation or maintenance, usually because of workers’ walking on the material. However, these values are determined in laboratories by testing only newly manufactured products. It is seen that test results obtained in laboratories usually do not reflect the real material ∗
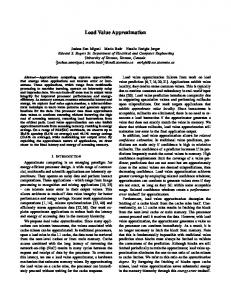
Fig. 1. Insulation board (in dimensions 1200 mm × 600 mm) destructed by pedestrian traffic
Corresponding author. Tel.: +370-685-55789; fax.: +370-5-2745219. E-mail address:
[email protected] (A. Buska)
268
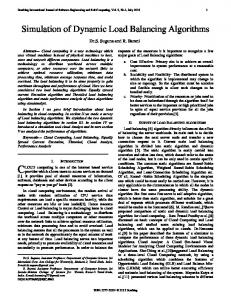
Fig. 2. Thermal insulation material (board in 2000 mm × 1200 mm) after walking on it
dimensions Fig. 3. Point load test
The aim with this work is to determine the changes of the point load value due to the effect of dynamic loading (dynamic fatigue) simulating walking on the mineral wool products of different types and structure.
human. The diameter of the cylindrical indenter corresponds to the area of a foot heel (about 50 cm2). The equipment artificially affects the test specimen in the same way as it thought to be affected by “trampling” in normal usage. The test consists of 4 cycles, after each cycle the test specimen is rotated 90 degree so that the surface of the test specimen is fully affected by the dynamic load. Similar constructions and device principles are used for testing of other materials (for instance polymers) as well [7, 8]. The tests were performed in the following order: – the squarely test specimens in the dimensions of (300 × 300) mm and (600 × 600) mm at original product thickness were cut from the boards mentioned in Table 1;
2. TEST SPECIMENS AND METHODS Three types of stone wool products with different structure were used for testing (see Table 1). The point load test is performed according to the requirements of standard LST EN 12430 [3]. The prepared test specimen is initially preloaded with a force of 2.5 N ±0.25 N corresponding to a pressure of (500 ±50) Pa. The compressive force is applied to the test specimen by a circular indenter acting on 50 cm2 of the specimen surface area, this requires the usage of cylindrical indenter of steel having a diameter of 79.8 mm (Fig. 3). The compressive force is increased with constant speed (50 ±5) mm/min. and the test specimen deformation is measured and recorded. The test is performed until the critical point is reached (i.e. until the material yield limit at compression), or when the deformation reaches 20 %. According to the standard LST EN 13162 [1] for mineral wool products, the point load is measured and declared at 5 mm deformation. In order to imitate the effect of dynamic loading (dynamic fatigue) the JW fatigue machine of special construction was used. The surface of the test specimens was cyclically pressed every 2 seconds 15 times each time till the deformation of 5 mm was achieved, applying the reoccurring loading of (147 ±2) kPa due to acting of 16 cylindrical indenters of steel (the diameter of each 79.8 mm) (Fig. 4). The load was chosen considering the dynamic loadings occurring due to walking of a medium weight
Fig. 4. Dynamic fatigue test on JW machine
Table 1. Stone wool products used for testing Amount of test specimens (n), pcs
Thickness range (d), mm
Density (ρ), kg/m3
Thermal conductivity (λD), W/m·K
Compressive stress at 10 % deformation (σ10), kPa
Point load value at 5 mm deformation (F5), N
MWB-5/50
37
60 - 100
150*
≤ 0.040
≥ 50
≥ 500
MWB-9/100
36
50 - 140
175*
≤ 0.043
≥ 90
≥ 1000
MWR-5/100
41
60 - 160
150**
≤ 0.040
≥ 50
≥ 1000
Type of test specimen
* – mono density board; ** – layered structure board consist of material with more than one density.
269
– the test specimens in dimensions (300 × 300) mm were used for the measurements of point load, and the test specimens of (600 × 600) mm were affected by the dynamic loading (dynamic fatigue); – after the test of dynamic fatigue, the test specimens in dimensions (600 × 600) mm was removed from JW machine, and were cut off 150 mm from all sides (so that only the middle part would be left) till the dimensions of (300 × 300) mm. These test specimens in dimensions (300 × 300) mm are used for the measurements of point load after dynamic fatigue in order to determinate the point load changes caused by the effect of short-term dynamic loading. Before the point load tests the density (before and after dynamic fatigue) of all test specimens was determined according to method described by standard LST EN 1602 [9]. The organic content in the test specimens was measured according to standard LST EN 13820:2003 [10].
the surfaces of the mineral wool boards are damaged, because the structural homogeneity of the fibrous composite matrix of the mineral wool is destroyed. Residual deformations appear on the surface due to strain concentration and plastic deformations. This can be seen from the measured results of the density change (increase) for the test specimens having the lowest density and the lowest declared value of point load. The density of these specimens increases because their surface is totally damaged and the measured thickness of the test specimens is smaller (after dynamic fatigue). This did not happen with the test specimens having higher declared value of point load. The calculated standard deviation for the density did not change significantly after dynamic fatigue. However, the average standard deviation for values of point load for the specimens change after dynamic fatigue (instead of former approximately ±(10 – 11) % till ±(16 – 32) %. Some test specimens even has an increase in point load value after the dynamic fatigue compared to the value before the test. This probably happens because of the surface layer becoming denser. This demonstrates the structural nonhomogeneity of the mineral wool. It should be noted that measured average values of point load for the all types of specimens coincide with the point load values declared by the manufacturer even after dynamic loading. In order to describe and quantify the test results the value of point load dynamic resistance σPL(DR) was used. It shows the percentage change of the value of point load after dynamic fatigue compared to the value of point load without dynamic fatigue:
3. RESULTS AND DISCUSSION The results of all the measurements are shown in Table 2. As expected, it is clearly seen from the results presented in Table 2, the dynamic loading influences the values of point load – they decrease for all the types of test specimens. The biggest change in values occurred for the specimens MWB-5/50, having the lowest density and the lowest declared value of the point load. After dynamic fatigue, the value of point load (F5(DL)) decreased from 910 N to 580 N compared to the value of point load (F5) measured for the test specimens which were not exposed to dynamic fatigue. Whereas, the (F5(DL)) values of the test specimens for the types MWB-9/100 and MWR-5/100 decrease about 15 % – 16 %, correspondingly: for the MWB-9/100 test specimens from 1660 N to 1440 N, and MWR-5/100 from 1520 N to 1300 N. The changes in point load values after dynamic fatigue could be explained by:
σPL(DR) =
F5( DL ) F5
·100, %,
(1)
where: F5(DL) is the measured value of point load after dynamic fatigue, in N; F5 is the value of point load (before dynamic fatigue), in N.
Table 2. Measured average values of point load and density before dynamic fatigue and after dynamic fatigue test Before dynamic fatigue Density (ρ), kg/m3
After dynamic fatigue
Point load (F5), N
Density (ρ(DL)), kg/m3
Point load (F5(DL)), N
159.5
580
MWB-5/50 test specimens Average value
153.6
910
Standard deviation
11.0
90
15.7
190
Min measured value
128.8
760
133.8
320
Max measured value
173.2
1110
190.4
960
1440
MWB-9/100 test specimens Average value
180.2
1660
177.4
Standard deviation
12.9
170
13.3
250
Min measured value
157.7
1280
154.3
870
Max measured value
218.4
2100
213.0
1840
MWR-5/100 test specimens Average value
163.3
1520
163.49
1300
Standard deviation
13.07
150
13.33
210
Min measured value
143.0
1230
144.6
880
Max measured value
199.6
1870
202.5
1780
270
The value of point load dynamic resistance σPL(DR) depends on density, binder content and mechanical characteristics of the test specimens. The lowest σPL(DR) value is calculated for the test specimens marked as MWB5/50 and reaches approximately 63 % value of the point load before the dynamic fatigue test. Also the average standard deviation is very wide, because it reaches 30 %. Values of point load dynamic resistance σPL(DR) calculated for the two other types of test specimens: MWB-9/100 and MWR-5/100, are similar 86 % and 85 % (see Fig. 5). The average standard deviation is 12 % for both types of the test specimens.
After processing the test results with mathematicalstatistical program Statistica [11], it was defined that there exists a strong linear dependence and functional relation between the point load value and the point load value after dynamic fatigue test. The calculated linear regression curve (see Fig. 6) has the correlation coefficient R = 0.923. Also, after measurements of binder (phenol-formaldehyde resin) content in the test specimens, was defined following the average binder contents in the all types of the test specimens (Table 3). Table 3. Average binder contents in the test specimens
90
σPL(DR), %
Binder content, %
Test i
100
average value
standard deviation
80
MWB-5/50
3.42
±0.33
70
MWB-9/100
3.96
±0.35
60 50
MWR-5/100
3.76
±0.25
These results explain the values presented in Fig. 5 and show that the binder content influences the value of dynamic point load resistance σPL(DR). In this case we could assume that the content of the binder in the test specimens influences for the value of dynamic point load resistance σPL(DR). The test specimens MWB-5/50 have lowest content of binder (3.42 %) and have the lowest value of σPL(DR) = 63 %. The specimens MWB-9/100 with highest content of binder (3.96 %) respectively have the highest value of σPL(DR) = 86 %. It is determined that other parameters (for instance the density and the value of point load dynamic resistance) correlate among themselves, but they also have essential functional dependence (correlation coefficient R > 0.54). Measured results confirm that the dynamic point load resistance σPL(DR) for mineral wool boards mostly depends on mechanical-deformation characteristics of the
40 30 20 10
MWB 5/50
MWB 9/100
MWR 5/100
0 Fig. 5. Value of point load dynamic resistance σPL(DR) for different types of test specimens
For comparison we could write, that the lowest σPL(DR) value was measured for the test specimen marked as MWB-5/50 and reached only 40 %, and the highest one was 122 % for the test specimen MWR-5/100. Such huge differences can perhaps be explained by uneven fibrous structure or influence of defects because of the applied concentrated load in a small area.
Fig. 6. The linear regression curve of functional relation between point load before and after dynamic fatigue test
271
2.
ETAG 006:2000. Guideline for European Technical Approval of Systems of Mechanically Fastened Flexible Roof Waterproofing Membranes. 2000: 80 p. 3. LST EN 12430:2000. Thermal Insulating Products for Building Applications – Determination of Behaviour under Point Load. 2000: 10 p. 4. Hendricks, N. A. New Test Method to Assess the Walkability of Roof Insulation Boards Proceedings of 12th International Roofing and Waterproofing Conference, 25 – 27 September 2002, Orlando, Florida. 5. Gorchanuk, U. The Idealized Substantiation and Check of Efficiency of Models of Movings and Jumps of the Sportsmen in Beach Volleyball Transactions of Scientific Works: Physical Training of Students of Creative Specialties 6 2003: pp. 72 – 87 (in Russian). 6. Ogurtsova, T. Method of Investigation of Human Support Movement Apparatus by Foot Prints in Dynamics and Synthesis of Bionic Insoles The Summary of PhD Thesis Riga Technical University, Riga, Latvia, 2006. 45 p. (in Russian). 7. NT Method NT POLY 187. Resistance to Cyclic Compressive Loading with Square Wave Load. 2004: 4 p. http://www.nordicinnovation.net/nordtestfiler/poly187.pdf 8. Bareišis, J. Cyclic Strength and Fracture of Plastics Materials Science (Medžiagotyra) 1 1997: pp. 38 – 43 (in Lithuanian). 9. LST EN 1602:1998. Thermal Insulation Products for Building Applications. Determination of Apparent Density. 1998: 5 p. (in Lithuanian). 10. LST EN 13820:2003. Thermal Insulating Materials for Building Applications. Determination of Organic Content. 2003: 9 p. 11. Sakalauskas, V. Statistics with Statistica. Vilnius, Margi raštai, 1998: 227 p. (in Lithuanian). 12. Buska, A. Effect of the Point Load on the Mineral Wool Products of Different Structure Proceedings of 10th National Conference of Junior Researches “Science – Lithuanian Future” Vilnius, 29–30 March 2007. pp. 16 – 23 (in Lithuanian).
products surface layer and the binder content. The dependency on density is weaker because the boards having a high value of point load had even higher values of point load after the dynamic fatigue test as well. Test results also showed that layered structure stone wool boards (consisting of a top layer of higher density and a low density bottom layer [12]) having lower average density are sufficiently resistant to the effect of dynamic loading. The dense layer on the products of layered structure overtakes the concentrated compressive pressure spreading the point load into the plane so pressure is acting across a greater area.
4. CONCLUSIONS 1.
2.
3.
During installation and/or regular maintenance of lowslope roofs, thermal insulation materials are affected by dynamic loadings (sometimes reaching 130 kPa – 150 kPa) occurring due to pedestrian traffic. That is why it is important to define the material resistance to dynamic point loading. Materials resistance to dynamic loading could be defined by the value of point load dynamic resistance σPL(DR). The value point load dynamic resistance determined during the present tests reached 63 % – 86 % compared to the value of point load before the dynamic fatigue test. The point load dynamic resistance for mineral wool boards mostly depends on mechanical-deformation characteristics of the products surface layer and the binder content. The dependency on density is weaker because the boards having high value of point load had higher value of point load after the dynamic fatigue as well. The value of point load after the dynamic fatigue in 92 % depends on the point load value measured without dynamic fatigue.
REFERENCES 1.
LST EN 13162:2003. Thermal Insulation Products for Buildings – Factory Made Mineral Wool (MW) Products – Specification. 2003: 31 p. (in Lithuanian).
272