Effect of fatigue on maximal power output at different contraction velocities in humans. A. BEELEN AND A. J. SARGEANT. Department of Muscle und Exercise ...
Effect of fatigue on maximal power output at different contraction velocities in humans A. BEELEN
AND
A. J. SARGEANT
Department of Muscle und Exercise Physiology, Fuculty of Human Vrije Universiteit, 1105 AZ Amsterdam, The Netherkznds I~EELEN, A., AND A.J. S~~EAN~.~~~~C~~~~~~~~~ OTZ TM&n-mlpower output at different contraction velocities in humans. J. Appl. Physiol. 71(6): 2332-2337,1991.-The effect of fatigue as a result of a standard submaximal dynamic exercise on maximal short-term power output generated at different contraction velocities was studied in humans. six subjects performed 25-s maximal efforts on an isokinetic cycle ergometer at five different pedaling rates (60,75,90,105, and 120 rpm). Measurements of maximal power output were made under control conditions [after 6 min of cycling at 30% maximal C& uptake (vo2 mm)] and after fatiguing exercise that consisted of 6 min of cycling at 90% VOzms with a pedaling rate of 90 rpm. Compared with control values, maximal peak power measured after fatiguing exercise was significantly reduced by 23 k 19? 28 2 11, and XI * 11% at pedaling rates of 90, 105Yand I20 rpm, respectively. Reductions in maximum peak power of 11 k 8 and 14 & 8% at 60 and 75 rpm, respectively, were not significant. The rate of decline in peak power during the 25-s control measurement was least at 60 rpm (5.1 k 2.3 W/s) and greatest at 120 rpm (26.3 k 13.9 W/s). After fatiguing exercise, the rate of decline in peak power at pedaling rates of 105 and 120 rpm decreased significantly from 21.5 & 9.0 and 26.3 & 13.9 W/s to 10.0 k 7.3 and 13.3 * 6.9 W/s, respectively. These experiments indicate that fatigue induced by submaximal dynamic exercise results in a velocity-dependent effect on muscle power. It is suggested that the reduced maximal power at the higher velocities was due to a selective effect of fatigue on the faster fatiguesensitive fibers of the active muscle mass.
exercise; muscle; isokinetic; cycling
HUMAN MUSCLE FATIGUE is a frequently experienced phenomenon during normal dynamic exercise. The underlying mechanisms of fatigue in human muscles have evoked much interest for many years. However, the causes of fatigue are still not clearly established. Most of the studies have investigated the effect of fatigue on isometric force production (for review see Ref. 5). Although in normal daily life muscles are mainly used in dynamic situations in which force and velocity are important, the effect of fatigue on dynamic muscle functioning has less often been the subject of investigation. It was against this background that one of us carried out an earlier study to examine the effect of dynamically induced fatigue on subsequent dynamic function (18). Fatigue, induced by 6 min of cycling exercise at 90% maximal O2 uptake (VOWmm), reduced maximal short-term power output in a
subsequent sprint by 30%. In that study maximal power output was measured under isokinetic conditions at only 2332
0161~7567/91$1.50
Movement
Sciences,
one pedaling rate (112 rpm). The effect of fatigue on short-term power output generated at different contraction velocities (i.e.9 isokinetic pedaling rates) was not investigated. There is a possibility, as suggested by animal studies, that fatigue may have a greater effect on muscle power production at higher than at lower contraction velocities (6, 8). These animal experiments demonstrated that fatigue results in changes in force-velocity characteristics, mainly due to a reduced maximum velocity of shortening, which the authors attributed to a slowing of cross-bridge cycling. In those experiments fatigue was induced by electrical stimulation of the whole muscle fiber population in an isometric situation. It is not known how relevant such observations are to intact in vivo human muscle, where fatigue is normally induced by voluntary dynamic exercise in which there is a selective hierarchical pattern of muscle fiber recruitment (22). In the present investigation we have examined the effect of fatigue induced by voluntary dynamic exercise on shortterm power output at different contraction velocities in humans. METHODS
Six healthy male subjects, having given informed consent, took part in the studies; their physical characteristics and VOWmm are given in Table 1. On the first visit to the laboratory, Vo2 maxwas directly determined in a maximal incremental exercise test on an electrically braked cycle ergometer. Oz uptake was measured using Douglas bags. Gas samples were analyzed for Oz concentration (Mijnhardt Oxylyser UG64) and CO2 concentration (Mijnhardt Capnolyser UG55). The volume of expired air was measured with a dry gas meter. Maximal short-term power output at different constant velocities was measured during cycling with an isokinetic cycle ergometer (19) that had two configurations. For maximal short-term power measurements a coupling to an isokinetic control system was made. This system consisted of a 2.2-kW electric motor and a variable-speed gear box that enabled the setting of an upper constantvelocity limit to pedal frequency in the range between 23 and 180 rpm. Subjects were seated on the ergometer with their feet strapped to the pedals while the motor was switched on and the pedal frequency was selected. The subjects were allowed a brief time to reach the required pedal frequency. After that they were instructed to make a maximal effort for 25 s in an attempt to increase pedal
Copyright @ 1991 the American Physiological
Society
POWER
TABLE Subject
A 3 c Ll E
F
OUTPUT
AND
1. Subject charucteristics und h2&P Yr
Body Mass, k
Height, m
vo 2-3 Urnin
ULV, liters
25 24 25 30 35 45
63.5 79*7 77.2 71.2 88.7 82.7
1.71 1.82 1.90 1.82 1.91 l-83
3.81 3.89 5.07 4.40 4.02 4.47
4.28 6.18 5.85 5.72 6.16 6.48
vo 2 -, maximal ume (mean of right
Oz uptake; ULV, upper and left leg).
leg muscle
(plus
bone)
vol-
frequency. Because of the characteristics of the isokinetic control system, variation in pedal frequency over the whole 25-s maximal effort was ~4%. Throughout the 25-s effort the forces exerted on the pedals were continuously monitored by strain gauges mounted in the pedals. Forces vertical and horizontal to the pedal surface were measured. Incremental encoders were used to measure the angle between the crank and the pedal surface and the angle of the crank with respect to the vertical. Forces and angles were stored on microcomputer disks for subsequent analysis. Peak force and peak power for each revolution and for each leg were calculated. Peak force was the greatest effective force (i.e., force exerted tangentially to the arc of crank rotation) in each revolution. Peak power was the power generated at the instant of the peak force (peak power = peak force X crank velocity). For each 25-s maximal effort, maximal peak power values were determined as the mean of three consecutive values in which the highest observed peak value occurred (after 3-5 revolutions). The mean power output for each complete revolution was calculated from the effective force with respect to time. Maximal mean power was the average of the mean power for the three revolutions in which the highest observed peak power occurred. Reported values for maximal peak power and maximal mean power are mean values for the left and right leg. As an index of the rate of fatigue during the maximal effort, we calculated the absolute rate of decline in peak power during 20 s rate of decline (W/s) =
initial peak power - final peak power 20 s
where initial peak power was the mean of three revolutions that represented the highest observed peak power, and final power was the mean of three revolutions 20 s after the attainment of the highest observed peak power. A mean value for both legs was calculated. Measurements of power output were made at five different pedal frequencies: 60, 75, 90, 105, and 120 rpm under two experimental conditions: 1) a control (unfagued) condition and 2) a fatigued condition. In the control condition the subjects performed 6 min of low-level exercise (30% V0 zmm) at 90 rpm before performing the 25-s maximal effort. In the fatigued condition the subjects performed the 25-s effort immediately after a fatiguing exercise of 6-min cycling at an exercise intensity of 90% vo 2 mm with a pedal frequency of 90 rpm. Over the last 2 min of each 6-min exercise period, Oz uptake and the forces exerted on the pedals were measured. Average
FATIGUE
IN
2333
HUMNS
peak force was calculated as a mean peak force of 15 revolutions. The low-level and fatiguing exercises were performed on the same ergometer that was used for the power measurements. During the 6-min exercise period, the subject pedaled with a coupling to a normal electrically braked cycle ergometer. Immediately after the 6min exercise the coupling was instantly switched to the isokinetic control system, which was set at the chosen velocity, and the subject performed the 25-s maximal effort. All six subjects performed under both control and fatigued conditions at each pedal frequency. The experiments were performed 21 day apart and in random order. The optimal velocity for maximal power output in the unfatigued state was estimated from the linear regression of maximal peak force and velocity using the measurements made at the five velocities studied but with the addition of measurements at 40 and 140 rpm (19). Maximal peak power at optimal velocity was calculated from the individual linear regressions. The effect of the 6-min prior exercise on muscle temperature (T*) was measured in separate experiments using a needle thermocouple (type A-k8, Ellab) in three subjects. The thermocouple was inserted to a depth of 3 cm below the skin into the vastus lateralis muscle at midthigh. Measurements were taken at rest and immediately after 6 min of low-level exercise (control) and after the fatiguing exercise. Upper leg muscle plus bone volume was estimated by anthropometry as described by Sargeant and Davies (17). For comparisons of the values of power output obtained between the control and fatigued conditions at the five pedaling rates, a two-way analysis of variance (ANOVA) for repeated measures was used. When the ANOVA resulted in a significant F value (P -c 0.05), the difference between the means was evaluated with the Newman-Keuls test (a = 0.05). Relationships between variables were examined by a Pearson correlation analysis. Data are reported as means * SD unless otherwise noted. RESULTS
Under control conditions the maximal peak force declined linearly for all subjects as pedaling rate increased (r > 0.96, P < 0.01). The individual regression equations are given in Table 2. The maximal peak power predicted TABLE 2. IndiGdual regression equations of maximul peak force of pedaling rute and optimal ~eduling rate for muximul power output Subject
A B c D
E F F, maximal
V,,pt, optimal
Regression Equation ofFon V F = 1037 F = 1350 F = 1437 F = 1015 F = 1527 F = 1481
-
3.13 x 4.73 x 5.74 x 4.16 x 6.50 x 6.80 x
peak force; pedaling rate
r
V V V V V V
V, pedaling for maximal
V opt9 mm 166 143 125 122 117 109
1,577 1,767 1,650 1,135 1,643 1,479
rate; r, coefficient power output
of correlation; (PPmm).
0.95 0.99 0.98 0.99 0.99 0.98
2334
POWER
OUTPUT
AND FATIGUE
3. Rate of decline in peak power during sprint efforts at variuus pedaling rates in the unfatigued and fatigued stutes
1800 -
n 5 $ 3 ii
TABLE
. l50W
Rate of Decline
.
Pedaling Rate, ITm
+g 12uo-
i
EL 3 .-E
X
IN HUMANS
60 75 90
. [
1
i
1
i
900-
.
2
.
600 30
I 60
*
pedaling
I 90
,
Q
unfatigued
l
fatigued
I 120
.
1
Unfatigued
Fatigued
5.lk2.3 7.4k3.1
6.21k3.6 9.7zk3J3 12.227.7
18.6k9.4 215~9.0 26.3kl3.9
105 120
W/s
10*0&7.3* 13.3&6.9*
Values are means & SD for 6 subjects. * Significantly unfatigued value: P < 0.01.
different from
150
rate (rev- min-I )
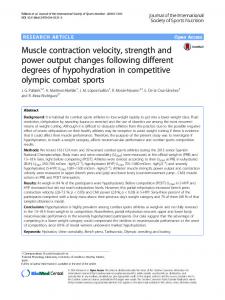
Maximal peak power at 5 different pedahng rates in unfatigued and fatigued states. Values are means & SE for 6 subjects. FIG.
in Peak Power,
1.
from the linear regressions ranged from 1,135 to 1,767 W at pedaling rates in the range of 109-166 rpm (Table 2). During the last 2 min of the 6-min exercise designed to fatigue the muscle, Oz uptake was 3.93 k 0.46 Urnin, equivalent to 92 & 4% To2 maX.This exercise intensity at 90 rpm required an average peak force of 397 2 52 N, which corresponded to 48 & 9% of the maximal peak force available at 90 rpm. The effect of this fatiguing exercise on maximal peak power generated in a subsequent sprint is illustrated by Fig. 1. Atier the fatiguing exercise, maximal peak power during a subsequent sprint was reduced by 23 k 19,28 * 11,and 25 & 11% at pedal frequencies of 90,105, and 120 rpm, respectively (P < 0.01). The reductions of maximal peak power of 11 k 8 and 14 k 8% at 60 and 75 rpm, respectively, were not significant. In the unfatigued as well as the fatigued condition, maximal peak power was highly correlated to maximal mean power (power for a complete revolution) The linear relationship for the combined data is given by y = -125 + 0.73x (r = 0.96Y P c 0.01). Therefore a virtually identical effect of fatigue was found on both maximal peak power and maximal mean power. The fatiguing exercise reduced maximal mean power by 24 k 16,30 k 10, and 33 k 11% at 90P 105, and 120 rpm, respectively (P < 0.01). The reductions at 60 and 75 rpm were not significant. In the unfatigued condition the rate of decline in peak power increased as velocity increased; at 60 rpm the rate of decline in peak power was 5.1 * 2.3 W/s, and this increased to 26.3k 13.9 W/s at 120 rpm (Table 3). The effect of velocity on the rate of decline in peak power was markedly reduced by fatigue inasmuch as the fatiguing exercise had no significant effect on the rate of decline in peak power at 60,75, and 90 rpm, whereas at 105 and 120 rpm the rate of decline was reduced after the fatiguing exercise (10.0 k 7.3 and 13.3 * 6.9 compared with 21.5 * 9.0 and 26.3* 13.9 W/s in the unfatigued condition P < 0.01) An example of the changes in peak power during a maximal sprincat 60 and 120 rpm is given in Fig* 2, A and B. At 60 rpm fatigue hardly affected either the maximal peak power attained at the beginning of exercise or the
rate of decline. In contrast, at 120 rpm the maximal peak power is substantially reduced in the fatigued state by -25%. However, the rate of decline in peak power is also reduced in the fatigued state. As a consequence there is no difference in thi peak power generated 20 s after the attainment of maximal peak power between the control and the fatigued conditions. This effect was seen in all subjects. No significant difference could thus be demonstrated between the control and fatigued conditions in
0
5
IO
15
time
20
25
(s)
2000
- 1500 3 yt3* z 1000 g x z So0 . 0 ; 0
a
I
5
.
I
IO
time
.
.
15
I
20
.
1
25
k) . t
FIG. 2. Peak power generated by subject C during each pedal revolution during a 25-s maximal sprint effort at 60 (A) and 120 rpm (B) in control (0) and fatieed (@) conditions.
POWER
4. Quadriceps muscle temperature
TABLE
Muscle Subject
A B c Mean
Normal
resting
35.9
36.9 36.6 k SD
36.5kO.5
Temperature,
QLJTPUT
AND FATIGUE
at 3 cm depth ‘C
After 6 min at 30% vog-
After 6 min at 90% voz-
38.3 37.7 36.4
38.8
37.5kO.3
39.4 39.2 39.lkO.3
peak power after 20 s of the maximal effort at the higher velocities, despite an initial significant difference in maximal peak power. Values for vastus lateralis Tm in the different conditions are given in Table 4. Fatiguing exercise increased Tm by 2.6*C, whereas low-level exercise in the unfatigued condition caused an increase in Tm of only l.O*C. DISCXJSSION
In these experiments the relationship of maximal peak force to pedaling rate over the range of speeds studied is linear (r > 0.96, p K 0.01). This relationship is consistent with previous investigations that have used the same type of isokinetic cycle ergometer (7Y l4,19). The reasons for this linear relationship in contrast to the curvilinear relationship described for isolated muscle preparations are not clear, but it should be remembered that measurements have not been made at the very slow speeds at which force might be expected to increase appreciably for modest decreases in speed. We examined the effect of fatigue on muscle power generated at different pedaling rates during cycling. It was clear from the results that the effect of a standard fatiguing exercise on subsequent power output is dependent on the pedaling rate at which power output is generated. We found no significant reductions in maximal peak power at the lower velocities of 60 and 75 rpm, whereas at the higher velocities, 90, 105, and 120 rpm, there were significant reductions in power output ranging from 23 to 28%. An almost identical velocity-dependent effect of fatigue could be demonstrated for the maximal mean power, i,e.Y the mean power calculated for a complete revolution. It is probable that the reductions in power output are somewhat masked because muscle temperature in the fatigued condition (after 6 min of exercise at 90% vo2 m& was L5*C higher than in the control condition (after 6 min of low-level exercise). In an earlier study it was found that an increased Tm resulted in an increase in the maximal power generated during shorMerm cycling exercise and that the magnitude of this effect was dependent on contraction velocity (15). In those experiments the effect, of warming the leg muscles was to increase power output by m 2% /*C at 54 rpm, but this increased to lO%/*C at 140 rpm. Clearly if a correction for this velocity-dependent effect of temperature had been applied, an even more pronounced effect of fatigue at the faster pedaling rates would have been seen. The velocitv-deDendent effect of fatime on short-term
IN HUMANS
2335
power output demonstrated in the present study is in agreement with the results from animal muscle experiments in which the force-velocity characteristics of control and fatigued muscles were compared (6,8). Perhaps this is somewhat surprising, because in these animal muscle experiments fatigue was induced by electrical stimulation in which all fibers were maximally activated, whereas in the present study fatigue was induced by submaximal voluntary contractions in which there would have been a selective hierarchical recruitment of muscle fibers (11). Although the exact recruitment, strategy in the fatiguing exercise performed by these subjects is not known, it is clear that at this level of exercise (90% vo2 mm), only 48 2 9% of the force -generating capacity of the muscle (measured at the same velocity) is needed (see Ref. 16 for discussion). Vallestad and bo-workers (20) have reported that at this intensity of cycling exercise (pedaling rate 70 rpm) glycogen content is reduced in -95% of the muscle fibers seen on biopsy, despite the fact that only -50% of the maximal dynamic force was utilized. Applied to the present data, their results suggest that the reserve of 50% largely resides in the submaximal firing frequency of motor units at the higher levels of the recruitment hierarchy rather than nonrecruitment of any significant proportion of motor units (1, 10). Under these conditions, the submaximal firing frequency and hence low-level activation of fast fatiguesensitive motor units at the upper end of the recruitment hierarchy may nevertheless be sufficient t,o result, in early fatigue of these motor units. Certainly the present results are consistent with this proposition. Unfortunately almost no information is available on the optimal contraction velocities for maximal power output of different fiber types in human muscle in relation to normal movements such as cycling. Nevertheless the power generated by whole muscles will be the resultant of the power velocity characteristics of the muscle fiber types present. In a muscle with a mixed composition as seen typically in human knee extensors, all types will contribute and be important to the power production at the slower cont,ractioh velocities. Thus selective fatigue of one subgroup of fibers (e.g., fast fatigue sensitive) might have a relatively small effect. As cor&raction velociti increases, the coitribution of faster fibers will become more dominant, not only because the optimum velocity for maximal power generation of the slower fibers may be exceeded, but also because fibers with a higher maximal velocity of shortening (VImax)will produce greater power than slower fibers at their respective optimal velocities. (Of course the Vmax of the slowest fibers may even be exceeded in very fast movements and consequently be unable to make any contribution to power production.) Thus if the form of fatigue generated in this voluntary dynamic exercise affects a fatigue-sensitive subgroup of the faster fibers preferentially, it is to be expected that power production will be more affected at high contraction velocities than at slower ones. The present results support this expectation. The manifestation of fatigue in intact in vivo muscle fibers of differing tvpes, in terms of the relative magni-
2336
POWER
OUTPUT
AND FATIGUE
tude of effect on V..= compared with isometric force, and the temporal relationship of these separate effects are scarcely documented* It may be that the more decisive effect of fatigue on power production, especially at velocities around optimal velocity and above, is the reduction in Vmax (6, 8). Thi s may be the result of slowed crossbridge cycling, as reviewed by Jones (l2), although, as pointed out earlier, the slowing of the rate of cross-bridge cycling may be somewhat masked by the increase in Tm consequent upon the fatiguing exercise itself. An important issue that needs to be considered in the interpretation of these results is whether any, or all, of the fatigue observed could be of central origin. In isometric contractions the possibility of central fatigue can be checked by comparing voluntary force with electrically stimulated force (4) or by superimposing electrical stimulation on maximal voluntary effort (twitch interpolation) (2). It has been shown that, during fatigue from sustained maximum voluntary contractions (4) as well as that induced by submaximal intermittent isometric contractions (3, Zl), subjects were still able to fully activate their muscles. In dynamic exercise evidence for full activation is much more difficult to obtain. Recently Westing et al. (23) demonstrated that in concentric exercise (knee extension), complete voluntary activation of the knee extensors was possible. At present there are to our knowledge no experimental data that directly demonstrate whether it is possible to fully activate the muscles in a complex multijoint movement as performed here, either in the fresh or in the fatigued state. In this context and in relation to the possibility of inhibitory reflexes, it is perhaps worth noting that the absolute forces generated in this form of exercise are considerably smaller than those seen in isometric, or simple relatively slow knee-extension exercise (23). Further evidence regarding the level of activation during this form of exercise can be obtained with an electromyogram (EMG), although one is limited to the use of surface electrodes and the results are difficult to interpret. EMG data obtained during maximal cycling exercise indicated that over the course of a 45-s maximal effort there was no decrease in the integrated EMG despite a marked reduction in force (9) Although not conclusive evidence, an unchanged integrated EMG does not immediately suggest a reduced neural drive. Finally, if in the present study the 6-min exercise had resulted in a reduced neural drive, then this might have been expected to have an equal effect on power output at both slow and fast pedal frequencies; this was not the case. We beiieve that the fatigue induced by 6-min exercise at 90% V02 mm was probably due to factors located in the muscles. In addition to examining the effect of fatigue on maximal power output, i.e., the power attained in the first few seconds of the measurement, we were also able to examine the effect on the decline in power seen during the 25-s maximal effort. Because each experiment was performed at a constant velocity, the changes in peak power are a direct reflection of the changes in peak force seen over 25 s. In the control experiments the rate of decline in peak power over 20 s of the maximal short-term power output measurement increased markedly with velocity (Table
IN HUMANS
3). Whereas pedaling rate (and hence contraction number) doubled from 60 to 120 rpm, the rate at which power declined increased more than fivefold from 5.1 2 2.3 to 26.3 zk 13.9 W/s. Th is ob servation is in line with earlier studies (14, 19) and is consistent with experiments on animal muscle preparations carried out in our laboratory (13). Interestingly the effect of the prior fatiguing exercise was to produce a significant reduction in the rate of decline in peak power during the 20 Sobut only at the higher pedaling rates studied (from 21.5 k 9.0 to 10.0 k 7.3 W/s at 105 rpm and from 26.3 2 13.9 to 13.3 k 6.9 W/s at 120 rpm). An explanation for what at first sight may seem a somewhat paradoxical observation may be that many of the fibers most susceptible to fatigue had already been affected during the prior exercise. Thus they could show little further loss during the maximal power output measurement after 6 min of exercise at 90% voz max. Finally, it should be pointed out that reductions in power output generated during a coordinated movement like cycling could have been the result of differences in coordination due to fatigue, in the sense that it might become more difficult for the subject to direct effectively the forces applied to the pedals. However, with the ergometer system we used in the present study, we were able to measure the direction of the forces generated on the pedals and we found no significant difference in force direction at the instant of maximal peak power between the unfatigued and the fatigued conditions. In addition, the position of the crank at which the highest power was generated in each revolution was the same in the unfatigued and fatigued conditions. Although we did not directly investigate the possibility of changes in coactivation in the present study, it would be surprising if such a change did not result in changes in direction of the forces. These findings suggest that fatigue induced by 6 min of cycling exercise at 90% Vo2 mm had no appreciable effect on the pattern of muscle coordination during a maximal sprint effort. In conclusion, these results demonstrate that, when fatigue is generated by a high-intensity voluntary dynamic exercise, there is a greater effect on muscle power output at higher than at lower contraction velocities in this form of exercise. It seems possible that this velocitydependent effect is due to a selective fatigue of the faster fatigue-sensitive fibers. The authors thank Kees-Jan de Haan and Toon van Zundert for cooperation in the process of data collection and Arnold De Haan for critical reading of the manuscriptAddress for reprint requests: A. Beelen, Dept. of Muscle and Exercise Physiology, Academic Medical Centre, Meibergdreef 15, 1105 AZ Amsterdam, The Netherlands. Received 3 December 1990; accepted in final form 9 August 1991. REFERENCES P,, rn~ G. SJCIGAARD, Selective glycogen depletion in the subgroups of type II muscle fibres during intense submaximal exercise in man. Actu PhysioZ. &and. 96: 26A, 1976. 2. BELANGER, A. Y., AND A. J. McCcww. Extent of motor unit activation during effort. J AppL &&oZ. 51: 1131-1135, 1981. 3. BIGLAND-RITCHIE, B., F. FURBUSH, AND J. J. WOODS. Fatigue of 1. ANDERSEN,
POWER OUTPUT AND FATIGUE IN HUMANS
4.
5. 6.
7. 8.
9. 10. 11. 12.
13.
intermittent submaximal voluntary contractions: central and peripheral factors. J. AppL P/q&L 61: 4X-429, 1986. BIGLAND-RITCHE, B., D. A. JONIZS,G. P. HOSKING, AND R. H. T. EDWARDS. Central and peripheral fatigue in sustained maximum voluntary contractions of human quadriceps muscle. CYin. Sci. Mol. Med. 54: 609-614,1978. BIGUND-RIT~HIQ B., AND J. J. WOODS. Changes in muscle contractile properties and neural control during human muscular fatigue. Muscle &rue 7: 691-699,1984. CROW, M. T., AND M. J. KUSHMIZRICK. Correlated reduction in velocity of shortening and the rate of energy utilization in mouse fast-twitch muscle during a continuous tetanus. J. (%z. HzysioZ. 82: 703-720,1983. DAVIES, C. T. M., J. WENYSS-HOLDEN, AND K. YOWW. Measurement of short-term power output: comparison between cycling and jumping. Ergonomics 27: 285-296,1984. DIZ HAAN, A., D. A. JONES, AND A. J. SARGEANT. Changes in velocity of shortening, power output and relaxation rate during fatigue of rat medial gastrocnemius muscle. PfZuegers Arch. 413: 422-428, 1989. GREIG, C., T. HORT~BAGYI, AND A. J. SARGEANT. Quadriceps surface EMG and fatigue during maximal dynamic exercise in man (Abstract). J. p&sioL Lo& 369: 18OP, 1985. GR,EIG, CA,A, J. SARGEANT, AND N. K. VOLLESTAD. Muscle force and fibre recruitment during dynamic exercise in man (Abstract). J. PIzysioZ.bnd. 371: 176P, 1985, HENNEMAN, E., G. S~MJEN, AND D. 0. CARPENTER. Functional significance of cell size in spinal motoneurones. CL Neurophysiol. 28: 560-580,1965. JONES, D. A. Muscle fatigue due to changes beyond the neuro-muscular junction. In: Humun Muscle Fatigue: PhysiologkaZ Mechunisms, edited by R. Porter and J. Whelan. Montreal: Pitman, 1981, p. 178-196. LODDER, M. A. N., A. DE HAAN, AND A. J. SARGEANT. Effect of
14. 15. 16. 17. 18. 19. 20. 21.
22.
23.
2337
shortening velocity on work output and energy cost during repeated contractions of the rat EDL muscle. I&X J. Appl. PhysioL Occup. Physiol. 62: 430-435, 1991. MCCARTHY, N., G. J. F. HEIGENHAUSER, AND N. L. JONES. Power output and fatigue of human muscle in maximal cycling exercise. J. Appl. Physiol, 55: 218-224, 1983. SARGEANT, A. J. Effect of muscle temperature on leg extension force and short-term power output in humans. Eur. J. AppZ. PhysioZ. Occup. Physiol. 56: 693-698, 1987. SARGEANT, A. J. Optimum cycle frequencies in human movement (Abstract). J. Physio!. Land. 406: 49P, 1988. SARGEANT, A. J., AND C. T. M. DAVIES. Limb volume, composiGon, and maximum aerobic power output in relation to habitual “preference” in young male subjects. Ann. Hum. Biol. 4: 49-55, 1977. SARGEANT, A. J., AND P. DOLAN. Effect of prior exercise on maximal short-term power output in humans. J. AppZ. Physiol. 63: 14751480,1987. SARGEANT, A. J., E. HOINVILLE, AND A. YOUNG. Maximum leg force and power output during short-term dynamic exercise. J. Appl. Physiol. 51: 1175-1182, 1981. VQLLESTAD, N. K., AND P. C. S. BLOM. Effect of varying exercise intensity on glycogen depletion in human muscle fibres. Acta Physid. Stand. 125: 395-405,1985. VOLLESTAD, N. K., 0. M. SIZJERSTED,R. BAHR, J. J. WOODS, AND B. BIGLAND-RITCHIE. Motor drive and metabolic responses during repeated submaximal contractions in humans. J. AppZ. Physiol. 64: 1421-1427,1988. V~LLESTAD, N. K., 0. VAAGE, AND L. HERMANSEN. Muscle glycogen depletion patterns in type I and subgroups of type II fibres during prolonged severe exercise in man. A&z PhysioZ. Stand. 122: 433-441,1984. WESTING, S. H., J. Y. SEGER, AND A. THORSTENSSON. Effects of electrical stimulation on eccentric and concentric torque-velocity relationships during knee extension in man. Actu PttysioZ. Scund. 140: 17-22,199O.