Chinese Journal of Oceanology and Limnology Vol. 33 No. 2, P. 430-438, 2015 http://dx.doi.org/10.1007/s00343-015-4063-4
Effect of flow rate on environmental variables and phytoplankton dynamics: results from field enclosures* ZHANG Haiping (张海平), CHEN Ruihong (陈瑞弘), LI Feipeng (李飞鹏), CHEN Ling (陈玲)** College of Environmental Science and Engineering, Tongji University, Shanghai 200092, China Received Mar. 25, 2014; accepted in principle Jun. 9, 2014; accepted for publication Aug. 20, 2014 © Chinese Society for Oceanology and Limnology, Science Press, and Springer-Verlag Berlin Heidelberg 2015
Abstract To investigate the effects of flow rate on phytoplankton dynamics and related environment variables, a set of enclosure experiments with different flow rates were conducted in an artificial lake. We monitored nutrients, temperature, dissolved oxygen, pH, conductivity, turbidity, chlorophyll-a and phytoplankton levels. The lower biomass in all flowing enclosures showed that flow rate significantly inhibited the growth of phytoplankton. A critical flow rate occurred near 0.06 m/s, which was the lowest relative inhibitory rate. Changes in flow conditions affected algal competition for light, resulting in a dramatic shift in phytoplankton composition, from blue-green algae in still waters to green algae in flowing conditions. These findings indicate that critical flow rate can be useful in developing methods to reduce algal bloom occurrence. However, flow rate significantly enhanced the inter-relationships among environmental variables, in particular by inducing higher water turbidity and vegetative reproduction of periphyton (Spirogyra). These changes were accompanied by a decrease in underwater light intensity, which consequently inhibited the photosynthetic intensity of phytoplankton. These results warn that a universal critical flow rate might not exist, because the effect of flow rate on phytoplankton is interlinked with many other environmental variables. Keyword: environmental variables; phytoplankton; enclosure experiment; flow rate
1 INTRODUCTION Flow rate has a considerable impact on biotic processes and species interactions (Leland, 2003; Allan and Castillo, 2007; Bornette and Puijalon, 2011). This is particularly true for phytoplankton species, whose spatial distributions are governed by water motion (Abraham et al., 2000; Reynolds, 2000). Water flow transports phytoplankton through a variety of light, nutrient and grazing environments in aquatic ecosystems. Flushing, dilution and resuspension are examples of flow effects that are known to influence the growth of phytoplankton (Uhlmann, 1971; Basu and Pick, 1996; Zhu et al., 2007; Elliott, 2010). Observations consistently show negative relationships between flow rate and phytoplankton biomass/ production in freshwater ecosystems (Reynolds, 2000; Salmaso and Braioni, 2008; Lucas et al., 2009; Li et al., 2010; Desortova and Puncochar, 2011). High flow rate has thus been deemed responsible for the low phytoplankton biomass observed under eutrophic
conditions (Wetzel, 2001). High levels of turbulence can prevent harmful algal blooms from occurring, even in nutrient-rich freshwaters (Paerl, 2008; Hudnell et al., 2010). In fact, as human intervention increases (e.g., dam construction, water over-use, abusive land use), water flow has been considerably reduced in many areas, which has become a serious problem in an everincreasing number of rivers worldwide (Nilsson and Renofalt, 2008; Li et al., 2012). Moreover, flow reduction may be worsened by more frequent and prolonged droughts, which are occurring as a result of global climate change (Paerl and Huisman, 2008). Reductions in flow rates cause stagnant waters, which promote harmful algal blooms. Fortunately, bloom
* Supported by the National Natural Science Foundation of China (Nos. 51379146, 51409190) and the National Science Foundation for PostDoctoral Scientists of China (No. 2013M531218) ** Corresponding author:
[email protected]
No.2
ZHANG et al.: Effects of flow rate on environmental variables and phytoplankton dynamics
incidents can be prevented by using hydrological manipulation (Gulati and van Donk, 2002; Wu et al., 2013). Numerous studies have shown that high chlorophyll-a (chl-a) concentrations and algal bloom events are often associated with low flow conditions. Zwolsman and van Bokhoven (2007) found that chl-a concentration in the River Rhine was much higher during the drought season, using a long-term data set. A similar situation was observed in the River Meuse (Van Vliet and Zwolsman, 2008). Four algal blooms in the middle and lower reaches of the Hanjiang River in China showed a strong correlation with the low flow rates associated with droughts in 1992, 1998, 2000, and 2003 (Xie et al., 2004). Since the impoundment of the Three Gorges Reservoir in 2003, there has been a high frequency of algal bloom events in Xiangxi Bay (Qiu et al., 2011). Most inland rivers in Australia have gained worldwide attention since 1991, owing to the occurrence of blue-green algal blooms, resulting from the C slope of the landscape and weirs placed along the rivers (Mitrovic et al., 2003; Ryan et al., 2009). The increasing occurrence of blooms has led researchers to study the effects of flow rate on algal growth in a number of different ways (Wang et al., 2004; Gao et al., 2007; Zhang et al., 2007; Huang et al., 2008). Flow management is widely acknowledged as a strategy for inhibiting bloom development (Mitrovic et al., 2003, 2011; Huang et al., 2011). It was found that a critical flow rate exists, which can serve as a flow target for suppressing the growth of nuisance cyanobacteria. These values may potentially be applied in other rivers in similar climatic zones to suppress nuisance algal bloom. Despite these well-documented studies, a coherent theory for predicting the impact of flow rate on phytoplankton biomass and species interactions is still in its infancy. The existing theory is primarily based on laboratory studies using beakers and flasks, which are likely to generate algal growth rates and nutrient uptake specific to the corresponding flow conditions (Malits et al., 2004; Hondzo and Warnaars, 2008). These studies often ignored the related physical and biological variables, which play an important role in the interactions between flow rate and phytoplankton. For instance, two enclosure experiments with flow rates of 0.15 and 0.30 m/s (Zhu et al., 2010) showed that the high flow rate had a significant inhibitory effect on phytoplankton biomass and a shift in algal composition, but the role of other
431
environmental variables was not investigated. Current research efforts on flow management focus on defining a universal critical flow rate. Unfortunately, the reported values vary significantly, from 0.04 to 0.4 m/s (Mitrovic et al., 2003; Zhang et al., 2007; Long et al., 2011). The main objectives of this study were to: (1) investigate how flow rate affect phytoplankton dynamics and species interactions in natural enclosures, and (2) determine whether such an effect could be altered by physical and biological variables.
2 MATERIAL AND METHOD 2.1 Study site The enclosure experiment was conducted in an artificial lake, Zhongxin Lake, near the Chongming Water Environmental Laboratory of Tongji University. The lake is located on Chongming Island, the third largest island of China, at the Changjiang (Yangtze) River Mouth. The lake has a total surface area of 10 hectares and an average water depth of 1.3 m. It is a freshwater lake, used primarily for tourism. As the main water source of the lake is rainfall, the lake can be regarded as an enclosed system when studying the phytoplankton ecosystem. A more detailed description of the lake can be found in other studies (Li et al., 2010, 2013). 2.2 Experimental design The enclosure experiments were conducted in the western part of Zhongxin Lake. The flowing flume was 1.5-m long, 0.4-m wide and 1.5-m high, with the bottom positioned on the riverbed. Flow was controlled by JVP submersible pumps (Yinsen Electrical Products Co. Ltd., China), with the flow rate ranging from 1.2 to 4.0 m3/h. Flow velocity was measured at six places in the enclosure flume, at a depth of 10 cm below the water surface. The control enclosure had stagnant water with no movement from pumps. The experiment was conducted from April 27 to May 20, 2010. The effects of three different flow velocities (0.10, 0.06, and 0.03 m/s) and one control enclosure were measured simultaneously, hereafter denoted as E1, E2, E3, and E0, respectively. 2.3 Sampling and analysis Water temperature, pH, conductivity, and dissolved oxygen (DO) were measured in the field with a multiparameter analyzing instrument (HQ40d, HACH).
432
CHIN. J. OCEANOL. LIMNOL., 33(2), 2015
Vol.33
Table 1 Nutrient levels during the experiment periods (mg/L)
E0
E1
E2
E3
W
NH+4-N
NOˉ3 N
DTN
TN
SRP
DTP
TP
Min
0.039
0.124
0.326
0.644
0.001
0.014
0.080
Max
0.268
0.306
1.115
1.282
0.017
0.033
0.172
Mean
0.147
0.204
0.729
1.073
0.005
0.020
0.125
Min
0.049
0.144
0.462
0.857
0.004
0.014
0.119
Max
0.390
0.346
1.251
1.434
0.028
0.033
0.211
Mean
0.203
0.243
0.854
1.114
0.012
0.022
0.180
Min
0.044
0.164
0.310
0.751
0.004
0.014
0.143
Max
0.491
0.503
1.297
1.342
0.028
0.038
0.221
Mean
0.221
0.254
0.784
1.155
0.009
0.022
0.187
Min
0.055
0.159
0.432
0.781
0.004
0.014
0.143
Max
0.406
0.382
1.251
1.251
0.033
0.041
0.224
Mean
0.236
0.264
0.811
1.078
0.012
0.024
0.191
Min
0.049
0.129
0.250
0.644
0.001
0.012
0.090
Max
0.332
0.265
0.993
1.221
0.041
0.049
0.198
Mean
0.142
0.186
0.646
1.038
0.009
0.020
0.145
Dissolved oxygen was measured twice a day at two depths: 5 cm below the water surface (DOS) and 5 cm above the sediment (DOB). Flow velocity was measured with an intelligent velocity instrument LGY-II, provided by the Nanjing Hydraulic Research Institute, China. Samples for turbidity were taken daily from 25 cm below the water surface and were immediately analyzed using a turbidity meter (2100n, HACH). Nutrients were sampled every other day. Water samples (500 mL) were taken from 25 cm below the water surface, immediately transported to the laboratory, filtered through 0.45-μm cellulose acetate membrane filters and then analyzed. Ammonia (NH+4-N), nitrate (NOˉ3-N), dissolved total nitrogen (DTN), soluble reactive phosphorus (SRP), and dissolved total phosphorus (DTP) levels were analyzed spectrofluorometrically (Huang, 1999). Total nitrogen (TN) and total phosphorus (TP) levels were analyzed spectrofluorometrically from unfiltered water samples. Phytoplankton biomasses, calculated as the chl-a concentrations, were measured using a hot-ethanol extraction and spectrofluorometric method (Chen et al., 2006). Three replicate samples were taken from each enclosure for nutrient and chl-a analysis. The abundances of phytoplankton groups were calculated using the Olympus CX21 System Microscope and taxa were classified according to the “Freshwater Microorganisms Atlas”, edited by Zhou and Chen (2005). Five liters of water were filtered in situ through a phytoplankton net (64 μm) during the observations in Zhongxin Lake. The samples were
fixed and concentrated by sedimentation for assistance in taxonomic identification.
3 RESULT 3.1 Environmental variables analysis The nutrient levels in all of the flowing enclosures were a little higher than in the still (control) enclosure, as shown in Table 1. The control enclosure had similar nutrient levels to the ambient water. There was no significant correlation between nutrient levels and chl-a concentration in the enclosures, while in Zhongxin Lake the changes in TN and TP were closely related to chl-a concentration. The results indicate that nutrient availability was not controlling the growth of phytoplankton in the enclosures. Water temperature ranged from 16.0 to 23.7°C (Fig.1). All of the enclosures and Zhongxin Lake showed slightly alkaline conditions, with pH of 7.31– 8.44. Conductivity increased over time, from 983– 1 080 μs/cm. There was no significant difference in water temperature, pH, and conductivity between the enclosures and Zhongxin Lake. Under control conditions, only the surface layer exchanges gas with the atmosphere and therefore DO concentrations in the surface layer were much higher than in the bottom layer (Fig.2). There was a dramatic decrease in DO concentrations (1.82–2.1 mg/L) in the bottom layer from May 3 to May 9, while DO concentrations in the surface layer remained at a relatively high level. The increased temperature during this period may have
No.2
ZHANG et al.: Effects of flow rate on environmental variables and phytoplankton dynamics
433
8.6 24
22
8.2
21 8 20
pH
Temperature (°C)
E0 E1 E2 E3 W2
8.4
23
7.8
19 18
7.6
17 7.4
16
7.2 135
15 1090 1080
120 105
1060 Turbidity (NTU)
Conductivity (µs/cm)
1070
1050 1040 1030 1020 1010
90 75 60 45
1000 30
990 980
D2 D3 D4 D5 D6 D7 D8 D9 D11 D12 D13 D14 D15 D16 D17 D18 D19 D20 D21 D22 D23 D24 D25
D2 D3 D4 D5 D6 D7 D8 D9 D11 D12 D13 D14 D15 D16 D17 D18 D19 D20 D21 D22 D23 D24 D25
15
Fig.1 Daily values of the physical variables in the enclosures and in Zhongxin Lake between April 27 and May 20, 2010
For most of the experiment period, a higher phytoplankton biomass was observed in the still water enclosure compared with the three flowing enclosures and the lake (Fig.3). The average chl-a concentration during the entire experiment period was 35.64 μg/L in the still enclosure, 20.3%–36.7% higher than in the three turbulent enclosures. From May 10 to May 17, phytoplankton experienced favorable growth conditions with sunny, calm days and a continuous
E0
E1
E2
E3
W2
DOS
8 6 4 2 0 12 10
DOB
8 6 4 2 0 D2 D3 D4 D5 D6 D7 D8 D9 D11 D12 D13 D14 D15 D16 D17 D18 D19 D20 D21 D22 D23 D24 D25
3.2 Phytoplankton biomass variation
12 10
DO (mg/L)
been caused the observed decline in DO. Under flowing conditions, DO concentrations varied slightly from the surface layer to the bottom layer, owing to pump agitation. High turbidity can reduce the photosynthetic intensity of phytoplankton in a water body. We observed that water flow had a significant effect on turbidity, with the turbidity in the flowing enclosures nearly 2 times higher (around 81.7 NTU) than in the still enclosures, and 1.5 times higher than in Zhongxin Lake. There was no significant difference in turbidity among the flowing enclosures.
Fig.2 Daily concentrations of DO in the enclosures and in Zhongxin Lake during between April 27 and May 20, 2010
temperature rise. As a result, chl-a concentration peaked on May 17 at 33.89, 51.58, 45.2, and 81.33 μg/L under the flow rate conditions of 0.10, 0.06, 0.03, and 0 m/s, respectively. These results show the clear inhibitive effects of water flow on phytoplankton biomass.
434
CHIN. J. OCEANOL. LIMNOL., 33(2), 2015
Vol.33
Table 2 Correlations of chl-a and each physical factor in the still and flowing enclosures Chl-a
Temperature
pH
1
0.138
-0.095
1
Conductivity
Turbidity
DOS
DOB
0.559b
0.100
0.091
0.114
-0.352
0.362
-0.066
-0.686b
-0.544b
1
-0.559
-0.474
b
0.729
0.617b
0.462a
-0.264
-0.044
1
-0.329
-0.307
1
0.943b
Still enclosure (n=23) Chl-a Temperature pH Conductivity
b
1
a
Turbidity DOS
1
DOB Flowing enclosure (n=69) Chl-a
1
Temperature
-0.258a
0.394b
0.076
0.150
0.528b
0.514b
1
-0.628b
0.606b
0.499b
-0.736b
-0.743b
1
-0.689b
-0.290a
0.891b
0.892b
1
0.611
b
-0.605
-0.612b
1
-0.330b
-0.335b
1
0.999b
pH Conductivity
b
Turbidity DOS
1
DOB : Correlation is significant at the 0.05 level; b: correlation is significant at the 0.01 level.
a
Chl-a (µg/L)
70
30 25 20 15
60 50 40
10 5 0
E0
E1
E2
E3
W2
30 20
60
Relative inhibitory rate (%)
80
E0 E1 E2 E3 W2
35
Average chl-a concentration
90
50 40 30 20 10
D1 D2 D3 D4 D5 D6 D7 D8 D9 D11 D12 D13 D14 D15 D16 D17 D18 D19 D20 D21 D22 D23 D24 D25
10
Fig.3 Average concentrations and daily values of chl-a under different flow rates
During still conditions, only conductivity showed a positive relationship with chl-a concentration (R=0.559, n=23, P≤0.01) (Table 2). In flowing enclosures, however, chl-a and conductivity were not significantly correlated, and chl-a showed a negative relationship with temperature (R=-0.258, n=69, P≤0.05) and positive relationships with pH and DO in the surface and bottom layers (R=0.559, 0.528, and 0.514, respectively, n=69, P≤0.01). The results indicated that the continuous flow in the flowing flumes might enhance the relationships among all of the physical factors. There was a significant negative relationship between DO (both in the surface and bottom layer) and water temperature, conductivity
0 0.03
0.06
0.1 Flwo rate (m/s)
0.15
0.3
Fig.4 Relative inhibitory rate of phytoplankton biomass under different flow rates
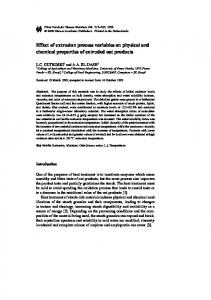
and turbidity. To demonstrate the inhibitory effect of flow on phytoplankton biomass, the relative inhibitory rate was calculated, which refers to the ratio of average chl-a concentration in the flowing enclosure to its corresponding rate in the still enclosure, expressed as a percentage. The flow rate of 0.15 m/s had the highest inhibitory effect of 54.0% (Fig.4). The inhibitory effect of a flow rate of 0.06 m/s was relatively less significant, with the highest average periphyton biomass of 40.49 mg/m2 also observed in this enclosure.
No.2
ZHANG et al.: Effects of flow rate on environmental variables and phytoplankton dynamics
435
Table 3 Variations in dominant phytoplankton species in the still and flowing enclosures Still enclosure (E0)
Flowing enclosures (E1, E2, and E3)
Before runninga
Blue-green algae (Microcystis, Merismopedia), greens (Ankistrodesmus), diatoms (Melosira, Cyclotella)
Blue-green algae (Microcystis, Merismopedia), greens (Ankistrodesmus), diatoms (Melosira, Cyclotella)
D3
Blue-green algae (Microcystis, Merismopedia), diatoms (Melosira, Cyclotella)
Blue-green algae (Merismopedia), diatoms (Melosira, Cyclotella)
D9
Blue-green algae (Microcystis, Merismopedia), greens (Ankistrodesmus), diatoms (Cyclotella)
Greens (Ankistrodesmus, Schroederia Lemmermann)
D15
Blue-green algae (Microcystis), greens (Schroederia Lemmermann), diatoms (Cyclotella)
Greens (Ankistrodesmus, Schroederia Lemmermann)
D20
Greens (Ankistrodesmus, Schroederia Lemmermann), diatoms (Cyclotella)
Greens (Schroederia Lemmermann), diatoms (Melosira)
D24
Blue-green algae (Microcystis), greens (Schroederia Lemmermann), diatoms (Melosira, Cyclotella)
Greens (Schroederia Lemmermann), diatoms (Melosira)
: Dominant phytoplankton species in April 24, 2010.
a
E0 E1 E2 E3
60
Average concentration (mg/m2)
Concentration (mg/m2)
70
50 40 30 20
120
Periphyton Phytoplankton
40
110 30
100 90
20
80
10
Average chl-a concentration (µg/L)
80
70
10 0 E0
0 D7
D15
D18
D22
Fig.5 Periphyton biomass in the enclosures during the observation period
3.3 Phytoplankton species interaction There was no significant difference in phytoplankton composition under the different flow rates. In the initial stage of the experiment, blue-green algae accounted for nearly 60% and diatoms for more than 40% of the total phytoplankton biomass (Table 3). After 9 days, the blue-green algae disappeared and green algae (Chlorophytes) dominated. In the final 5 days, the green algae accounted for nearly 55% and the diatoms for 45% of the total algal species. However, the variation of phytoplankton composition is quite different in the still-water conditions where the blue-green algae survived for most of the experimental period. 3.4 Competition with periphyton Periphyton (dominated by Spirogyra) played an important role in these enclosures. Under the flow rates of 0.15 and 0.30 m/s, Spirogyra biomasses were 2.3 and 31.3 times the biomasses under still conditions,
E1
E2
E3
Fig.6 Periphyton and phytoplankton biomass in enclosures
respectively. Periphyton biomass showed a slow increment under still conditions, and remained at a low concentration, below 5.0 mg/m2, during the observation period (Fig.5). After 15 days, periphyton biomass in the flowing enclosures increased significantly. The enclosure with a flow rate of 0.10 m/s had a peak biomass (60.64 mg/m2) after 15 days and subsequently dropped to 37.27 mg/m2. The periphyton biomass in the other two flowing enclosures showed a continuous increase, peaking after 22 days (75.22 and 64.95 mg/m2 for flow rate of 0.06 m/s and 0.03 m/s, respectively). Compared with the still water condition, flowing conditions will lead to decrease in phytoplankton abundance and increase in periphyton abundance (Fig.6).
4 DISCUSSION The results indicate that a flow rate of 0.06 m/s had the most favorable environment for biotic growth, and thus a critical flow rate may exist near 0.06 m/s. When the flow rate exceeded the threshold value, there was a reduction in chl-a concentration and the
436
CHIN. J. OCEANOL. LIMNOL., 33(2), 2015
loss of phytoplankton biomass. The critical flow rate from the current study is consistent with Mitrovic et al.’s (2003) field observations, which gave a value of 0.05 m/s. However, it is a little higher than the 0.03 m/s derived from laboratory experiments with water from the Jialing River in the spring by Liu and Zhang (2008), and 0.04 m/s, a model validation result by Long et al (2011). The results from the present study, which are based on natural waters, are significantly different from laboratory studies (Zhang et al., 2007). This study indicates that the large difference results from the many environmental factors that influence conditions in natural waters, which are usually precisely controlled in laboratory studies. In the present study, flow rates not only significantly enhanced the inter-relationships among environmental variables, they also shifted the competitive balance between periphyton and phytoplankton species. These variables may all affect the critical flow rate. It was noted that the relative inhibitory rate decreased markedly under a 0.30 m/s flow rate. Zooplankton biomasses were only 6% under this intensive flow rate, compared with still conditions, while they were 27% and 38% under 0.15 m/s and 0.10 m/s flow rates compared with the still conditions (Zhu et al., 2010). The grazing rate of zooplankton may be depressed under high flow conditions, a phenomenon also observed in other studies (Visser et al., 2002). Moreover, the effect of flow rate on phytoplankton biomass may be altered by dramatic weather changes (e.g., temperature, light and precipitation), which may significantly affect the growth of phytoplankton in confined enclosures. In natural waters, the effect of flow rate on phytoplankton dynamics may be affected by many other environmental variables, such as the water body size, morphology, nutrient level, water temperature, light intensity, and species composition (Ellott et al., 2010; Li et al., 2013). The results of this study imply that a universal critical flow rate for natural freshwater bodies probably does not exist, owing to difference in these influencing factors. The present study found that the blue-green algae were often replaced by chlorophytes as the dominant species in the flowing enclosures. Competition experiments in light-limited chemostats have confirmed the interplay between blue-green algae and chlorophytes (Huisman et al., 1994), demonstrating that competition for light appears to be the key factor determining changes in phytoplankton community
Vol.33
structure (Huisman et al., 2004). In the current study, the PVC enclosures formed light-limited environments compared with ambient waters. Alterations in water flow shift the competitive balance in phytoplankton communities. For example, under still conditions, buoyant phytoplankton species (e.g., most blue-green algae) may float upwards and enhance their own access to light. Conversely, under flowing conditions, high turbidity can result from the continuous water flow, leading to a reduction in underwater light intensity. Furthermore, shear stress may forcefully bring the blue-green algae to the light-limited area. All of these factors may cause the blue-green algae to lose their competitive advantage. Meanwhile, sinking species, such as most greens and diatom algae, depend on continuous circulating flow, and are thus able to gain better vertical positions in the light gradient.. Direct competition has been demonstrated between periphyton and phytoplankton in many studies (Allan et al., 2007; Ahn et al., 2013). Hansson (1988) demonstrated that periphytic algae have a competitive advantage in obtaining nutrients released from sediments in flowing conditions. In the present study, nutrient levels did not vary significantly throughout the whole environment. In these enclosures, Spirogyra grew well, and thus about half of the water surface was dominated by Spirogyra. As a result, these periphyton enhanced their access to light while shading phytoplankton species. It is therefore concluded that the shading effect of periphyton might be the limiting factor for phytoplankton growth in the flowing enclosures. All of these results demonstrate that flow rates can significantly stimulate periphyton growth. Furthermore, the shear stress generated by high water flow increases the breaking of Spirogyra, favoring their vegetative reproduction (Zhu et al., 2010).
5 CONCLUSION The field enclosure experiments have shown a clear inhibitive effect of water flow on phytoplankton biomass. The flow rate of 0.15 m/s had the highest relative inhibitory rate of 54.0%. A critical flow rate may exist near 0.06 m/s, which has the lowest relative inhibitory rate of 18.9%. All of the enclosure experiments demonstrated that changes in the flowing environment were often accompanied by a shift in dominance from blue-green algae in still water to green algae under flowing conditions. The effect of flow rate on the growth of phytoplankton and their species interaction may be associated with many other environmental variables. Water flow causes
No.2
ZHANG et al.: Effects of flow rate on environmental variables and phytoplankton dynamics
high turbidity and increases periphyton growth. Such shading effects may lead to a reduction in underwater light intensity, which consequently inhibits the photosynthetic intensity of phytoplankton. Competition for light appears to be a key factor determining the changes in phytoplankton community structure. These findings could be applied in surface water management, improving predictions of the flow rate required to inhibit an increase in phytoplankton biomass and thus prevent surface blooms of harmful algae (e.g. cyanobacteria).
6 ACKNOWLEDGEMENT We thank the Chongming Water Environmental Laboratory for providing assistance on the field survey. References Abraham E R, Law C S, Boyd P W et al. 2000. Importance of stirring in the development of an iron-fertilized phytoplankton bloom. Nature, 407: 727-730. Ahn C H, Song H M, Lee S et al. 2013. Effects of water velocity and specific surface area on filamentous periphyton biomass in an artificial stream mesocosm. Water, 5: 1 723-1740. Allan J D, Castillo M M. 2007. Stream Ecology: Structure and Function of Running Waters (2 edn). Springer Verlag. Basu B K, Pick F R. 1996. Factors regulating phytoplankton and zooplankton biomass in temperate rivers. Limnol. Oceanogr., 41: 1 572-1 577. Bornette G, Puijalon S. 2011. Response of aquatic plants to abiotic factors: a review. Aquatic Sciences, 73: 1-14. Chen Y W, Chen K N, Hu Y H. 2006. Discussion on possible error for phytoplankton chlorophyll-a concentration analysis using hot-ethanol extraction method. Journal of Lake Science, 18: 550-552. (in Chinese with English abstract) Desortova B, Puncochar P. 2011. Variability of phytoplankton biomass in a lowland river: response to climate conditions. Limnologica, 41: 160-166. Elliott J A. 2010. The seasonal sensitivity of Cyanobacteria and other phytoplankton to changes in flushing rate and water temperature. Global Change Biol., 16: 864-876. Gao Y X, Zhang Y M, Zhang Y C. 2007. Effects of flow velocity on growth of Microcystis aeruginosa in Taihu Lake. Journal of Ecology and Rural Environment, 23: 57. (in Chinese with English abstract) Gulati R D, van Donk E. 2002. Lakes in the Netherlands, their origin, eutrophication and restoration: state-of-the-art review. Hydrobiologia, 478: 73-106. Hansson L A. Effects of competitive interactions on the biomass development of planktonic and periphytic algae in lakes. Limnol. Oceanogr., 33: 121-128. Hondzo M, Warnaars T A. 2008. Coupled effects of small-
437
scale turbulence and phytoplankton biomass in a small stratified lake. J. Environ. Eng.-ASCE, 134: 954-960. Huang W, Liu X, Chen X et al. 2011. Critical flow for water management in a shallow tidal river based on estuarine residence time. Water Resources Management, 25: 2 3672 385. Huang X F. 1999. Analysis and Ecological Investigation of Lake. Standards Press, Beijing. (in Chinese) Huang Y L, Liu D F, Chen M X. 2008. Simulation of algae bloom under different flow velocity. Journal of Applied Ecology, 19: 2 293-2 298. (in Chinese with English abstract) Hudnell H K, Jones C, Labisi B et al. 2010. Freshwater harmful algal bloom (FHAB) suppression with solar powered circulation (SPC). Harmful Algae, 9: 208-217. Huisman J, Sharples J, Stroom J M et al. 2004. Changes in turbulent mixing shift competition for light between phytoplankton species. Ecology, 85: 2 960-2 970. Huisman J, Weissing F J. 1994. Light-limited growth and competition for light in well-mixed aquatic environments—an elementary model. Ecology, 75: 507520. Leland H V. 2003. The influence of water depth and flow regime on phytoplankton biomass and community structure in a shallow, lowland river. Hydrobiologia, 506: 247-255. Li F P, Zhang H P, Zhu Y P et al. 2010. Spatial and temporal dynamics in the relationship of phytoplankton biomass and limnological variables in a small artificial lake. AIP Conf. Proc., 1251: 29-32. Li F P, Zhang H P, Zhu Y P et al. 2013. Effect of flow velocity on phytoplankton biomass and composition in a freshwater lake. Sci. Total Environ., 447: 64-71. Li J, Li D X, Wang X K. 2012. Three-dimensional unstructuredmesh eutrophication model and its application to the Xiangxi River, China. Journal of Environmental SciencesChina, 24: 1 569-1 678. Liu X A, Zhang M F. 2008. Behavior of evolution and growth of dominant algae in the Chongqing Urban Section along the Three-Gorges Valley. Environmental Science, 29: 1 838-1 843. (in Chinese with English abstract) Long T Y, Wu L, Meng G H et al. 2011. Numerical simulation for impacts of hydrodynamic conditions on algae growth in Chongqing Section of Jialing River, China. Ecological Modelling, 222: 112-119. Lucas L V, Thompson J K, Brown L R. 2009. Why are diverse relationships observed between phytoplankton biomass and transport time? Limnol. Oceanogr., 54: 381-390. Malits A, Peters F, Bayer-Giraldi M et al. 2004. Effects of small-scale turbulence on bacteria: a matter of size. Microbial Ecol., 48: 287-299. Mitrovic S M, Hardwick L, Dorani F. 2011. Use of flow management to mitigate cyanobacterial blooms in the Lower Darling River, Australia. J. Plankton Res., 33: 229241. Mitrovic S M, Oliver R L, Rees C et al. 2003. Critical flow velocities for the growth and dominance of Anabaena circinalis in some turbid freshwater rivers. Freshwater
438
CHIN. J. OCEANOL. LIMNOL., 33(2), 2015
Biology, 48: 164-174. Nilsson C, Renofalt B M. 2008. Linking flow regime and water quality in rivers: a challenge to adaptive catchment management. Ecol. Soc., 13: 18. Paerl H W, Huisman J. 2008. Blooms like it hot. Science, 320: 57-58. Paerl H. 2008. Nutrient and other environmental controls of harmful cyanobacterial blooms along the freshwatermarine continuum. Cyanobacterial Harmful Algal Blooms: State of the Science and Research Needs. p.217237. Qiu G S, Hu S, Ye D et al. 2011. Investigation on the present situation of eutrophication and water bloom in the branches of Three Gorges Reservoir. Resources and Environment in the Yangtze Basin, 20: 311-316. (in Chinese with English abstract) Reynolds C. 2000. Hydroecology of river plankton: the role of variability in channel flow. Hydrol. Process, 14: 3 1193 132. Ryan N J, Dabovic J, Bowling L D et al. 2009. The Murray River algal bloom: evaluation and recommendations for the future management of major outbreaks. NSW Office of Water. Salmaso N, Braioni M. 2008. Factors controlling the seasonal development and distribution of the phytoplankton community in the lowland course of a large river in Northern Italy (River Adige). Aquatic Ecology, 42: 533545. Uhlmann D. 1971. Influence of dilution, sinking and grazing rate on phytoplankton populations of hyperfertilized ponds and microecosystems. Mitt. Int. Ver. Theor. Angew. Limnol, 19: 100-124. Van Vliet M, Zwolsman J. 2008. Impact of summer droughts on the water quality of the Meuse River. J. Hydrol., 353: 1-17. Visser A W, Stips A. 2002. Turbulence and zooplankton production: insights from PROVESS. J. Sea Res., 47:
Vol.33
317-329. Wang H P, Xia J, Xie P et al. 2004. Mechanisms for hydrological factors causing algal blooms in Hanjiang River—based on kinetics of algae growth. Resources and Environment in the Yangtze Basin, 13: 282-285. (in Chinese with English abstract) Wetzel R G. 2001. Limnology: Lake and River Ecosystem (3rd edn). Academic Press, San Diego. Wu T F, Qin B Q, Zhu G W et al. 2013. Dynamics of cyanobacterial bloom formation during short-term hydrodynamic fluctuation in a large shallow, eutrophic, and wind-exposed Lake Taihu, China. Environmental Science and Pollution Research, 20: 8 546-8 556. Xie P, Xia J, Dou M et al. 2004. Research into the effects of the middle route of China’ south-to-north water transfer project on water bloom in the middle-down stream of Hanjiang River and the countermeasures Part I: an analysis of the key factors generating water bloom in Hanjiang River. Journal of Natural Resources, 19: 418423. (in Chinese with English abstract) Zhang Y M, Zhang Y C, Zhang L J et al. 2007. The influence of lake hydrodynamics on blue algal growth. China Environmental Science, 27: 707-711. (in Chinese with English abstract) Zhou F X, Chen J H. 2005. Freshwater Microorganisms Atlas. Beijing: Chemical Industry Press. Zhu G W, Qin B Q, Gao G et al. 2007. Effects of hydrodynamics on phosphorus concentrations in water of Lake Taihu, a large, shallow, eutrophic lake of China. Hydrobiologia, 581: 53-61. Zhu Y P, Zhang H P, Li F P et al. 2010. Enclosure experiments about the hydrodynamics effects on the plankton. Environmental Science, 31: 69-75. (in Chinese with English abstract) Zwolsman J, Van Bokhoven A. 2007. Impact of summer droughts on water quality of the Rhine River: a preview of climate change? Water Sci. Technol., 56: 45-55.