(200 or 300 sec plus a small variable amount) ITls. Bar- ... the US (Gibbon & Balsam, 1981; Jenkins, 1984; Jenkins et al., 1981). ...... rat of a CS-food association, although it can reset its meas- uring of the m. ... by 10-sec TI'ls [t(6) = 4.7, P < .05].
Animal Learning de Behavior 1988, 16 (3), 340-353
Effect of intertrial interval on variable-interval discrete-trial barpressing MARK D. HOLDER Memorial University of Newfoundland, Newfoundland, Canada and SETH ROBERTS University of California, Berkeley, California In seven experiments, an effect of the intertrial interval UT!) duration on barpressing by rats was studied. A stimulus signaled a I5-sec variable-interval trial. The first response after the interval elapsed turned the stimulus off and was rewarded with food. Trials were separated by long (about 300 sec) or short (about 10 sec) ITIs. A within-subjects design established that response rate on trials after long ITIs was lower than that after short ITIs (Experiments I and 3-7). The effect was not cumulative (the effect of one and five consecutive short ITIs was the same). Response rate after short and long ITIs was the same when a between-subjects design was used (Experiment 2). Response rate was higher after I60-sec ITIs than after 300-sec ITIs, suggesting that the ITI duration at which all longer ITIs are treated the same (i.e., the upper limit) is greater than 160 sec (Experiment 3). When food, the trial stimulus, a novel stimulus, or a familiar stimulus never paired with food, was presented 10 sec before the next trial during some of the long ITIs, response rate on the next trial was similar to that found after 10-sec ITIs (Experiments 4-6). This similarity suggested that these events could mark the start of the ITI. However, the familiar stimulus did 80 only when it reliably predicted that the next trial would occur after a short interval. The effect of ITI duration on responding was apparently attributable to response latency. Response latency was greater after long ITIs, but once responding began, it was similar after long and short ITIs (Experiment 7). Several studies have shown that animals are sensitive to durations of intervals between trials. For example, in habituation studies, trials separated by relatively short durations produce faster habituation during acquisition and faster extinction in subsequent nonreinforced periods than do trials separated by relatively long durations (Davis, 1970). In studies of spontaneous recovery, a long intertrial interval (IT!) during the extinction phase produces more responding than a short m (Peeke & Peeke, 1972). The role of the IT! in autoshaping has been extensively studied, and it has been found that, in general, decreasing the IT! increases the number of trials until the first conditioned response is observed (e.g., Gibbon, Baldock, Locurto, Gold, & Terrace, 1977; Terrace, Gibbon, Farrell, & Baldock, 1975). Studies of behavioral contrast have found that as the IT! increases, or as the duration of a nonreinforced stimulus increases, responding durThis work was supported by National Science Foundation Grant BNS 79-00839 and National Institute of Mental Health Grant I Rot MH383358~1. Mark Holder held a postgraduate fellowship from the Natural Sciences and Engineering Research Council of Canada while he conducu:d the research and was supported by NSERC Grant Al221 during some of the preparation of the manuscript. The authors thank Peter Killeen for his encouragement and helpful comments. All correspondence should be sent to Mark Holder, Department of Psychology, Memorial University of Newfoundland, St. John's, Newfoundland AlB 3X9, Canada.
Copyright 1988 Psychonomic Society, Inc.
ing a reinforced stimulus increases (Bloomfield, 1967; Taus & Hearst, 1970; Wilton & Clements, 1971). The effect of the IT! is not limited to a specific procedure, species, or dependent measure. For example, Stein, Sidman, and Brady (1958) found that when the m was increased, conditioned suppression, as measured by barpressing, increased. Other examples of increases in performance following increases in the IT! include tasteaversion learning in rats (Domjan, 1980) and running responses in rats (Rothkopf, 1955). Different theories have been employed to explain the increase in responding after increases in the m. One theory, developed by Amsel and Roussel (1952), was based on frustration, and was used by Amsel (1967) to explain increased responding in behavioral contrast. The effect of the IT! could be similarly explained (Mackintosh, Little, & Lord, 1972). Increases in the m, a period of no reinforcement, increase frustration and result in an unconditioned increase in responding. A second group of theories was designed to account for the m effect in autoshaping (Gibbon & Balsam, 1981; Jenkins, Barnes, & Barrera, 1981). These theories assume that the overall time between unconditioned stimuli (USs) is measured by animals and compared with the time between USs during the conditioned stimulus (CS). This comparison determines performance. As the overall time between USs decreases, performance decreases.
340
EFFECT OF ITI ON BARPRESSING
341
The present experiments employed trials separated by the most recent ITI, then responding should be the same short (10 or. 20 sec plus a small variableamount)and long on all trials precededby I'Flsof the same duration, regard(200 or 300 sec plus a small variable amount) ITls. Bar- less of the duration of earlier ITls. pressing was measured as a function of the duration of the preceding m. In all sevenexperiments, rats were rein- Method forced with food for pressing a bar on a variable-interval Subjects and Apparatus. The subjects were 8 albino male rats schedule of 15 sec during discrete trials signaled by light (Charles River CD, born in the U.c. Berkeley laboratory colony), or sound. These experiments were designed to demon- about 110 days old at the start of the experiment. All rats had had strate an ITI effect with a new procedure, and to exam- extensive prior experience (Holder & Roberts, 1985, Experiment 2) ine some of the factors that underlie this effect. If perfor- with a procedure involving instrumental trials (2Q-sec fixed-interval, discrete trials) intermingled with classical conditioning trials (formance increases as the duration of the nonreinforced ITI ward pairing, backward pairing, and extinction trials). Throughincreases (Amsel & Roussel, 1952; Gibbon & Balsam, out the experiment, after eaeh daily session, each rat was fed 13 g 1981; Jenkins et al., 1981), barpressing rates should be of Purina Rat Chow mixed with water. A 12:12-h light:dark cycle higher after longer I'Fls. Of course, the theoriesdiscussed was maintained in the animal colony. Sessions began at 12:45 a.m., above were developed to explain data from procedures during the middle part of the dark phase of the cycle. The rats worked in eight similar lever boxes located in a separate that differed in several ways from those used here. Some room adjacent to the animal colony. The dimensions of four of the studies that used procedures roughly similar to those used boxes were 23 x 20 x 21 ern; those of the remaining four were here have reported an inverse relationship between the 23 x 20 x 28 ern. The floor consisted of 17 or 18 parallel stainrate of responding and the time since the last reinforcer. less steel bars. The roof and the side walls were acrylic; the front For example, Allen (1980) found that the general activity and back walls were aluminum. Each box contained a stainless steel of thirsty pigeons was greatest immediately after 50-sec lever on the front wall. The lever, which measured 5 x I em, access to water, and that this activitydecreasedover time. projected 1.5 cm into the box, 8 em above the floor. The front lip the lever was rounded. The force needed to depress the lever Killeen, Hanson, and Osborne(1978)found similar results of was 15 g. A pellet dispenser (various manufacturers) delivered the with hungry pigeons and food. These results have been food reinforcement (one 45-mg sugar pellet, Bio Serv Mix TlOI) explained by theories based on arousal or incentives to a food tray beneath and to the side of the lever on the front wall. (Killeen, 1979, 1982). Basically, reinforcers increase A small lamp (General Electric 1155X) mounted on the roof of each arousal levels, which in tum increase behavior. This box was the light stimulus. The sound stimulus was a broad-band arousal decays over time. After reinforcement, increases increase in the noise level from 65 to 69 dB (A scale) produced in a variety of behaviors (e.g., gnawing, eating, keypeck- by a speaker located behind the back wall of each box. Each box contained a ventilation fan that helped mask outside noise. A coming, and copulation) have been found in a variety of puter controlled the experimental events, recorded the data, and, animals (e.g., rats, pigeons, cows, and humans) (see every 100 msec, checked the microswitch. A response was recorded Killeen, 1979, p. 34). when the micros witch was closed (lever down) and then opened EXPERIMENT 1 BASIC EFFECT OF m DURAnON ON BARPRESSING Experiment 1 was designed to determine the effects of differentdurationsof m on barpressing. Responding during a trial was measured as a function of the five preceding ITls. Conditioning theories that account for m effects in autoshaping claim that performance is determined by the average of several preceding I'I'Is, rather than by only the immediately preceding feeding and the onset of the US (Gibbon & Balsam, 1981; Jenkins, 1984; Jenkins et al., 1981). For example, if the average of several preceding ITls is 60 sec, but the immediately preceding ITI was 15 sec, then performance, which is little affected by the single 15-sec ITI, can be predicted by the average 6O-sec m. The arousaltheorydescribedby Killeen(1979, 1982)also claimsthat performanceis a function of several preceding ITls. On the other hand, frustration theory can explain contrast effects resulting from a single ITI. By measuring respondingas a function of the five most recentI'I'ls, Experiment 1 coulddetermineif animalswere sensitive only to the most recent ITI, or if they were sensitive to an average of several ITIs, including the most recent. For example, if responding is governed by only
(lever up). Procedure. All rats were given training on a discrete-trials, variable-interval schedule signaled by light for half the rats and by sound for the other half. Once each trial started (i.e., the light or sound came on), food was primed (i.e., the next response was reinforced) with a probability of .066 every I sec. After food was primed and the rat made a response, the rat was given a single pellet of food and the light or sound was turned off. The l11s were either short or long, and each duration was equally likely and selected randomly. Short and long Tl'ls were initially a minimum of 20 and 200 sec, respectively (Days 1-3), but were later changed to a minimum of 10 and 300 sec (Days 4-24). After this minimum duration, a small random duration was added to each 111. Each random duration ended, and the next trial began, with a probability of .05 (Days 1-3) or .2 (Days 4-24) every second. Although thelTIs were 10 and 300 sec plus this small random duration, for conciseness they are referred to as the lO-sec 111 and the 3OO-sec m, respectively, in this and all subsequent experiments. The small random addition was employed so that the rats could not precisely predict when the next trial would begin. The sessions lasted either 4 h (Days 1-3) or 5 h (Days 4-24). The rats were placed in the experimental cages about 6 h prior to the start of each session, and were removed about 3 h after each session. Data taken. The duration of each trial before food was primed and the number of responses on each trial before food was primed were recorded. To minimize the effect of behaviors that were not of central concern to this study (e.g., if a rat fell asleep during a session, then the subsequent absence of responding could at most only affect the recorded duration of one trial until food was primed), only data obtained prior to the priming of food were recorded. Trial
342
HOLDER AND ROBERTS
duration and responding were recorded as a function of the duration of the five preceding ms. For example, total responses and trial duration were recorded separately for trials preceded by the m sequenceshort-long-long-long-short. Therefore, each trial was categorized as one of 32 possible types. In addition, the response rate during the variable part of the m was recorded. To minimize the role of warm-up effects, data were not collected from the first 10 trials of each session. Data analysis. For each rat, an average response rate for a given trial or set of trials was calculated by dividing the total number of responses made for a trial type over days by the total duration of those trials. For example, consider the first 3 days of this experiment, when trials were separated by 2o-sec and 2oo-sec I'I'ls. If, on trials preceded by five consecutive short ITIs, a rat made 20, 30, and 25 responses on 3 days, respectively, and the total durations of these trials were 40, 60, and 50 sec, respectively, then the rat's response rate for these days would be .5 resp/sec (20 + 30 + 25 = 75 responses, 40 + 60 + 50 = 150 sec, 75 resp/150 sec = .5 resp/sec). Averages over all rats, for each phase, are biweights of the average for each rat with a weighting constant of 9 iterated 6 times (for a description and justification of the biweight, see Mosteller & Tukey, 1977). Analyses of variance (ANOVAs) treated the rat as a random factor and the other factors as fixed. Tests of significance were based on the square root of the averageof each rat's responserate. Squareroot transforms were chosento help normalizethe data. All p values are two-tailed.
/.--.....-./•
20
"2
'E 3.02, ps < .05]. Intermediate !TIs
Baseline
•
/
£
E
h>« - ·r I: 0-
m
0"'0,
r
32
.I'
I' 1('
c
a::
16
It• 1\.,.1...•• If 10" t> I ......!
~,
4.2, ps < .005]. The most important new finding was that response rates on trials 10 sec after the familiar stimulus were similar to rates after Io-sec IFls only during the Predictive 1 and 2 phases. During the Less predictive phase, the response rate on trials 10 sec after the familiar stimulus was less than the responserate after Io-sec If'ls, These results are summarized in Table 1. Ouring the Predictive 1 and 2 phases, a reinforcedtrial always followed the familiar stimulus within about 10 sec. The effect of the now familiar stimulus was similar to its effect when it was novel in Experiment 5. The response rate after the familiar stimulus was the same as the response rate after the Io-sec m [t(6) < 1], but greater than the response rate after the 300-sec m [t(6) = 3.9, p < .01]. During the familiar stimulus, the rats rarely pressedthe bar; the response rate wasless than 1 resp/min for all rats. During the Less predictive phase, the response rate on trials 10 sec after the familiar stimulus was now reliably less than the response rate after Io-sec I'Fls [t(6) = 4.3, p > .01] and stillgreater than the response rate after 300sec rns [t(6) = 4.0, P < .01]. Results The response rate on trials 10 sec after the CS alone Figure 6 shows that the basic effect remained: the was always high. During both the less predictive and responserate during each phase was higher following 10- predictive 2 phases, the response rate after CS ITIs 10 sec
350
HOLDER AND ROBERTS Table I
Experiment 6: Rates (resp/min) as a FUDctionof the Preceding m
Preceding m
lO sec
300 sec
Familiar (lO sec)
CS (lO sec)
Mean SE Mean SE Mean SE Mean SE Predictive Days 1-8
35.7
7.6 27.0 5.8 34.7 7.9
Less Predictive Days 21-56
41.8
9.1 36.3 8.1 39.6 8.6 45.4
lO.O
Predictive Days 66-74
43.3
lO.2 36.1 9.4 42.9 9.8 45.6
lO.8
Note-Values are biweights across the average response rates for the lO rats. Response rates were calculated by separately adding across the indicated days the total responsesduring all trials preceded by each type of m and dividing by the total cumulative duration of the trials. The column labeled lO sec refers to trials preceded by Io-sec I'l'Is, 300 sec refers to trials precededby 300-sec ms, Familiar(10 sec) refers to trials preceded 10 sec earlier by the familiar stimulus, and CS (10 sec) refers to trials preceded lO sec earlier by the CS alone.
before the next trial was alwaysgreater than the response rate after 10-sec rns [t(6) > 2.74, P < .05].
Discussion
Once again, the basic result that the response rate is higher on trials preceded by to-sec ITIs than on trials precededby 3QO-sec Il'ls was repeated. In addition, it was found that a familiar stimulusdid not reset the measuring of the m unlessit consistently signaled that the next reinforced trial would begin in to sec. This finding is consistent with the idea that increases in arousal underlie increases in the response rate. When the familiar stimulus was alwayspresented to sec beforethe nexttrial, arousal would be high because the rat could learn that the next trial would begin in 10 sec. However, when the familiar stimulus did not signal when the next trial would begin, it would not increase arousal and, therefore, responding would not change. Interestingly, the response rate was always high on a trial that was preceded 10 sec earlier by a nonreinforced CS. This high response rate, 10 sec after the nonreinforced CS, was observedeven though the nonreinforced trials did not predict well when the next reinforced trial would occur. This suggeststhat the CS does not have to be highly predictive to reset the measuring of the m if the CS has been pairedwitha US. The increased response rate after a nonreinforced CS mightbe explained in terms of an omission effect or by assumingthat stimuli paired with USs increase arousal.
EXPERIMENT 7
DO RESPONSE LATENCIES ACCOUNT FOR THE m EFFECT?
The results of Experiments 1 and 3-6 were opposite in direction to many fmdings previously discussed. Experiment 7 basciallyrepeated Experiment 1, but in addition to the rate of barpressing, the latencyto the first re-
sponse was recorded. The differencein barpressingafter 10-and 3QO-sec ITIscouldhaveoccurredbecause the rats pressed the bar at different rates throughouteach trial or becausethe time to start barpressing differedafter different I'FIs. By recording latencies, the contributionof the time before the first response on each trial could be assessed. If associative strength is the same after long and short I'FIs, the response rate during each trial should be the same once responding is initiated. However, if associative strength varies after differentITIs, the differences in response rates after 10-and 3QO-sec If'ls wouldnot likely be completely accounted for in terms of response latency. Method
Subjects and Apparatus. The subjects were 7 male rats (Charles River CD). Prior to this experiment, they had been trained to press the bar on a discrete-trials, variable-interval schedule with 6O-sec TFls. The apparatus was the same as that used in Experiment I. Procedure. The procedure was the same as in Experiment 1 (Days 4-24) except that the experiment was run longer (36 days). Trial duration and responses were recorded as in Experiment I. Additionally, latencies to the first response on trials preceded by five long or five short ITIs were recorded for Days 19-30. Response latencies had a cutoff; if the rat had not made a response on a trial before food was primed, latency for that trial was recorded as the time food was primed. Latencies are reported as means ± standard error of the means. Data analysis was the same as in Experiment 1 except that, in addition to response rates, the square roots of the response latencies were analyzed. Latencies were transformed to square roots in order to help normalize the latency data. Analysis of the nontransformed data, although not reported, gave similar results.
Results and Discussion
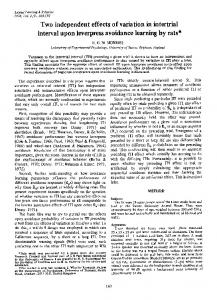
Figure 7 showsthe responserates over days as a function of the mostrecent m. Figure 8 showsresponse rates as a function of the order of the five precedingITIs. The results were similarto thoseof Experiment 1: the response rate on trials immediately preceded by 300-sec I'Fls was lower than the responserate on trials precededby 10-sec I'I'ls, and only the most recent m affectedresponse rate. A rat X most recent ITI X second most recent ITI X third most recent m X fourth most recent m X fifth most recent m ANOVA showed that the main effect of m was significant for the most recent m [F(l,6) = 9.1, P < .05] and that none of the other four m positions had a significant effect [Fs(l,6) s 2.8, p ~ .1]. The response rate may have differed because the rats pressedthe lever throughout the trial at a lower rate when the last m was long. However, the results indicate that a major reason for the lower response rate was because the rat took longer to press the lever after a long ITI (8.6±.8 sec)than to do so after a short m (5.9±.7 sec). Once started, the response rate on all trials was similar. The latency to the first response was shorter for trials preceded by five short than for trials preceded by fivelong I'I'ls [1(4) = 7.05, P < .01]. When the latency to the first response was subtracted from the duration of each trial and response rates were recalculated, the response rate on trials precededby five short I'I'ls was 26 resp/min and
EFFECT OF ITI ON BARPRESSING GENERAL DISCUSSION
•
./
23
.-.- ........\ ....... C 20
~
Last IT! 10"
Q.
en
CI.I ~
CI.I
0
0:::
17
"'"
,0,
14
°
Last IT! 300"
0' \, . . .0........ I I '0..... °
I
5 I 3 Blocks of 6 Sessions Figure 7. Experiment 7: Response rates plotted over sessions separately for trials preceded by lCHec ITIs and JOO.sec ITIs. Response rate was higher on trials preceded by ICHec ITIs (filled circles, solid lines) than on trials preceded by JOO.sec ITIs (open circles, broken lines). Each point represents the average for six consecutive sessions computed as described in the caption for F'1gDI'e I.
on trials preceded by five long ITIs was 24 resp/min [t(4) < 1]. Experiment 7 repeated the basic effect with rats that were first trained with 6O-sec ITIs. This suggests that the failure to observe the basic effect in Experiment 2 was not because the rats were originally trained with 6O-sec ITIs.
22.
••
•••••
III
This series of experiments shows that the duration of the ITI can influence the asymptotic barpressing of rats. The response rate was consistently higher on trials after short ITIs than on trials after long IFls when both ITIs were presented during the same session (Experiments I, 3-7). However, when the different I'FIs occurred during different sessions, no difference in response rates after different I'I'ls was found (Experiment 2). The withinsession difference in response rate could largely be accounted for by different latencies to the first response rather than by different rates of responding (Experiment 7). The effect of m on responding appears to be complete after only one m and does not accumulate over ITIs (Experiments I and 7). As intermediate ITIs increased from 40 to 80 to 160 sec, the response rate decreased, indicating that whatever the mechanism that produced the effect ofITI duration on responding, it distinguishes 160 sec from 300 sec (Experiment 3). Both food, the CS, and a novel stimulus presented 10 sec before a trial produced response rates similar to those produced after a to-sec ITI (Experiments 4 and 5). A familiar stimulus reset the m only when it was highly predictive of when the next trial would occur (Experiment 6). The increase in the response rate after a short ITI is opposite to what one frustration theory (Amsel & Roussel, 1952) and one conditioning theory (Gibbon & Balsam, 1981; Jenkins et al., 1981)would predict. These theories claim that performance will increase as the average time between reinforcers increases. Of course, these theories were not designed to account for the effect reported here. The difference in responding during the ITI and trials indicates that the rats learned a discrimina-
m
••
• •••••
I°•
c
~
= Last ITlIO" I = Last IT! 300" I
19
~
~
351
o
16
0
o I
0 0
0
0 0 0
0 00 I
0
0
o
SSSSS SSLSS SSSLS SSLLS SSSSL SSLSL SSSLL SSLLL
Most Recent 5 ITIs Figure 8. Experiment 7: Response rates plotted separately for each combination of five m durations that preceded each trial (see caption for F'1gDI'l! 2). When the most recent m was 10 sec (ftIIed circles), response rates were higher than when the most recent m was 300 sec (open circles). Each point represents the average for all 36 days computed as described in the caption for Figure 2.
352
HOLDER AND ROBERTS
tion. When discriminations are formed, the frustration effect is abolished (Arnsel & Ward, 1965; Nevin & Shettleworth, 1966), and, therefore, one would not expect Amsel's frustration theory to apply here. The work that contributed to the conditioning theory used an autoshaping procedure; measured acquisition, not asymptotic responding; used a between-subjects design; and used classical, not instrumental, conditioning. However, since these two theories do account for the effect of m in other situations, it is interesting to note how they fail to predict the results reported here. The most obvious failure is that the response rate was not higher after long ITIs than after short ITIs. One attempt to account for the basic effect of ITI duration found here was by hypothesizing that the rats were further away from the lever after 300-sec ITIs than after lo-sec I'I'ls. This difference in distance would account for the different latencies to press the bar after different ITIs that were found in Experiment 7. However, this explanation seems unlikely for two reasons: (1) Differences of less than 2 in. would have to be sufficient to result in different response latencies after different IfIs, and (2) there is no reason to think that the rats would be further from the lever after 300 sec than after 160 sec. Furthermore, this explanation would need to be complicated in order to account for the failure to find the basic result with a between-subjects design. A second way of accountingfor the results reported here was based on a working-memory hypothesis. This hypothesis accounts for the result that shorter ITIs result in shorter response latencies by assuming that response latency reflects the probability of the CS-US association being in working memory; if the association is in working memory, the latency to initiate barpressing will be less. The association is in working memory immediately after the CS and/or the US, and the probability of the association remaining in working memory decreases with time. Therefore, the probability of the association being in working memory is greater after a short-FTl than after a long m. This idea successfully accounts for the basic result, as well as other findings reported here. For example, the CS alone and food alone reset the ITI by reinstating the association in working memory. However, this working-memory hypothesis has difficulty with the finding that a novel stimulus-a stimulus that one would not expect to reinstate the memory trace-can reset the ITI. Also, this hypothesis would need to be complicated in order to explain why the between-subjects procedure did not repeat the basic effect. A third explanation is that responding reflects the degree to which the next trial is predicted. When the trial is predicted, latency to initiate barpressing is short. One advantage of this account is that it explains the finding that a familiar stimulus increases the response rate only when it is a strong predictor of the next trial. The predictiveness explanation could account for the finding that the
response rate decreased as intermediate ITIs increased from 40 to 160 sec, if one assumes that predictiveness decreases as the time interval increases (Experiment 3). Predictiveness fails to explain why a novel, and therefore nonpredictive, stimulus affected barpressing, unless one assumes that the novel stimulus was predictive and produced the effect after being presented only seven times. Furthermore, the predictiveness explanation does not readily account for the failure to observe the basic effect with the between-subjects design. A fourth way of explaining the basic effect is based on extinction of responding during the IT!. Responses during ITIs are not reinforced. More responses should occur during longer ITIs, and, therefore, extinction should be greater, perhaps resulting in greater latencies after longer ITIs. However, responding was so low during the ITI for all experiments (the median was 0) that it seems unlikely that ITI responses could determine the effect. A fifth attempt to account for this study's results was by invoking a hypothesis based on arousal. One arousal hypothesis (Killeen, 1979, 1982) suggests that changes in arousal can affect responding; the greater the arousal, the greater the response rate. Arousal is increased by the US, the CS, novel stimuli, and stimuli associated with the CS and the US. Arousal decreases over time when these events do not occur. The experiments reported here are not tests of the arousal hypothesis, because arousal was estimated on the basis of the results, not measured independently. For example, suppose the novel stimulus had failed to increase the response rate. The conclusion could then have been that the novel stimulus did not change the arousal responsible for changes in latencies, and the arousal hypothesis would have remained intact. However, on the basis of the results of Experiment 6that a familiar stimulus resets the m when it is predictive but not when it is less predictive-the arousal hypothesis can be a little better judged. An example ofa test might be based on the prediction that a stimulus will first reset the ITI when it is paired with food but not later when it is extinguished. This idea is consistent with the finding, from Experiment 6, that the response rate increased on trials preceded 10 sec earlier by the CS alone. The CS alone was not highly predictive of when the next trial would occur, but it still reset the ITI, probably because it was paired on other trials with the US. The results reported here are not easily explained by replacing the term arousal with the term attention. Mackintosh (1975) suggested that stimuli that are reliable signals for reinforcement are better attended to than stimuli that do not signal important events. Perhaps stimuli that increase attention-for example, those with associative strength-decreased response latency in the present series of experiments. This explanation correctly predicts the finding that the familiar stimulus in Experiment 6 reset the measuring of the ITI only when it was a good signal for the next reinforced trial. However, this version of the
EFFECT OF ITI ON BARPRESSING attention explanation does not simply account for why the between-subjects design of Experiment 2 failed to show the basic result. Arousal, as used here, is a vague term that seems to lack explanatory power. However, the type of arousal hypothesized here as possibly being responsible for the changes in responding after different ITIs has several empirically demonstrable properties: (I) It dissipates quickly enough for 10- and 4O-sec ITIs to be distinguished, yet slowly enough for what is left after 160 sec differs from what is left after 300 sec; (2) it is not cumulative-that is, it is complete after one trial; and (3) it may require some sort of within-in session comparison of ITIs, since the response rate does not differ between groups given different IfIs. These last two properties distinguish it from the arousal invoked by current models (Killeen, 1979, 1982). In conclusion, although several possible explanations of the ITI effect reported here were considered, none seems completely satisfactory. Each explanation, at best, accounted for only some of the findings. It is possible that different mechanisms accounted for different effects. For example, changes in responding on a trial preceded by a nonreinforced CS may be accounted for by an omission effect, whereas changes after a novel stimulus may be accounted for by arousal theory. Although we would prefer to explain our results with a single mechanism, this may not be possible here.
353
sical conditioning. JournalofExperimental Psychology: AnimalBehavior Processes. II, 172-193. JENKINS. H. M. (1984). Time and contingency in classical conditioning. In J. Gibbon & L. Allan (Eds.), Timing and time perception (pp. 242-253). New York: New York Academy of Sciences. JENKINS, H. M.. BARNES, R. A., '" BARRERA, F. J. (1981). Why autoshaping depends on trial spacing. In C. M. Locurto, H. S. Terrace, & J. Gibbon (Eds.), Autoshaping and conditioning theory (pp, 255384). New York: Academic Press. KILLEEN, P. R. (1979). Arousal: Its genesis, modulation, and extinction. In M. D. Zeiler & P. Harzern (Eds.), Advances in analysisof behavior: Vol. I. Reinforcement and the organization of behavior (pp. 31-78). New York: Wiley. KILLEEN, P. R. (1982). Incentive theory. In D. J. Bernstein (Ed.), Nebraska Symposium on Motivation, 1981: Response structure and organization (pp. 169-216). Lincoln: University of Nebraska Press. KILLEEN. P. R., HANSON, S. J., '" OsBORNE, S. R. (1978). Arousal: Its genesis and manifestation as response rate. Psychological Review, 85, 571-581. MACKINTOSH, N. J. (1975). A theory of attention: Variations in the associability of stimuli with reinforcement. Psychological Review,82, 276-298. MACKINTOSH, N. J., LITTLE, L., '" Loan, J. (1972). Some determinants of behavioral contrast in pigeons and rats. Learning &: Motivation, 3, 148-161. McNEIL, D. R., '" TUKEY, J. W. (1975). Higher-order diagnosis of two-way tables, illustratedon two sets of demographic empirical distributions. Biometrics, 31, 487-510. MOSTELLER, F., .t TUKEY, J. W. (1977). Data analysisand regression. Reading, MA: Addison-Wesley. NEVIN, J. A., '" SHETTLEWORTH, S. J. (1966). An analysis of contrast effects in multiple schedules. Journal of the Experimental Analysis of Behavior, 9, 305-315. OVERMIER, J. B., '" ScHWARZKOPF, K. H. (1974). Summation offood and shock based responding. Learning &: Motivation,S, 42-52. PEEKE, H. V. S., '" PEEKE, S. C. (1972). Habituation, reinforcement and recovery of predatory responses in two species of fish (CarasREFERENCES sius auratus and Macropodus opercularis). Animal Behaviour, 20, ALLEN, C. M. (1980). Patterns ofactivityandfood orientedbehavior 268-273. inducedby schedules of waterreinforcement. Unpublished master's ROBERTS, S., '" HOLDER, M. D. (1985). Effects of classical conditionthesis, Arizona State University, Tempe, Arizona. ing on an internalclock. Journal of Experimental Psychology: Animal BehaviorProcesses, U, 194-214. AMSEL, A. (1967). Partial reinforcement effects on vigor and persistence. In K. W. Spence & J. T. Spence (Eds.), The psychology of ROTHKOPF, E. Z. (1955). Distribution of practice and the temporal decay of response-producedstimuli. Journalof Experimental Psychollearning and motivation (pp. 1-65). New York: Academic Press. ogy, 49, 33-38. AMSEL, A., '" ROUSSEL, J. (1952). Motivational properties of frustration: I. Effect on a running response of the addition of frustration to STADOON, J. E. R., '" INNIS, N. K. (1969). Reinforcement omission the motivational complex. JournalofExperimental Psychology, 43, on fixed-interval schedules. Journalof the Experimental Analysisof Behavior, 12, 689-700. 363-368. AMSEL, A., '" WARD, J. S. (1965). Frustration and persistence: STEIN, L., SIDMAN, M., '" BRADY, J. V. (1958). Some effects of two Resistance to discrimination following prior experience with the distemporal variables on conditioned suppression. Journal of the excriminanda. Psychological Monographs, 79(4, Whole No. 597). perimental Analysisof Behavior, 1, 153-162. BWOMflElD, T. M. (1967). Behavioralcontrast and relative reinforce- TAUS, S. E., '" HEARST, E. (1970). Effects ofintertrial (blackout) dumentfrequency in two multipleschedules. Journal oftheExperimental ration on response rate to a positive stimulus. Psychonomic Science, 19, 265-266. Analysis of Behavior, 10, 151-158. DAVIS, M. (1970). Effects of interstimulus interval length and variabil- TERRACE, H. M., GIBBON, J., FARRELL, L., '" BAlDOCK, M. D. (1975). Temporal factors influencing the acquisition and maintenance of an ity on startle response habituation in the rat. JournalofComparative autoshaped keypeck, Animal Learning & Behavior, 3, 53-62. &: Physiological Psychology, 72, 177-192. DoMJAN, M. (1980). Effectsofintertrial intervalon taste-aversion learn- WILLIAMS, B. A. (1983). Another look at contrast in multiple schedules. Journalofthe Experimental AnalysisofBehavior, 39, 345-384. ing in rats. Physiology &: Behavior, 25, 117-125. WILTON, R. N., '" CLEMENTS, R. O. (1971). Behavioral contrast as GIBBON, J., BALDOCK, M. D., LocURTO, C., GOLD, L., '" TERRACE, a function of the duration of an immediately preceding period of exH. S. (1977). Trial and intertrial durations in autoshaping. Journal tinction. Journal of the Experimental Analysis of Behavior, 16, of Experimental Psychology: Animal Behavior Processes, 3, 264-284. 425-428. GIBBON, J., '" BALSAM, P. (1981). Spreading association in time. In C. M. Locurto, H. S. Terrace, & J. Gibbon (Eds.), Autoshaping and conditioning theory (pp, 219-253). New York: Academic Press. (Manuscript received June 4, 1987; HOLDER, M. D., '" ROBERTS, S. (1985). Comparisonof timing and clasrevision accepted for publication October 21, 1987.)