Plant Soil (2015) 395:159–172 DOI 10.1007/s11104-015-2534-1
REGULAR ARTICLE
Effect of irrigation on the soil respiration of constructed grasslands in Inner Mongolia, China Ji–Rui Gong & Sha Xu & Yihui Wang & Qinpu Luo & Min Liu & Wei Zhang
Received: 2 December 2014 / Accepted: 4 May 2015 / Published online: 10 June 2015 # Springer International Publishing Switzerland 2015
Abstract Aims We tested the responses of soil respiration to irrigation, at different proportions of field capacity, in constructed grasslands in the Inner Mongolia Autonomous Region of northern China, and tried to identify the underlying physiological mechanisms. Methods The experiment included a legume (Medicago sativa) and a forage grass (Elymus nutans) in sole-crops and a mixed sowing, with four water treatments: a control and three levels of irrigation (low, medium, and high) at three application times: during the regreening, elongation, and heading stages. Results The soil respiration rate (Rs) responded strongly to water addition. Irrigation increased the cumulative growing season R s , which ranged from 257 g C m−2 years−1 to 500 g C m−2 years−1 for M. sativa, from 299 to 391 g C m−2 years−1 for E. nutans + M. sativa, and from 209 to 296 g C m−2 years−1 for E. nutans. Irrigation increased the cumulative Rs by 7 to 49 %. Rs of the grass–legume mixture was 1.2 to 1.4 times the corresponding values in the E. nutans plots. In addition to the effects of soil temperature and moisture content, Responsible Editor: Per Ambus. J. Gong (*) : S. Xu : Y. Wang : Q. Luo : M. Liu State Key Laboratory of Surface Processes and Resource Ecology, College of Resources Science and Technology, Beijing Normal University, Beijing 100875, China e-mail:
[email protected] W. Zhang Key Laboratory of Tourism and Resources Environment in Universities of Shandong, Taishan University, Taian 271021, China
Rs was explained by differences in the net photosynthetic rate and in microbial biomass. Water addition increased Q10, which was strongly and positively correlated with the total C, C/N ratio, and cellulose content of the plants. Conclusions Rs responded strongly to irrigation, although the response differed between the two species. The grass–legume mixtures showed increased Rs compared to values in the grass sole-crop. Rs appears to be determined by moisture and temperature, but also by the net photosynthetic rate and by microbial properties such as microbial biomass. Keywords Soil respiration . Irrigation . Constructed grasslands . Grass–legume mixtures . Q10
Introduction Soil respiration (Rs) is the second-largest flux of carbon between terrestrial ecosystems and the atmosphere, and is a major component of the terrestrial carbon cycle. This process returns about 80 Pg C to the atmosphere every year (Raich et al. 2002). Because of this large mass, even small proportional changes in Rs may greatly affect soil carbon sequestration and atmospheric carbon exchange (Raich and Schlesinger 1992). Rs from grassland ecosystems, which account for more than 40 % of the terrestrial landscape and store large amounts of soil C (Casasovas et al. 2012), contributes a large proportion of the global CO2 flux. Thus, estimating the contributions of grassland respiration to the atmosphere is a
160
crucial challenge in research on carbon cycles and in climate-change modeling. China has one of the largest areas of grassland in the world, with an average vegetation cover of more than 40 % (Ren et al. 2008). However, irrational and unsustainable development and utilization of China’s grasslands and the impact of global climate change have severely damaged China’s grassland resources, leading to widespread degradation and desertification. Thus, both the grassland’s productivity and the vegetation quality have declined sharply (Akiyama and Kawamura 2007). Moreover, long-term over-grazing and a growing contradiction between the need to sustain grasslands for ecological purposes and the need to exploit them to provide food and a source of employment have begun to constrain livestock production. Therefore, the construction of artificial grassland (by sowing grass and legume seeds and providing supplemental irrigation) has become a primary measure to combat these problems, and it has become imperative to establish artificial grasslands in many areas where natural grassland is inadequate. The artificial grassland now covers an area of 23×106 ha, accounting for 3.4 % of the area of natural grassland (Hu 2000). However, despite a considerable scientific commitment to analyzing grassland respiration, our understanding of the contributions of artificial grassland respiration to the atmosphere remains limited. Rs comprises both heterotrophic respiration by microorganisms, which decompose organic residues and mineralize humus substances, and autotrophic respiration, which represents the production of CO2 associated with root growth and metabolism (Hanson et al. 2000; Wang et al. 2006b). These processes are controlled by a range of abiotic and biotic factors, including soil temperature, water availability, substrate supply, vegetation composition and density, soil texture, litter biomass, and microbial biomass (Lloyd and Taylor 1994; Li et al. 2008; Gong et al. 2012). Thus, there is a complex network of interactions that control the soil respiration rate (Flanagan et al. 2013). It is well known that both temperature and moisture strongly control plant growth and ecosystem C cycling processes (Falloon et al. 2011; Gong et al. 2014). Thus, to predict the response of Rs to climate change, it is necessary to thoroughly understand the dependence of this process on the soil temperature and water content. Despite many studies of this subject, many questions remain unanswered. A recent field study found that soil water availability was the primary constraint on plant
Plant Soil (2015) 395:159–172
growth and ecosystem C processes during 2 years with very different annual precipitation levels in temperate grassland in China’s Inner Mongolia Autonomous Region (Gong et al. 2014). Many studies have been performed under uncontrolled field conditions, but it was difficult to isolate the effects of temperature and moisture, which interact with each other and with other factors such as the C substrate supply and microbial biomass, all of which vary throughout the growing season (Davidson et al. 2000). Although laboratory experiments allow control of these interactions, they have most often been performed using disturbed soil samples, thereby eliminating many of the environmental constraints that affect the complexity of the interactions among the processes that control respiration and their interaction with the environment. Thus, it is imperative to conduct experiments that manipulate only one factor (such as soil moisture) at a time, and leave other environmental conditions under natural conditions. The temperature sensitivity of soil respiration (Q10, the change in respiration rate over a temperature change of 10 °C) is an important parameter for predicting the response of terrestrial C cycling to climate warming (Davidson and Janssens 2006). The Q10 of respiration has received substantial attention, but still remains controversial (Davidson and Janssens 2006; Jia et al. 2013a, b). Q10 is not a constant value, and it varies in response to changes in vegetation and soil conditions. Many studies have shown that Q10 changes in response to changes in soil temperature, soil water content, the spatial and temporal scales of the system, and substrate availability, and ranges from 1.0 to 5.6 (Lloyd and Taylor 1994; Luo et al. 2001; Xu and Qi 2001; Gaumont-Guay et al. 2006; Almagro et al. 2009; Gong et al. 2014). In the context of artificial grassland ecosystems, we therefore need to know whether the interactions among soil processes (thus, the effects on Q10) are consistent over time, or whether they vary annually, seasonally, and at shorter scales. A number of studies have shown that the soil water content has a limited impact on the soil respiration rate except at the extremes of saturation or water deficits (Hanson et al. 1993; Jia et al. 2006; Deng et al. 2012; Jiang et al. 2013). However, the mechanisms responsible for these responses of soil respiration to soil moisture have not been conclusively defined. In addition, the effects of soil moisture on Q10 are uncertain. A recent field study (Gong et al. 2014) found that the temperature
Plant Soil (2015) 395:159–172
sensitivity of Rs is affected by soil water availability and that Q10 tended to decrease with increasing soil water content until it reached a minimum value, after which it increased again; the study also found that this interaction differed among years. A laboratory incubation experiment found that Q10 was significantly lower at lower soil moisture content than at higher moisture content during the early stages of the incubation, but became significantly higher at 20 % moisture content than at 60 %, and not significantly different from other moisture levels, during the late stages of the incubation (Zhou et al. 2014). Unfortunately, there is little information about whether altered availabilities of water affect Q10 in the field (Jia et al. 2013a). In the present study, our goal was to fill in some of the abovementioned gaps in our knowledge through field experiments. We manipulated water availability in constructed grassland in Inner Mongolia, a semiarid region of China. The forage species included a legume (Medicago sativa) and a forage grass (Elymus nutans). Medicago sativa is a perennial legume that can fix N from the atmosphere, usually has a higher yield than native grasses and is richer in protein. Elymus nutans is a native perennial grass with a higher carbohydrate content, and can benefit from the nitrogen fixed by the legumes in mixed plantings (Ledgard 1991; Albayrak and Türk 2013). We investigated sole-crops of each species, as well as a mixture of M. sativa and E. nutans. Our main objectives were to characterize the seasonal and annual responses of soil respiration to a gradient of water availability. Our specific objectives were (i) to quantify the contributions of constructed grassland respiration to the atmosphere; (ii) to characterize the response of Rs to water availability and the underlying physiological mechanisms; (iii) to determine how the grass–legume mixture affected soil respiration compared with the sole-crops; and (iv) to understand the influence of soil moisture on the sensitivity of Rs to the soil temperature (Ts), and to analyze how changes in soil moisture influenced Q10.
Materials and methods
161
to 44°49′N). This region enjoys a temperate continental climate, with a mean annual temperature of 0 to 1 °C, with mean monthly temperatures ranging from a minimum of −42.4 °C in January to a maximum of 38.3 °C in August. The mean annual precipitation is 300 mm, with more than 70 % falling during the growing season from June to August. The dominant soil is a chestnut soil, with a small amount of brown soil (Gong et al. 2014). The thickness of the chestnut soil is 15 to 80 cm and its organic matter content is 2 to 3 %. The basic type of zonal vegetation is a Stipa grandis grassland. The experiments were conducted in three grassland types (hereafter, sowing modes). The forage species were M. sativa (purple alfalfa), a perennial legume that can fix N from the atmosphere, and E. nutans, a native perennial grass. In the present study, we investigated sole-crops of each species and a mixture of the two species. Three experimental sites were established in the study area: sole-crops stands of M. sativa and E. nutans, and a mixed-species stand (M. sativa + E. nutans). At each site, we used a randomized block design with three blocks as replicates and with 3-m buffer zones between blocks. In each block, we randomly established 5 m×5 m plots (4 treatments × 4 replicates = 16). In these 16 plots, we established four water treatments, each with four replicates: a control treatment (without irrigation), and three different levels of irrigation (low, LI; medium, MI; and high, HI) during three growth stages. Table 1 provides details of the treatments. The application times were the Table 1 Precipitation and irrigation during the three growth stages Treatment
Growth stage
HI
Regreening stage
Our study was conducted in the Maodeng Pasture Experimental Area of Inner Mongolia University, in Xilinhot, Inner Mongolia, China (116°02′E to 116°30′E, 44°48′N
Irrigation (mm/ha)
9.14
208.05
MI
9.14
208.05
LI
9.14
208.05
Control
9.14
0
35.51
791.7
MI
35.51
447.9
LI
35.51
253.4
HI
Elongation stage
Control
35.51
0
56.38
485.5
MI
56.38
348.7
LI
56.38
212.1
Control
56.38
0
HI
Plant materials and experimental design
Precipitation (mm)
Heading stage
Values represent the total water for each growth stage
162
regreening stage (18 to 21 May), elongation stage (21 to 24 June), and heading stage (26 to 29 July). The control plots received no additional water; their only water source was precipitation. The total precipitation was 101 mm during the 2013 growing season based on data obtained from a Dynamet meteorological station at the grassland site. During the regreening period, soils in all treatment plots were irrigated to 85 % of field capacity (i.e., equivalent to HI). During the elongation stage and the heading stage, soils were irrigated to 85 % (HI), 65 % (MI), and 45 % (LI) of field capacity. All water treatments were applied using a sprinkler. Irrigation varied from once per 2 weeks to twice-weekly, depending on climate conditions (based on the results of preliminary trials; data not shown). Soil respiration Diurnal and seasonal changes in soil respiration (Rs) were measured at monthly intervals from June to September during the growing season in 2013 using an automated infrared gas analyzer (LI-8100; LI-COR Inc., Lincoln, NE, USA). We installed long-term soil respiration chambers in each plot. Each chamber was 20.3 cm in diameter, and was mounted on a PVC soil collar that was inserted into the soil to a depth of 10 cm after cutting the aboveground vegetation by scissors 1 day before the first measurements to allow the soil to recover from the disturbance. The collars were left in the same locations throughout the study for continuity (Wang et al. 2006a). The Rs inside each collar was measured at least once every 2 h from 06:00 to 20:00 on each day. We calculated the cumulative growing season respiration using the method followed by Gong et al. (2014). Soil temperature at a depth of 10 cm was measured at the same time as the soil respiration measurements using an LI-8100-203 probe (LI-COR) inserted in the soil near the collars. The volumetric soil water content to a depth of 20 cm near the soil collars was monitored with an LI8150-202 portable sensor (LI-COR). Both soil temperature and moisture were measured every 2 h during the measurement period. Plant biomass In late August of 2013, we sampled peak aboveground biomass in each plot at each site. The aboveground biomass was harvested by clipping all plants just above
Plant Soil (2015) 395:159–172
the soil surface from five 1 m×1 m quadrats. After removing the aboveground biomass, we collected five soil cores in each quadrat using an 8-cm-diameter soil auger, and divided each core into depths of 0 to 10 cm, 10 to 20 cm, 20 to 30 cm, 30 to 40 cm, and 40 to 60 cm. Roots were separated from the soil samples and washed with tap water in the laboratory. Live and dead roots were distinguished according to their color. All samples were oven-dried at 65 °C to constant weight to determine the biomass. Determination of the plant cellulose content After harvesting the biomass, we ground the dried samples to pass through a 0.5-mm mesh using a grinding mill. The cellulose content was determined using the acid detergent fiber–sulfuric acid method of van Soest (1967) . Plant total carbon (C) and total nitrogen (N) were measured using the Walkley–Black wet oxidation technique (Nelson and Sommers 1982) and the Kjeldahl method (Bremner 1960), respectively. Based on these values, we calculated the plant C/N ratio. Soil characteristics After finishing our soil respiration measurements, we collected soil samples at five depths using the abovementioned soil core sampler. Samples were placed in sterile plastic bags and sealed, and were taken to the laboratory for storage at 4 °C until the soil microorganisms and soil nutrients could be studied. Part of each soil sample was air-dried and passed through a 2mm sieve to remove roots and other coarse materials before analysis. Soil total C was measured using the same methods used for plant C and N. The remaining soil was used to analyze microbial biomass carbon (MBC). MBC was determined using the chloroform fumigation-extraction method (Vance et al. 1987). Gas exchange Photosynthetic rates were measured using mature, fully expanded leaves from five plants per plot at 2-h intervals from 06:00 to 18:00 from June to September on the same dates when soil respiration was measured. Each of the five plants came from the same plot. Net CO2 assimilation (the net photosynthetic rate, Pn) was measured using the infrared gas analyzer of a LI-6400 portable photosynthesis system (Li-Cor). The total
Plant Soil (2015) 395:159–172
163
seasonal photosynthetic gas exchange was estimated using the mean diurnal values (Gong et al. 2011). Statistical analysis Before performing any statistical tests, we confirmed that the data were normally distributed and not heteroscedastic. We then used one-way ANOVA with sowing type (the two sole-crops and the mixed-species combination) as the main effect to test for significant differences among the treatments in annual aboveground biomass, root biomass, and MBC, as well as in the soil C/N ratio and Q10. When the ANOVA result was statistically significant, we then used the LSD method to identify significant differences between pairs of irrigation treatments. We used Q10 to represent the change in respiration per 10 °C change in soil temperature, which represents the temperature-sensitivity of Rs, using the following equation (Boone et al. 1998): Q10 ¼ e10β
ð1Þ
where β is the regression coefficient in the relationship between Rs and Ts, which was fitted using the following equation: lnðRs Þ ¼ α þ βT s
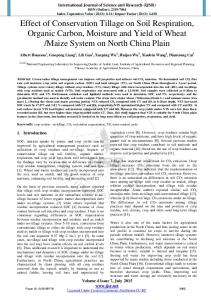
Fig. 1 The estimated cumulative soil CO2 efflux (soil respiration, Rs) during the growing season in the different soil moisture treatments for sole-crops of each species and for the grass–legume mixture. LI low irrigation, MI medium irrigation, HI high irrigation. See Table 1 for details. Bars for a species labeled with different letters differ significantly at p