peripheral refractive error can be significantly different from that of the fovea we wished to ... Methods: We measured detection thresholds in the fovea and at 30 degrees in the horizontal .... ated on a high resolution computer moni- tor (Eizo ...
A O S 2001
Effect of localized defocus on detection thresholds for different sized targets in the fovea and periphery Roger S. Anderson, D. Rodney McDowell and Fergal A. Ennis Vision Science Research Group, School of Biomedical Sciences, University of Ulster at Coleraine, N. Ireland
ABSTRACT. Purpose: Previous studies of optical blur in perimetry have measured the effect of foveal refractive error on peripheral perimetric detection thresholds. Since peripheral refractive error can be significantly different from that of the fovea we wished to remove the ambiguity of previous results by correcting the actual peripheral refractive error first before adding blur. Methods: We measured detection thresholds in the fovea and at 30 degrees in the horizontal temporal field in two trained observers. Peripheral refractive error was determined at each location and thresholds measured at the same locations for stimuli ranging in size from 0.2 to 6.4 degrees and refractive errors between ∫4.00 diopters. Results: Foveal thresholds increased immediately with increasing refractive error, particularly for smaller stimulus sizes. At 30 degrees, thresholds for smaller stimuli were less affected by defocus initially and then increased more sharply. Larger stimuli were relatively unaffected by defocus such that when stimulus size reached 1.6 degrees there was little or no increase in threshold for refractive error between ∫4.00 diopters. Conclusions: Peripheral refractive error, largely forgotten by perimetrists, has a significant effect on performance, particularly for smaller stimuli. Differences in foveal vs peripheral viewing can be explained by differences in ganglion cell receptive field sizes. Key words: perimetry – peripheral refractive error – stimulus size. Acta Ophthalmol. Scand. 2001: 79: 60–63 Copyright c Acta Ophthalmol Scand 2001. ISSN 1395-3907
W
hen visual loss is detected in the course of perimetric examination, it is important to determine the nature of the loss and its location in the visual system. In particular, the diagnosis of neural visual loss requires the ability to differentiate between deficits which are neural from those which are optical or artifactual. With this in mind, perimetrists habitually employ some form of refractive correction deemed to be appropriate to the test distance. Several studies have attempted to examine the effects of optical defocus on
60
perimetric thresholds (Frankhauser & Enoch 1962; Herse 1992; Heuer et al. 1978; Mutlukan 1994; Weinreb & Perlman 1986) but the interpretation of these studies is ambiguous because they examined the effect of changing foveal refractive error on peripheral differential light threshold. We believe this approach is inappropriate because peripheral refractive error is often very different from that of the fovea and varies with eccentricity (Ferree et al. 1931; Lotmar & Lotmar 1974; Millodot 1981; Millodot et al. 1975; Millodot & Lamont 1974; Rempt
et al. 1971), particularly in the astigmatic component which varies from subject to subject but can easily be as high as 3.00D at 30 degrees eccentricity (Ferree et al. 1931; Lotmar & Lotmar 1974). One of these previous studies of defocus effects on perimetric thresholds (Frankhauser & Enoch 1962) conceded that significant peripheral refractive error exists, but did not take it into account. While we acknowledge the impracticality of correcting refractive error at all locations, the large differences to be observed between foveal and peripheral refractive error could actually mean that, in many instances, correcting foveal refractive error in isolation is making peripheral refractive error worse, and thus reducing peripheral ‘sensitivity’. Previous studies also indicate that there is a large inter-individual variation in peripheral refractive error, and in particular Sturm’s interval (Ferree et al. 1931; Lotmar & Lotmar 1974). It is entirely possible that some ring-like relative scotomas, often recorded by automated perimetry and equally often deemed to be caused by vignetting by the trial lens edge, could actually be due to a high peripheral refractive error, of either a spherical or astigmatic nature, in the subject. The above previous studies which have examined the effects of foveal refractive error on perimetric thresholds have yielded variable results, possibly because the magnitude of the initial peripheral refractive error, which was not measured, could have been different in different subjects, meaning that adding positive or negative blur would yield different effects on threshold. These studies invariably
A O S 2001 stress the importance of accurate correction of near refractive error, but only for the fovea. Some studies only measured effects out to small eccentricities (Herse 1992; Weinreb & Perlman 1986) without considering the increasing magnitude of refractive error with eccentricity, and its effect on performance further in the periphery. We wished to examine the effect of changing peripheral refractive error on peripheral perimetric thresholds and compare this to the effect in the fovea, in order to more reliably measure the magnitude of any performance deficit. A further goal of this study was to determine if the effect of peripheral blur is different for differently sized stimuli in the fovea and periphery. With few exceptions (Mutlukan 1994) previous studies examining the effects of refractive blur have not used more than one stimulus size, which is usually a small one. Stimulus sizes used for static perimetry are based on the Goldmann sizes, originally developed for kinetic perimetry. In kinetic perimetry it is logical to use a small stimulus size to clearly trace the shape of a scotoma, but it may be that in static perimetry the smaller Goldmann sizes are unnecessary and maybe even inappropriate. We wished to determine which stimulus sizes are most robust to the effects of optical defocus in the fovea and periphery as these would be less affected by any peripheral refractive error in the subject.
Materials and Methods Subjects Two trained observers (RSA and DRM), both near emmetropes, acted as subjects for this study. Only the right eyes were employed. Both subjects had foveal acuity of 20/15 and neither subject had any detectable ocular pathology. Refractive error was measured foveally and at 30 degrees in the horizontal temporal field of both subjects by an experienced optometrist (FAE) using retinoscopy. These values then served as the basis for determining the magnitude of refractive blur at the fovea and 30 degrees in the periphery, respectively. The determined refractive errors were as follows: RSA: Foveaπ0.75DS, Peripheryπ1.50DS/ª1.50DC¿90 DRM: Foveaπ0.50DS, Peripheryπ0.75DS/ª2.25DC¿90
Stimuli Stimuli were circular white spots generated on a high resolution computer monitor (Eizo T562-T) by a Visual Stimulus Generator VSG2/3 (Cambridge Research Systems). Stimulus background was also white, with a luminance of 27 cd/m2 (85 Asb): this is slightly higher than the background used by the Humphrey perimeter (31.5 Asb) but yielded a more reliable output from the monitor, with negligible change in the subjects’ sensitivity profile. Stimuli were incremental, as in conventional perimetry, and of six different sizes; 0.2, 0.4, 0.8, 1.6, 3.2 and 6.4 degrees, roughly corresponding to Goldmann sizes II-V with two additional larger sizes. Psychophysics For the peripheral measurements, subjects sat with their heads on a chin rest, with the left eye occluded, viewing a computer monitor 40 cm in front. Room lights were switched off. A one-degree fixation cross on the left side of the monitor was used to maintain foveal fixation and a π2.50D near addition was added to any foveal refractive correction to eliminate accommodation. The previously measured peripheral refractive correction in combination with the π2.50D addition was placed in front of the eye in a second lens holder, in line with the stimulus, presented at 30 degrees eccentricity in the horizontal temporal field. This form of correction, where the fovea and periphery are corrected separately using lenses in line with the both the fixation cross and the stimulus, has the advantage of eliminating the prismatic effects caused by viewing targets through the periphery of a lens, which serve to change the effective eccentricity (Frankhauser & Enoch 1962). Detection thresholds were measured for refractive errors ranging from π4.00D to ª4.00D using a 3/1 reversal, temporal two alternative forced choice (2AFC) psychophysical procedure, where the subject had to indicate if the stimulus was presented in the first or second of two intervals by pressing one of two buttons. Stimulus presentation time was 0.3 seconds and each interval was separated by 2 seconds and preceded by an audible tone. One incorrect response resulted in a 10% increase in contrast, and three correct responses in a row resulted in a 10% decrease in contrast. Each session ran until 6 reversals were obtained and threshold was calculated as the mean of the 6
reversals. Natural pupils were employed throughout and were carefully measured before and after each session (5 mm DRM, 6 mm RSA). The foveal measurements were undertaken with the subject viewing the computer monitor at 2 m. Cycloplegia was employed, using 1% cyclopentolate ophthalmic solution, to prevent accommodation under the negative lens conditions. This resulted in pupil dilation to 8 mm or more so an artificial pupil of the same size as measured in the peripheral experiment was employed throughout. Subjects were given an extra π0.50DS on top of their foveal refractive correction to allow for the effects of cyclopegia on refractive error. As with the peripheral experiment, thresholds were measured for refractive errors ranging from π4.00DS to ª4.00DS using a 3/1 reversal, 2AFC psychophysical procedure, and threshold was again calculated as the mean of six reversals.
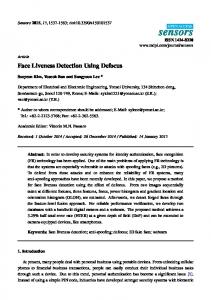
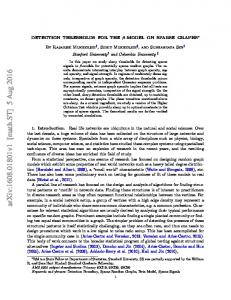
Results The results for the foveal experiment are shown in Fig. 1 (mean of both subjects). As expected, contrast sensitivity is lower for small stimuli than large stimuli and it can be seen that sensitivity declined immediately with increasing dioptric blur for all stimuli. However, the effect of blur was much more pronounced for smaller stimuli, particularly the 0.2 and 0.4 degree stimuli. For the 0.2 degree stimulus (corresponding to just smaller than Goldmann size II) the effect of blur was so severe that, beyond 1 diopter positive blur, subjects could not perform the task at all within the physical constraints of the monitor. The dashed line along the bottom of the plot represents the lowest measurable contrast sensitivity under experimental conditions and arrows indicate that performance fell below this level. Fig. 2 shows the mean results for the 30 degree location. Performance is poorer in the periphery than in the fovea for all stimuli and is again lower for small stimuli than large stimuli but this time the decline in performance with decreasing stimulus size is much greater than in the fovea, particularly in the corrected case. In addition, the change in performance with increasing blur shows a different pattern in this case. For larger stimuli (1.6–6.4 degrees) the effect of blur is very
61
A O S 2001
Fig. 1. Foveal detection thresholds for stimuli of different sizes under different amounts of refractive blur. Dashed line along the bottom represents the lowest measurable contrast sensitivity under experimental conditions and arrows indicate that performance fell below this level.
small all the way out to ∫4.00D, the curves appearing very flat. For smaller stimulus sizes blur also has a small effect initially, but then performance deteriorates more quickly and substantially. For the 0.4 degree stimulus performance at first declines slowly and smoothly but beyond ∫2 dioptres of blur falls sharply such that subjects could not perform the task within the experimental contrast range. For the 0.2 degree stimulus, performance declines slowly for both subjects until defocus reaches about ∫1 diopter and then again falls sharply. The dashed line along the bottom of the plot again represents the lowest measurable contrast sensitivity under experimental conditions and arrows indicate that performance fell below this level.
Discussion The above results are in general agreement with previous studies which have looked at the effects of dioptric blur on perimetric thresholds. However, the added benefit of quantifying and controlling peripheral refractive error permits a more accurate assessment of the effects of blur. Our results indicate that the effects of dioptric blur are quantitatively and qualitatively very different in the fovea and periphery. Foveal thresholds are generally more affected by blur and this has been noted in previous studies. Our foveal results indicate a decrease in foveal contrast sensitivity of 0.43 dB/D for the
62
Fig. 2. Detection thresholds at 30 degrees eccentricity for stimuli of different sizes under different amounts of blur. Dashed line again represents the lowest measurable contrast sensitivity under experimental conditions and arrows indicate that performance fell below this level.
0.4 degree stimulus, which is in close agreement with Campbell and Green (1965) but higher than the 2.45 dB/D recorded by Herse for a size III stimulus (Herse 1992). However, the dependence of defocused performance on stimulus size has not been clearly illicited before. It seems that larger stimuli not only yield much lower thresholds than small stimuli, but produce performance which is more robust to the effects of optical defocus in both the fovea and periphery. This can be partly explained by the eye’s optical transfer function for different levels of defocus (Campbell & Green 1965) which indicates that lower spatial frequencies are less affected by defocus than higher spatial frequencies, meaning that larger stimuli, which possess more low frequency content, should be more robust to the effects of blur. Previous studies (Wood et al. 1986) have reported that the ‘sensitivity’ profile is flattened by the use of larger stimulus sizes. This may be partly because the larger stimuli are less affected by the increasing peripheral defocus and so permit thresholds closer to that of the fovea. If this is the case, the term ‘retinal sensitivity profile’ should be used very carefully, since the change in performance is not caused by retinal factors. Herse (1992) also could not explain why, with increasing blur, the slope of the ‘retinal’ profile changed little for a 3 mm pupil but became significantly flatter for an 8 mm pupil. The reason may be that the superior depth of focus afforded by a small pupil reduces the effect of any dif-
ferential refractive error between the fovea and periphery. This means that further increases in blur across the field result in a more uniform decrease in the sensitivity profile. However, for larger pupil sizes the peripheral stimuli are already blurred when the foveal stimuli are in focus, and although increasing the foveal blur may significantly affect foveal performance, it may not reduce peripheral performance much further, indeed it could theoretically even improve it. However, how do we explain the qualitative differences between foveal and peripheral performance? In central vision, receptive field size is similar to the smaller stimulus sizes used here (0.2–0.4 degrees) and at 30 degrees in the periphery much larger (0.6–0.8 degrees) (Enroth-Cugell & Robson 1966). As stimulus size increases, increasing spatial summation within a receptive field results in lower thresholds until the stimulus becomes so large that it covers the entire receptive field and then begins to extend into neighbouring receptive fields. At this point sensitivity will increase only in accordance with probability summation. In the fovea, where receptive fields are small, a small stimulus should almost immediately fill any receptive field on which it falls, and further increases in stimulus size would yield only small increases in sensitivity. This pattern is displayed by the data in that, when stimulus size goes above 0.4 degrees, any further increase in sensitivity is relatively small for an in-focus target. In the periphery,
A O S 2001 where receptive fields are larger, sensitivity should continue to increase significantly for a longer time before the receptive field is completely filled. The data again display this pattern for an in-focus target. However, when a point stimulus is progressively defocused, its image simultaneously decreases in luminance and increases in diameter in accordance with its point spread function. This results in a blur circle being formed on the retina but the total energy within the blur circle is only slightly less than that in the original in-focus image. As long as this energy is contained within the receptive field there will be little change in threshold. However, as the amount of defocus increases, so too does the size of the blur circle until it reaches a point where the blurred energy fills the entire receptive field and begins to spill outside it to other ganglion cells. At this point the total amount of energy undergoing summation within the receptive field begins to decline significantly, and performance decreases correspondingly. Further increases in defocus result in steady, significant deceases in performance. This explains the pattern of performance observed here where, for small stimuli, the decline in performance with increasing blur is immediate and dramatic in the fovea, but at 30 degrees, there is little or no deterioration with blur initially and then performance declines dramatically in much the same way as the fovea. In conclusion, while the effects of peripheral optical defocus are less severe than those of the central optics, they remain significant. It makes sense to have a small stimulus when attempting to plot the exact shape and extent of a localized scotoma and this may indeed improve sensitivity in many cases (Gramer et al. 1981; Osako et al. 1999; Zalta & Burch-
field 1990). However, other studies indicate reduced variability with larger stimulus sizes (Wall 1997). In detecting and measuring the depth of early neural loss by static perimetry, larger stimuli would have the additional advantage of being more robust to the effects of blur by peripheral refractive error. The subjects in this study possessed only moderate peripheral refractive error and would display only moderate loss of sensitivity in a clinical perimetry test with a Goldmann III target. For other subjects the consequences of uncorrected peripheral refractive error could be more pronounced. In certain cases, the use of a larger target may help to better separate neural losses of vision from optical ones.
References Campbell FW & Green DG (1965): Optical and retinal factors affecting visual resolution. J Physiol 181: 576–593. Enroth-Cugell C & Robson JG (1966): The contrast sensitivity of retinal ganglion cells of the cat. J Physiol 187: 517–552. Frankhauser F & Enoch JM (1962): The effects of blur upon perimetric thresholds. A method for determining a quantitative estimate of retinal contour. Arch Ophthalmol 68: 240. Feree CE, Rand G & Hardy C (1931): Refraction for the peripheral field of vision. Arch Ophthalmol 5: 717–731. Gramer E, Kontic D & Krieglstein GK (1981): Computer perimetry of glaucomatous visual field defects at different stimulus sizes. Ophthalmologica 183: 162–167. Herse PR (1992): Factors influencing normal perimetric thresholds obtained using the Humphrey Field Analyser. Invest Ophthalmol Vis Sci 33: 611–617. Heuer DK, Anderson DR, Feuer WJ & Gressel MG (1987): The influence of refraction accuracy on automated perimetric threshold measurements. Ophthalmol 94: 1550. Lotmar W & Lotmar T (1974): Peripheral
astigmatism in the human eye: experimental data and theoretical model predictions. J Opt Soc Am 64: 510–513. Millodot M (1981): Effect of ametropia on peripheral refraction. Am J Optom Physiol Optics: 58: 691–695. Millodot M, Johnson AL, Lamont A & Leibowitz HW (1975): Effect of dioptrics on peripheral visual acuity. Vision Res 15: 1357– 1362. Millodot M & Lamont A (1974): Refraction of the periphery of the eye. J Opt Soc Amer 64: 110–111. Mutlukan E (1994): The effect of refractive blur on the detection sensitivity to light offsets in the central visual field. Acta Ophthalmol 72: 189–194. Osako M, Osako S, Hashimoto K & Okano T (1999): The effectiveness of glaucomatous visual field test using a size I stimulus. Nippon Ganka Gakkai Zasshi – Acta Societatis Ophthalmologicae Japonicae 103: 201–207. Rempt F, Hoogerheide J & Hoogenboom WPH (1971): Peripheral retinoscopy and the skiagram. Ophthalmologica 162: 1–10. Wall M (1997): Variability in glaucomatous visual field damage is reduced using size V stimuli. Am J Ophthalmol 38: 426–435. Weinreb RN & Perlman JP (1986): The effect of refractive error on automated global analysis program G-1. Am J Ophthalmol 104: 229. Wood JM, Wild JM, Drasdo N & Crews SJ (1986): Perimetric profiles and cortical representation. Ophthalmic Res 18: 301. Zalta AH & Burchfield JC (1990): Detecting early glaucomatous field defects with the size I stimulus and Statpac. Br J Ophthalmol 74: 289–293. Received on April 11th, 2000. Accepted on September 13th, 2000. Corresponding author: Roger S. Anderson, PhD Vision Science Research Group School of Biomedical Sciences University of Ulster at Coleraine N. Ireland, BT52 1SA UK
63