Energies 2013, 6, 4207-4222; doi:10.3390/en6084207
OPEN ACCESS
energies
ISSN 1996-1073 www.mdpi.com/journal/energies Article
Effect of Mixing Driven by Siphon Flow: Parallel Experiments Using the Anaerobic Reactors with Different Mixing Modes Takuro Kobayashi 1,*, Ya-Peng Wu 2, Kai-Qin Xu 1,3 and Yu-You Li 2 1
2
3
Center for Material Cycles and Waste Management Research, National Institute for Environmental Studies, 16-2 Onogawa, Tsukuba, Ibaraki 305-8506, Japan; E-Mail:
[email protected] Graduate School of Environmental Studies, Tohoku University, 6-6-06 Aza-Aoba, Aramaki, Aoba-ku, Sendai, Miyagi 980-8579, Japan; E-Mails:
[email protected] (Y.-P.W.);
[email protected] (Y.-Y.L.) School of Environmental Science and Engineering, Shanghai Jiao Tong University, 800 Dongchuan Road, Minghang District, Shanghai 200240, China
* Author to whom correspondence should be addressed; E-Mail:
[email protected]; Tel.: +81-29-850-2400; Fax: +81-29-850-2560. Received: 8 June 2013; in revised form: 25 July 2013/ Accepted: 5 August 2013 / Published: 19 August 2013
Abstract: The effect of mixing by siphon flow on anaerobic digestion, sludge distribution and microbial community were examined in parallel experiments using a siphon-mixed reactor (SMR), an unmixed reactor (UMR) and a continuously mixed reactor (CMR). The SMR performed well without the accumulation of fatty acids under COD loading rates varying from 3 to 18 kg/m3/day, while the UMR was totally acidified when the loading rate increased to 10 kg/m3/day. The methane yield of the SMR was at least 10% higher than that of the UMR, and comparable to that of the CMR. Furthermore, the SMR was found to markedly improve the dispersion of solids and reduce deposit formation compared to the UMR. Besides, during stable operation, the fatty acids level in the effluent of the SMR and UMR was lower than that in the CMR, and the archaeal community structure of the SMR was similar to that of the UMR. Keywords: anaerobic digestion; siphon mixed reactor; mixing mode; sludge distribution; microbial community
Energies 2013, 6
4208
1. Introduction Small-scale anaerobic digesters have been put to use mainly in developing countries [1], and there has been a recent significant increase in the number of small-scale digesters in operation in Asian countries [2,3]. At present, a very large number of small-scale digesters are in operation in China and India in particular, with over 30 million in the former [2], and 4 million in the latter [3]. These biogas plants are used to provide fuel and fertilizer instead of the firewood and animal dung typically used in poor rural areas for these purposes. Usually, biogas is used for cooking and lighting in households. Since cooking and lighting energy constitute most of the total energy consumed in rural households in developing countries [4], biogas can meet a large part of the household energy demands. Furthermore, the use of digesters brings other benefits: living conditions are significantly raised thanks to these new kitchens which use biogas instead of the old firewood, coal and dried stalk-fired kitchens [5]. Since the purpose of this type of digester is to create energy for poor households in rural areas, the cost of construction and operation must be very low. Typical digesters are unstirred and unheated systems, and as such, they are quite inefficient. Small-scale digesters require a very long hydraulic retention time (HRT), usually in excess of 60 days, to substantially degrade organic materials. Although many digesters have been built, further research and awareness is still needed, and it is crucial that researchers and engineers take the local and economical considerations into account when designing efficient small-scale digesters [2]. The efficiency of anaerobic digestion is affected by various factors, such as feeding patterns, sludge retention time, temperature, mixing and pH. Since mixing has been shown to have a large positive impact on digestion efficiency, most commercial large-scale digesters have a continuous mixing system. The effect of mixing on anaerobic digestion has been investigated from several perspectives [6–9]. The most notable positive effects of mixing are: (1) the dispersion of the substrate for better contact with microorganisms; (2) making the sludge temperature uniform and (3) the reduction of scum and deposits formation. It has been reported that efficient mixing promotes methane production and the destruction of volatile solids (VS), and that that digesters without mixing do not as well [8,10,11]. Further, studies focused on large-scale sewage sludge digesters have shown that inadequate mixing causes solid deposition and scum formation, resulting in short-circuiting [11]. The same is true for small-scale digesters since most do not have mechanical devices to mix and uniformly feed materials. Conventional small-scale digesters have been found to have a large amount of dead space [12], which leads to reduced actual HRTs compared to the calculated HRTs and, consequently, poor performance [1]. The dead space created is thought to be due to accumulated deposits, a scum layer and the digester configuration itself [12]. In this context, there is a clear need for a simple inexpensive small-scale digester design capable of mixing the materials fed. A simple powerless mixing system using a siphon flow, which enables the successful operation of anaerobic digestion [13], is thought to have much potential for use in small-scale digesters. A fluid dynamics analysis has shown a significant improvement in sludge mixing when the reactor is mixed by the siphon flow [14]. As such, this mixing system is expected to enhance digestion performance and avoid stratification, without creating excessive costs. However, the previous studies [13,14] did not adequately assess the advantages of the siphon mixed reactor (SMR) over the standard unmixed reactor. In addition, there is a need to examine a difference between the SMR and the continuously
Energies 2013, 6
4209
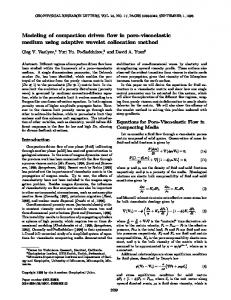
mixed reactor (CMR), in order to determine whether siphon mixing is actually capable of serving as a substitute for the commonly used digesters with continuous mechanical mixing. The present study is aimed to examine the effect of mixing by siphon flow on: (1) the digestion performance, (2) the sludge distribution characteristics and (3) the microbial community structure in parallel experiments using an SMR, an unmixed reactor and a CMR. The three types of reactors were operated semi-continuously with different mixing modes: siphon mixing, unmixing and continuous mixing by impellers. The advantages and limitations of siphon mixing were determined. 2. Results and Discussion 2.1. Acceptable Organic Loading Rates and Hydraulic Retention Time Figure 1 illustrates the time course of the HRT of the feedstocks, the organic loading rate (OLR) (kg-COD/m3/day) and the gas production rate per reactor volume (L/L/day). The graphs show the operation period after an approximately 3 months start-up at a HRT of 60 days (data not shown). The HRT was gradually shortened from 30 days (Phase 1) to 15 days (Phase 2), 10 days (Phase 3) and 7.5 days (Phase 4) by changing the on-off interval of the timers for the feed pumps. Figure 1. Time course of HRT, OLR and the biogas production rate.
Energies 2013, 6
4210
The OLR ranged from 2.9 to 3.8 kg-COD/m3/day (Phase 1); from 6.9 to 8.7 kg-COD/m3/day (Phase 2); from 8.9 to 12.6 kg-COD/m3/day (Phase 3) and from 11.9 to 18.2 kg-COD/m3/day (Phase 4), respectively. Since gas production rate of the CMR became stable earlier than the SMR and UMR, the duration of each phase were relatively shortened in the CMR. During Phases 1 and 2, all the three reactors maintained active gas production, with the gas production rates increasing with shorter HRTs. The frequency of siphon mixing depends on biogas production rate in the C1 [13]. In this case, mixing occurred approximately five times (Phase 1) and 10 times (Phase 2) per day in the SMR. The pH in the effluent sludge was kept within the range between 7.0 and 8.0 in each reactor throughout Phases 1 and 2. The VFA concentrations in the effluent sludge ranged from almost 0 to 94 mg/L as acetate (SMR); from almost 0 to 89 mg/L as acetate (UMR); from 42 to 460 mg/L as acetate (CMR). The CMR showed the highest level of VFA among the three reactors. This is possibly due to one of the negative effects of continuous stirring: the disruption of microbial flocs and obstruction of VFA degradation by symbiotic microflora [6,15]. It can be assumed that the unstirred UMR and intermittently stirred SMR had less risk of such floc disruption. It has been reported that intermittent stirring reduces the VFA level [6]. Furthermore, compared with the CMR, the multi-compartmental structure of the SMR and UMR appears to help to avoid short-circuiting, allowing insufficiently digested sludge to pour out. During Phases 1 and 2, the alkalinity levels in the effluent sludge from each reactor were above 3750 mg/L as CaCO3, therefore the VFA to alkalinity ratios (VFA/ALK) in the effluent sludge were maintained at a level below 0.09. The VFA/ALK is commonly used to evaluate the stability of anaerobic processes [16], and the process can be considered unstable if the VFA/ALK value exceeds 0.4. From these results, it can be concluded that all three reactors achieved successful operations during Phases 1 and 2. During Phase 3, the UMR showed a different trend from that of the other two reactors. As soon as the HRT was shortened from 15 days to 10 days, the gas production rate of the UMR gradually decreased, and finally, the gas production almost completely stopped (Figure 1). At this time, the sludge pH of C1 and C2 had fallen below 4.0, and that of C3 was also relatively low level, below 7.0. The VFA concentrations were more than 6000 mg/L in the form of acetate in compartments C1, C2 and C3. This clearly indicates that the gas stop of the UMR was due to acidification in the whole reactor. The pH level tended to rise, and the VFA concentration tended to decrease with distance from the inlet. As described above, the sludge pH of C1 had already dropped to around 4 during Phase 2. The acidification appeared to spread from the C1 throughout the entire the reactor with the stream. This type of VFA and pH pattern has often been observed in plug flow reactors [17–19]. The feedstock is firstly hydrolyzed and fermented to VFA by acidogenic bacteria, and is converted into acetate and H2 by acetogenic bacteria, and is finally fermented to methane by methanogenic archaea. Hence, acidogenesis as a first-stage reaction tends to be relatively more active in the front part close to the inlet. In contrast to the UMR, the SMR and CMR maintained active methane production during Phase 3. The VFA concentrations in the effluent were kept at a low level below 300 mg/L as acetate, and the VFA/ALK was below 0.07 in the SMR and CMR. These results strongly suggest that siphon mixing resulted in an expansion of the acceptable ranges of OLR and HRT.
Energies 2013, 6
4211
Subsequently, Phase 4 operation was characterized by difficulties in the SMR and CMR. Two weeks after the HRT was shortened to 7.5 days, the VFA concentration in the CMR began to increase. The gas production rate decreased in accordance with the increase in VFA. When the VFA concentration reached 8000 mg/L as acetate and the pH dropped to 5.1, the gas production of the CMR almost stopped. The maximum OLR for wet anaerobic digestion of food waste was investigated by Nagao [20], who reported that the theoretical maximum OLR of the mesophilic CMR was 17.0 kg-COD/m3/day (10.5 kg-VS/m3/day) under SRT 60 days and HRT 8 days. In the case of this study, the CMR began unstable operation at an OLR of 15.5–16.0 kg-COD/m3/day, close to the maximum OLR reported by Nagao. As such, it is likely that the CMR was disrupted by overloading during Phase 4. As such, the SMR is the only reactor that continued active biogas production throughout the experiment. However, there was another problem with the SMR during Phase 4. As soon as the HRT was shortened to 7.5 days, the SMR experienced a significant increase in floating scum layer in the upper part of the compartments of C2 and C3. There was no such layer in the reactor during Phases 1 and 2. Scum began to appear late in the Phase 3 period. The depth of the scum plus the sludge during Phase 4 was typically 45 cm, whereas it was about 35–37 cm during Phases 1 and 2, implying the scum layer on the sludge surface was approximately 10 cm thick during Phase 4. This result was quite different from that obtained in our previous study [13], which involved the use of an artificial food waste feedstock. In this previous study, no scum formation was observed in the SMR during the OLR of 5–10 kg-COD/m3/day. The scum formation potential is likely to depend on the change of sludge characteristics, and in this case, due to an increase in the OLR level. There is a report that scum forming potential in an anaerobic digester is correlated with HRT shortening [21]. The HRT shortening resulted in an increase in biogas production, and a decrease in the degradation of organic matter such as proteins and lipids in the anaerobic sludge. The former can promote a flotation of organic materials, potentially forming a scum, and the latter increases the amount of organic materials which surface. Our finding, which was characterized by the increase in scum formation depending on the HRT shortening, seems to be consistence with the results reported by Halalsheha [21]. On the other hand, the frequency of siphon mixing increased according to the increase in OLR. Although mixing occurred only five times per day during Phase 1, it increased to about 15–20 times per day during Phase 4. It is well known that mixing reduces scum formation, but in this case, the mixing in the SMR does not seem to have been sufficient to avoid scum formation under the very high OLR. The scum taken from the upper part of the SMR was analyzed. The COD of the scum was 88.2 g/L, which was 200%–300% higher than the underlying sludge. This suggests that a significant part of organic matter fed as substrate accumulated in the upper part of the reactor. Furthermore, a slight increase in the sedimented solids was observed at the front part of the SMR after the HRT was shortened to 7.5 days. Therefore, the mixing occurred in the SMR seems to be insufficient for solid dispersion. However, this is possibly the reason why the SMR was the only reactor avoided serious acidification during Phase 4. The 7.5 days of HRT is too short for continuous cultivation of methanogens because the growth rates of methanogens are generally slow, and finally, a short HRT would wash out large amount of the methanogens. Perhaps decrease in methanogens population led to the VFA accumulation in the CMR during Phase 4. On the other hand, relatively poor mixing likely enabled the SMR to retain larger amount of methanogens in the reactor, which resulted in higher methanogenic activity.
Energies 2013, 6
4212
2.2. COD Reduction and Methane Conversion Table 1 summarizes the digestion performance of each reactor at different HRT conditions. The data in the table are the average values during the period after a time equivalent to each HRT. The RedCOD decreased with shortened HRT in all the reactors. Under the same HRT, the RedCOD levels of the SMR and UMR were a little higher than those of the CMR. On average, the SMR and UMR were around 90% (Phase 1), 82.6% and 81.3% (Phase 2), 82.1% (Phase 3) of the RedCOD, while the CMR was 83.1% (Phase 1), 80.2% (Phase 2), 67.1% (Phase 3) of the RedCOD. Especially during Phase 3, there was a large difference in the RedCOD between the SMR and CMR. The methane production rates of the three reactors increased according to the shortened HRT. In contrast, the MeCOD decreased according to the shortening of the HRT. The methane production rate and the MeCOD of the SMR were clearly larger than those of the UMR under the same HRT conditions, and were moreover, comparable to those of the CMR. This indicates that the siphon installation made a contribution to improving methane yield. In the literature, methane yields from food waste were defined as ml per gram of VS added, and the values previously reported were within 350–450 ml/g-VS added under a long HRT more than 20 days [20,22]. The methane yields of SMR were on average 374 Nml/g-VS added (Phase 1) and 337 N ml/g-VS added (Phase 2), which were almost in the range reported by other researchers. This demonstrates the validity of the performance of the SMR, and verifies that the SMR was able to produce a sufficient amount of methane from the food waste. Table 1. Summary of the digestion performance of the three reactors with the different HRT conditions investigated. Reactor HRT (d)
SMR 30
15
UMR 10
7.5
30
CMR 15
30
15
10
COD in the effluent sludge (g/L)
7.1 ± 1.1 23.0 ± 7.4 18.1 ± 7.7 26.0 ± 4.2 10.9 ± 2.6 22.3 ± 7.9 20.1 ± 1.6 18.3 ± 1.6 33.5 ± 5.2
COD reduction rate (RedCOD) (%)
93.2 ± 1.4 82.6 ± 5.4 82.1 ± 6.2 73.9 ± 6.0 89.8 ± 2.4 81.3 ± 8.3 83.1 ± 2.7 80.2 ± 4.0 67.1 ± 3.4
Methane production rate (L/L/day)
1.1 ± 0.1
2.1 ± 0.2
2.5 ± 0.3 3.7 ± 0.5 0.9 ± 0.2
1.6 ± 0.3
1.1 ± 0.1
1.8 ± 0.2
2.7 ± 0.3
Methane conversion 92.1 ± 7.5 83.4 ± 2.1 71.0 ± 10.2 67.9 ± 7.7 75.1 ± 10.9 63.3 ± 14.3 83.6 ± 9.2 81.2 ± 11.5 71.5 ± 3.2 rate (MeCOD) (%) Total COD recovery 99.0 ± 8.4 102.0 ± 11.2 88.9 ± 9.9 89.2 ± 8.2 85.6 ± 11.9 84.0 ± 17.0 102.0 ± 10 100.3 ± 11.9 102.8 ± 8.0 efficiency (RecCOD) (%)
From what was discussed above, the UMR was characterized by a higher RedCOD and the lower methane production rate than those of the CMR. However, generally RedCOD and methane production are similarly inclined because methane production is mainly responsible for COD reduction in usual anaerobic digestion. In addition, the UMR was marked by the RecCOD, which was significantly lower than 100%. This suggests the possibility that a part of the organic matter added had been retained in the reactor for a longer time than the HRT. This may explain the higher RedCOD and the lower methane production rate of the UMR. On the contrary, the CMR had almost 100% RecCOD throughout all the Phases, indicating that the added COD and recovered COD as the effluent and methane were
Energies 2013, 6
4213
sufficiently. In the case of SMR, almost 100% of the RecCOD was obtained during Phases 1 and 2, while about 89% of the RecCOD was obtained during Phases 3 and 4. This is probably because there was an accumulation of organic matter as COD inside the reactor during Phase 3 and 4 operations. One of the possible reasons for this COD accumulation has already been described above: the significant scum formation in the SMR may well have been responsible. However, the SMR was found to be able to have a COD recovery as high as the CMR at longer HRTs. In this respect, the SMR has an advantage over the UMR. 2.3. VFA, Alkalinity and Solid Distribution inside The Reactors The variation patterns of VFA and alkalinity in the SMR and UMR are summarized in Figure 2. The data in the figure were the average values of two or three samples taken during each Phase, respectively. The characters (P1–P9) in the graphs represent sampling ports where the sludge was taken. As clearly shown, there was a great difference in the variation patterns between the SMR and UMR. In the SMR, although the data are not shown in the figure, each of the pH values at the nine ports was the same under the same HRT, and the pH levels slightly dropped from 7.8 to 7.2 on average as the HRT was shortened from 30 days to 10 days, but the pH increased a little again to 7.5 on average when HRT was 7.5 days. The VFA variation pattern in the SMR showed a very similar trend to the pH. The VFA was maintained at low levels in the entire reactor throughout the experiment. Although a little increase in VFA to 3330 mg/L as acetate was observed at P2 during Phase 4, the concentrations were, in most cases, below 1300 mg/L as acetate in the whole SMR. Unlike the VFA, the alkalinity levels of SMR changed depending on HRT. However, under the same HRT, there was no significant difference in the values among P1–P9. The average alkalinity level decreased according to the shortening of HRT from 30 to 10 days, while the level increased again at HRT 7.5 days, which is a similar trend to that of the pH. Alkalinity is affected by various factors such as NH4+, dissolved CO2 and VFA. The NH4+ and VFA concentration in the reactors were different in the different phases while there was no significant difference in the CO2 partial pressure between the four phases. Especially, the NH4+-N level in the effluent sludge was low (around 1600 mg/L) only during Phase 3, whereas that was within the range from 2600 to 3400 mg/L during the other phases. NH4+ production mostly depend on the anaerobic degradation of organic matter, and therefore, the lower N content in the food wastes used during Phase 3 likely led to a decrease in both the alkalinity and pH level. The VFA/ALK ranges of the SMR were as follows: