RINP 233
No. of Pages 3, Model 5G
19 December 2015 Results in Physics xxx (2015) xxx–xxx 1
Contents lists available at ScienceDirect
Results in Physics journal homepage: www.journals.elsevier.com/results-in-physics 5 6 3 4 7 8 9 10 11 12
13 1 2 5 6 16 17 18 19 20 21 22 23 24 25
Effect of nanoTiO2 dopant on electrical properties of SR8100/nanoTiO2 PMNC Sabah Mohammed Mlkat Al-Mutoki a,⇑, Ahmad Ghanim Wadday b, Ali Abdulabbas Abdullah b, Baydaa Abdul-Hassan Khalaf Al-Ghzawi c, Emad A. Jaffar Al-Mulla d,⇑ a
Electrical Department, Al Furat Al Awsat University, Technical Institute of Samawa, Samawa, Iraq Electrical Department, Al Furat Al Awsat University, Al-Najaf Engineering Technical College, Najaf, Iraq Mechanical Department, Al Furat Al Awsat University, Technical Institute of Samawa, Samawa, Iraq d Department of Chemistry, Faculty of Science, University of Kufa, P.O. Box 21, An-Najaf 54001, Iraq b c
a r t i c l e
i n f o
Article history: Received 22 November 2015 Accepted 5 December 2015 Available online xxxx Keywords: PMNC Hot vibration dispersion Electrical properties Ceramic oxide nano fillers
a b s t r a c t To increase the electrical conductivity of SR8100 epoxy, it was doped with nTiO2 nano filler. The specimen made of SR8100/nanoTiO2 PMNC with nanoTiO2 content ranges from 1 to 5 wt% with 1% step prepared by hot vibrate dispersion (HVD). Morphology changes in polymer were detected by XRD and it has been found that SR8100 begins to have a crystalline nature when nanoTiO2 concentration was 3%, 4% and 5%. Electrical resistivity decreases from 2.3*10 4 Ω m for SR8100 down to 1*10 9 Ω m SR8100/5% nanoTiO2 PMNC which means that the material turns from an insulator to a semiconductor. Ó 2015 Published by Elsevier B.V. This is an open access article under the CC BY-NC-ND license (http:// creativecommons.org/licenses/by-nc-nd/4.0/).
27 28 29 30 31 32 33 34
35 36 37
Introduction
38
During the recent decade polymer doped with ceramic oxide nano filler composite has received a great attention due to their interesting electrical and electronic properties [1–3]. Nano particle ceramic oxide fillers including TiO2, SiO2, and Al2O3 have previously been shown to have a significant effect on the electrical properties of polymers [4,5]. In some cases conductivity increases of more than one order of magnitude have been reported in several cases such as in crystalline PEO-based complexes. Ceramic oxide nano filler contributes to these enhancements by promoting the polymer structure [2,6–8]. In addition, most ceramic–polymer nanocomposites are easily fabricated and are usually of reduced weight compared to all-ceramic materials. These factors are of tremendous attractions in energy storage application. However, most ceramic nano fillers are difficult to distribute homogeneously in the polymer matrix and it results in the agglomeration, especially when the concentration of the ceramic nano fillers is high. The inhomogeneity has negative influences on the electric properties of the nanocomposites [9,10]. So far, much work has been made to improve the dispersion of ceramic nano fillers in
39 40 41 42 43 44 45 46 47 48 49 50 51 52 53 54 55 56
⇑ Corresponding authors. E-mail addresses:
[email protected] (S.M.M. Al-Mutoki), imad.almulla@ uokufa.edu.iq (E.A.J. Al-Mulla).
the polymer matrix [11–17]. SR8100 is a promising polymer with good mechanical properties and low cost produced by Sicomen company in USA, electrical resistivity of this polymer is 1*10 9 Ω m [18]. Nano titania nanoTiO2 on the other hand is one of the most widely nano ceramic oxide fillers used with an electrical resistivity of 1*1013 Ω m [19–22]. Modification effect of m-TiO2/silicon rubber composite on electrical properties was investigated. It was found that this addition leads to a decrease in both dielectric loss and resistivity of the composites. This can be taken charge by the much uniform dispersion state of m-TiO2 as well as an enhanced interaction with SR matrix [23]. Aim of this research is to prepare a new PMNC made of SR8100 matrix, and nanoTiO2 dopant with five different weight percent. PMNC was prepared using hot vibration dispersion method to ensure a good dispersion for the nanoTiO2 through the SR8100 matrix, the effect of this dopant on morphology, electrical resistivity, and electrical conductivity of the SR8100/nanoTiO2 PMNC was studied.
57
Experimental
74
Materials
75
SR8100 polymer containing resin and hardener was purchased from SICOMEN, USA (99.9%) and 10 nm TiO2 from HORIBA, Germany.
76
http://dx.doi.org/10.1016/j.rinp.2015.12.006 2211-3797/Ó 2015 Published by Elsevier B.V. This is an open access article under the CC BY-NC-ND license (http://creativecommons.org/licenses/by-nc-nd/4.0/).
Please cite this article in press as: Al-Mutoki SMM et al. Effect of nanoTiO2 dopant on electrical properties of SR8100/nanoTiO2 PMNC. Results Phys (2015), http://dx.doi.org/10.1016/j.rinp.2015.12.006
58 59 60 61 62 63 64 65 66 67 68 69 70 71 72 73
77 78
RINP 233
No. of Pages 3, Model 5G
19 December 2015 2
S.M.M. Al-Mutoki et al. / Results in Physics xxx (2015) xxx–xxx
put in 1*1 cm cylindrical mould with a moving base, on the base the TiO2 nano powder was spread, the mould then was heated up to 120 °C and vibrated ultrasonically for 1hr to ensure a uniform dispersion of TiO2 nano particles in the SR8100 polymer matrix, then it was left to cool down to room temperature. The specimen was tested by XRD to detect their properties.
84
Results and discussion
90
Among all the ceramic oxide nano fillers nanoTiO2 exerted the highest effect on the PMNCs especially on the electrical properties, this improvement in electrical properties was observed for nanoTiO2. Filled polymers could be due to one and/or more of the following factors (i) the large surface area of nano particles which creates a large interaction zone or region of altered polymer behaviour, (ii) change in the polymer morphology due to the surfaces of nano particles, (iii) a reduction in the internal field caused by the decrease in the size of the particles, (iv) change in the space charge distribution, (v) scattering mechanism [23–25]. This brief introduction will be very useful all over our discussion.
91
SR8100/nanoTiO2 PMNCs morphology
102
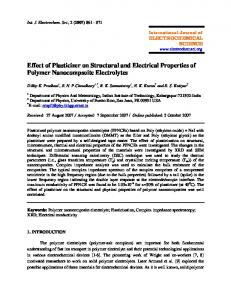
X-ray diffraction (XRD) was used to investigate changes in SR8100 polymer matrix after the addition of 1–5% weight percent of nanoTiO2 ceramic oxide nano filler, results are shown in Fig. 1. Fig. 1 illustrates XRD of SR8100 and SR8100/nanoTiO2 PMNCs with nanoTiO2 weight percent from 1% to 5%, respectively. It is obvious that the starting material is amorphous with no peaks on XRD. Peaks begin to appear when nanoTiO2 concentration exceeds 3% weight and become very clear at the top three specimens where nanoTiO2 is equal to 3%, 4% and 5% weight . XRD also indicates that these peaks are related to the presence of nanoTiO2 rutile, and nanoTiO2 anatase. The last may be found as an impurity in the starting material, or it may be produced by the action of fabrication method due to the vibrating and heating of SR8100 polymer leading to release of some internal energy causing this phase transition. Never the less nanoTiO2 anatase presence leads us to expect some unusual changes in the properties of the SR8100/nanoTiO2 PMNCs [23,24]. Table 1 shows lattice parameters of nanoTiO2 rutile, and anatase respectively. From data given in Table 1 we clearly see that the cubic shape of nanoTiO2 rutile, and anatase is reserved where a = b = c and this equal to 4.2696 Å for rutile, and 5.6402 Å for
103
85 86 87 88 89
92 93 94 95 96 97 98 99 100 101
Fig. 1. XRD of SR8100/nanoTiO2 PMNCs.
Table 1 Lattice parameters of nanoTiO2 rutile, nanoTiO2 anatase. Lattice parameter
nTiO2 rutile
nTiO2 anatase
Lattice S.G a=b=c a/b = a/c a=b=c Z Mol. weight Volum [CD] Dx Dm l/lcor
Cubic Pn3m (224) 4.26960 Å 1.00000 90° 2 143.09 77.83 6.106 – –
Cubic Fm3m (225) 5.64020 Å 1.00000 90° 4 58.44 179.4 2.163 2 4.40
79
Method of preparation
80
Polymer matrix discs were prepared using mould with 1 cm diameter, and 1 cm height, resin and hardener was mixed by 1:3, stirred by a magnetic stirrer for 5 min, then it was poured into the mould leaving for 24 h. After solidification the polymer discs
81 82 83
Fig. 2. FTIR of SR8100/nTiO2 PMNC.
Please cite this article in press as: Al-Mutoki SMM et al. Effect of nanoTiO2 dopant on electrical properties of SR8100/nanoTiO2 PMNC. Results Phys (2015), http://dx.doi.org/10.1016/j.rinp.2015.12.006
104 105 106 107 108 109 110 111 112 113 114 115 116 117 118 119 120 121 122 123
RINP 233
No. of Pages 3, Model 5G
19 December 2015 S.M.M. Al-Mutoki et al. / Results in Physics xxx (2015) xxx–xxx Table 2 Electrical resistivity of SR8100, nTiO2, and SR8100/nTiO2 PMNC. Specimen Number 1 2 3 4 5 6 7
Specimen composition SR8100 nTiO2 SR8100 + 1% SR8100 + 2% SR8100 + 3% SR8100 + 4% SR8100 + 5%
Resistivity (Ω m) 9
nTiO2 n TiO2 n TiO2 n TiO2 n TiO2
1*10 1*10 13 8.21*10 3*10 7 4.65*10 5.71*10 2.30*10
8
5 4 4
Table 3 Electrical resistivity of Ti–O system. Ti–O system 1 2 3 4 5 6 7 8 9
Chemical formula TiO2 Ti8O5 Ti6O11 Ti5O9 + Ti6O11 Ti5O9 Ti4O7 + Ti5O9 Ti4O7 Ti3O5 + Ti4O7 Ti3O5
Resistivity (Ω m) 1*10 4*10 2 1.6*10 2*10 3 1.6*10 3*10 3 9.7*10 2.4*10 1.6*10
3
4
3
Electrical resistivity
134
141
Electrical resistivity of SR8100/nanoTiO2 PMNCs was measured using meager device; the results are listed in Table 2. In the present work electrical resistivity of SR8100/nanoTiO2 PMNCs increased from 1*10 9 Ω m for pure SR8100 polymer matrix up to 2.3*10 4 Ω m to SR8100/5%nanoTiO2 PMNC. This means that the material turns from being an insulator to a semiconductor, where the limit of semiconductors is 10 6 < , < 105 Ω m [27–33]. This can be explained through two point views.
142
1st quantum theory
143
157
This huge enhance in conductivity of the SR8100/nanoTiO2 PMNC can be related to the presence of electrons near HOMO, and LUMO regions which means more excited electrons in LUMO region, and this can be seen from resistivity values in Table 1 where we can see a huge transition in conductivity values due to the decrease in resistivity. This result was also certified by peaks in XRD (see Fig. 1) where PMNC reaches a stable crystalline structure. Crystallinity came from oxygen voids within the polymer due to the vibration during specimen preparation by hot vibrate dispersion and this leads to formation of a bend in energy levels creating several new energy sublevels in the material as we mentioned earlier in the introduction of our discussion. These new energy levels make electron transition more easy and hence increase electrical conductivity. So far this is a very interesting result and very important in several applications which we shall work on in the future.
158
2nd Ti–O system
159
The Ti–O system has several forms beside TiO2, each form has a different electrical resistivity. These forms are illustrated in Table 3 [25].
127 128 129 130 131
135 136 137 138 139 140
144 145 146 147 148 149 150 151 152 153 154 155 156
Uncited reference
176
163 164 165 166 167 168 169 170 171 172 173 174 175
[26].
177
Acknowledgment
178
All technical staff in both Electrical Department and Mechanical Department, Al Furat Al Awsat University, Technical Institute of Samawa, Samawa, Iraq are greatly acknowledged for their assistance.
179
References
183
3
133
126
162
2
132
125
As it is clear from the table above there are nine values for electrical resistivity within the Ti–O system range from 1013 for nanoTiO2 to 7.9*10 4, this means that several forms of Ti–O system lie in the region of semiconductor material and this may explain resistivity values in Table 2. Oxygen concentration will also increase due to the hot vibrate dispersion technique of SR8100/nanoTiO2 PMNC because of the combined action of ultrasonic, heating, and extra low particle size and very high surface area of nanoTiO2 all these factors together will lead to form one or more of Ti–O system components, and this will decrease electrical resistivity of the produced PMNC. In addition to these two point views, this behaviour can be taken charge by the much uniform dispersion state of nTiO2 as well as an enhanced interaction with SR matrix [23].
13
anatase, according to this fact we must consider an important fact that there will be different stretching values in the polymer structure caused by the difference in the dimension of cubic nanoTiO2 rutile and anatase leading to a high changes in energy levels within the SR8100/nanoTiO2 PMNCs which will have an effect on the resultant electrical properties of the specimen. Fig. 2 illustrates FTIR of SR8100/TiO2 PMNC. Peaks at 1427, 1635 refer to phases where SR8100 epoxy is dominant, while peaks at 3587, 3525, and 3464 are places where nTiO2 concentrate [28].
124
3
[1] [2] [3] [4]
[5] [6] [7] [8] [9] [10] [11] [12] [13] [14] [15] [16] [17] [18] [19] [20] [21] [22] [23] [24] [25] [26] [27] [28] [29] [30] [31] [32] [33]
Li H, Zhang Y, Huang W. Nano Biomed Eng 2010;2(2):143–8. Lee EJH, Ribeiro C. Giraldi. Appl Phys Lett 2004;84:1745–7. Nienhaus H, Kravets V, Koutouzov S. J Vac Sci Technol B 2006;24:1156–61. Szabó DV, Schlabach S, Ochs R. Analytical TEM investigations of size effects in SnO2 nanoparticles produced by microwave plasma synthesis. Microsc Microanal 2007;13:430–1. Suresh A, Mayo MJ, Porter WD. J Mater Res 2003;18:2912–21. Li S, Zheng WT, Jiang Q. Size and pressure effects on solid transition temperatures of ZrO2. Scr Mater 2008;24:2091–4. Zhang H, Banfield JF. J Mater Chem 1998;8:2073–6. Schlabach S, Szabó DV, Vollath D. J Appl Phys 2006;100. 024305:1–024305:9. Szabó DV, Schlabach S, Vollath D. J Alloy Compd 2012;434:590. Zhang M, Lin G, Dong C, Wen L. Surf Coat Technol 2007;201:7252–8. Jiang C, Wei M, Qi Z. J Power Sources 2009;166:239–43. Jiang CH, Honma I, Kudo T, Zhou HS. Electrochem Solid-State Lett 2007;10: A127–9. Deng D, Kim MG, Lee JY, Cho J. Energy Environ Sci 2009;2:818–37. Chattopadhyay S, Ayyub P, Palkar VR, Gurjar AV, Wankar RM, Multani M. J Phys-Condens Matter 1997;9:8135–45. Yan T, Shen ZG, Zhang WW, Chen JF. Mater Chem Phys 2006;98:450–5. Wada S, Hoshina T, Yasuno H, Ohishi MM, Kakemoto H, Tsurumi T, Yashima M. Key Eng Mater 2013;301:27–30. Caseri WR. Mater Sci Technol 2006;22:807–17. Schadler LS, Brinson LC, Sawyer WGJ. J Miner Met Mater Soc 2007;59:53–60. Schadler LS, Kumar SK, Benicewicz BC, Lewis SL, Harton SE. Mater Res Bull 2007;32:335–40. Macosko CW. NewYork, NY, USA: VCH Publisher; 1994. Mezger TR. 2nd ed. Hannover, Germany: Vincentz Network; 2006. Vollath D, Szabó DV, Seith B. German Patent DE 196 38 601 C1; 1996. Zhi-Min Dang, Yu-Juan Xia, Jinbo Bai. Mater Lett 2011;65(23):3430–2. Nelson KJ. New York: Springer; 2009. Tuncer E, Polizos G, Sauers I, James DR, Ellis AR, More KL. J Exp Nanosci 2011;7:274–81. Cherney EA. Nashville, 16–19 October 2005, p. 1, 9. Tan DQ, Cao Y, Irwin P. Winchester, 8–13 July 2007, pp. 411–414. Al-Mutoki SMM, Al-Ghzawi BAK, Abdullah AA, AlAmmar AIR, Al-Mulla EAJ. Nano Biomed Eng 2015;7(4):135–8. Kim P, Jones SC, Hotchkiss PJ, Haddock JN, Kippelen B, Marder SR, Perry JW. Adv Mater 2007;19:1001–5. Yunus WMZ, Ibrahim NAB, Rahman MZA. Polym Polym Comp 2010;18:451–9. Shemmari FA, Rabah AA. Rendiconti Lincei Scienze Fisiche E Naturali 2014;25:409–13. Mohammed TA, Abd Khadir NK. J Oleo Sci 2014;63:193–200. Yang H, Ge Z, Zou C, Shen G. Nano Biomed Eng 2009;1(1):75–9.
180 181 182
184 185 186 187 188 189 190 191 192 193 194 195 196 197 198 199 200 201 202 203 204 205 206 207 208 209 210 211 212 213 214 215 216 217 218 219 220 221 222 223 224 225 226 227 228
160 161
Please cite this article in press as: Al-Mutoki SMM et al. Effect of nanoTiO2 dopant on electrical properties of SR8100/nanoTiO2 PMNC. Results Phys (2015), http://dx.doi.org/10.1016/j.rinp.2015.12.006