AJCS 10(4):460-469 (2016) DOI: 10.21475/ajcs.2016.10.04.p6970x
ISSN:1835-2707
Effect of organic amendments with varied C-N ratios on grain productivity and nitrous oxide (N2O) emission from wheat grown in alluvial soil Anushree Baruah, Nirmali Bordoloi, Kushal K. Baruah* Department of Environmental Science, Tezpur Central University, 784028, Assam, India *Corresponding author:
[email protected] Abstract Amendment of local organic residues has been gaining worldwide attention for mitigation of agricultural greenhouse gases. Four treatments having different C-N ratios, including conventional Nitrogenous fertilizer (NPK), Cow dung (C:N = 25:1), Rice straw (C:N = 41:1) and Poultry manure (C:N = 15:1) were applied in the field to measure nitrous oxide emission from wheat (Triticum aestivum) crop variety Sonalika. The static chamber method and gas chromatography were employed for the collection and analysis of N2O. The cumulative N2O emission flux (Esif) recorded for the first year 2010-2011 were 1.78, 1.34, 1.46 and 1.83 kg N2O- N ha-1while for 20112012 it was 1.95, 1.36, 1.77 and 1.88 kg N2O – N ha-1 for NPK, CD, RS and PM, respectively. In this study, application of cow dung resulted in lower seasonal N2O emission than conventional N-fertilizer application for both the years. The N2O emissions from different treatments exhibited a strong correlation (p < 0.01) with soil organic carbon (R11 = 0.7763 and R12 = 0.652), soil mineralized N, NH4+-N (R11= 0.5517 and R12 = 0.8424 and NO3- -N (R11= 0.814 and R12 = 0.8579) plant height and tiller numbers (R11 = 0.565 and R12 = 0.723, p < 0.01). Highest yield was recorded at poultry manure (PM) applied field (3.10 and 3.82t ha-1). Application of cow dung with C:N = 25: 1 in wheat field reduced N2O emission and may be considered a suitable treatment for mitigation of N2O from Wheat agriculture without compromising grain productivity. Keywords: Organic amendments; Wheat agriculture; grain yield; Nitrous oxide emission; C-N ratio. Abbreviations: C:N_carbon and nitrogen ratio; N2O_Nitrous oxide; NPK_Nitrogen-Phosphate-Potash fertilizer; CD_cow dung; RS_rice straw; PM_poultry manure; N_nitrogen; NH4+-N Ammonium-Nitrogen; NO3- -N Nitrate-Nitrogen. Introduction Nitrous oxide (N2O), a potent greenhouse gas, plays a significant role in climate change by depleting stratospheric ozone accounting for 6.24% of the overall radiative force (Forster et al., 2007; WMO, 2010). It has the third largest forcing of the anthropogenic gases, at 0.17 ± 0.03 Wm–2 with an increase of 6% since 2005 (AR5, IPCC, 2014). At present the atmospheric concentration of N2O is increasing linearly at the rate of 0.3% year-1 which has increased from 270 ± 7 ppbv in the pre - industrial era to approximately 324 ± 2 ppbv at present (Ussiri and Lal, 2013; AR-5, IPCC, 2014 ). An agricultural soil contributes about 60% of the total estimated global N2O emission to the atmosphere and is recognized as the largest anthropogenic source. With the growth of population worldwide, more food production from the agricultural sector will continue to raise the emission of N2O rapidly in coming decades. Therefore, adoption of various measures to mitigate nitrous oxide emission from the agricultural sector needs urgent attention. The judicious management of organic amendments has significant potential for the mitigation of greenhouse gas emission (Ghosh et al., 2012). Globally, soils are the major source of atmospheric N2O and microbial production in soils is the dominant source (Davidson, 2009). N2O can be produced from nitrification under aerobic conditions and denitrification (the reduction of NO3− to N2O and N2) under moderately
reducing conditions in soils (Mosier et al., 1998). Accordingly, the magnitude of N2O emission varies with soil moisture, temperature, aeration; nutrient availability, texture and cultivation practices (Baggs et al., 2000). Several of these parameters are affected by agricultural management practices including: the choice of cropping system, such as rice-wheat rotation, the addition of N fertilizer and the addition of organic matter. It has been reported by previous researchers that mitigating soil N2O emissions is a challenge for the research workers as it is governed by various cultivation, management as well as environmental factors. Huang et al., (2004), reported that the ratio of N2O emission to applied residual N increased with increasing C- N ratio of the residues. It has been identified that the incorporation of crop residues in soil provides a source of readily available C and N in the soil which influences the production and emission of N2O from soil (Khalil et al., 2007; Ma et al., 2009; Nishimura et al., 2011). The C-N ratio of organic material affects nitrification and the N2O/N2 ratio. It is likely that the addition of organic carbon will result in insufficient oxygen supply and reduce the activity of autotrophic nitrifying bacteria, which influences N2O emission. In addition, some studies revealed that cropping systems receiving high organic matter inputs have been characterized by greater microbial activity as well as greater N mineralization
460
compared to systems receiving only mineral fertilizer – N (Gunapala and Scow, 1998; Kramer et al., 2002; Kong et al., 2010) and decayed crop straw may produce chemical compounds which can significantly reduce N2O emissions from the soil (Zhou et al., 2004). Rice – wheat farming system is one of the important cultivation practices over the world and provides food and economic security to millions of farmers in the Indo – Gangetic plains of south- east Asia (Datta et al., 2011). The north - eastern part of India is predominantly agriculture dependent and is the main livelihood of the people in this region. The impact of agricultural management particularly C-N management of organic fertilizers on N2O emissions from this region of India are not well documented. In view of this, a field measurement of nitrous oxide (N2O) emission in wheat ecosystem was conducted with various organic amendments having different C and N contents to evaluate the appropriate C-N ratio which can possibly help reduce the N2O emission from wheat agriculture. The major objective of this study was to evaluate the impact of organic amendments on grain yield and nitrous oxide emission from field grown with wheat. Moreover, we made an attempt to explain the relationship of N2O emission with various soil factors and wheat grain productivity under the substitution of chemical fertilizers.
any fertilizer/ amendments and plants. The emission from the barren land did not show any high peak during both the years. The emission from the barren field ranged from 37.71 – 56.30 N2O – N µgm m-2 hr-1 with cumulative N2O emission (Esif) of 1.37 ± 0.61 kg N2O–N ha-1for 2010 – 2011 and 40.92 - 62.83 N2O – N µgm m-2 hr-1 with Esif of 1.34 ± 0.48 kg N2O–N ha-1 for 2011 – 2012 (Fig 5) Effect on soil moisture, total carbon, soil organic carbon and total soil mineral N Soil moisture content of the field varied from 23 to 41% during 2010 – 2011 (Fig 6a) and in 2011 – 2012 from 22 to 42 % (Fig 6b). In the initial period (up to 28 DAS) the soil had considerable quantity of moisture (more than 35%) and then the soil moisture slowly decreased to a minimum level at mid season. After 63 DAS the moisture content of the field started to increase and gain a maximum of about 35 – 42% in both the years. In the post harvest period the moisture content again increased owing to heavy rainfall. Statistical analysis did not show any correlation (R11 = -0.23 and R12 = 0.40, p > 0.05) between moisture content of soil and N2O-N emission (µg m-2 hr-1). Higher emissions were recorded when there was low moisture in the field. The total carbon content of the soils under different treatments ranged from 1.90 – 2.87 % in 2010 -2011 and 1.97 to 2.96% in 2011 – 2012. Although the total carbon content in the soils under application of different treatments showed a considerable amount of variation but did not exhibit any correlation with N2O – N emission (R11= 0.2403 and R12 = 0.2929, p > 0.05) for both the years. Total organic carbon contents of the soil ranged from 0.80 – 1.46 % in 2010 – 2011 and 0.96 – 1.68 % in 2011 – 2012 (Fig 7). Organic carbon content of the experimental site was initially low, reached a maximum at active vegetative growth stage and at panicle initiation stage. Thereafter a decreasing trend was observed and the organic carbon content in the soil under all the treatments remained fairly constant during the rest of the crop growing season up to the crop harvest. N2O- N emission recorded good correlation with soil organic carbon (R11 = 0.7763 and R12 = 0.652, p < 0.01) (Fig 8a). High peaks of N2O emission were supported by an increase in the organic carbon percentage in soil. Over the crop growing season in both the years, soil mineral N (Nitrate, NO3-and ammonium, NH4+) exhibited a good correlation with N2O-N emissions. Significant interaction of soil NO3—N(R 11= 0.814, p < 0.01 and R12 = 0.858, p < 0.01) and NH4+ –N(R11 = 0.552, p< 0.05 and R12 = 0.842, p< 0.01) with N2O emissions was presented in Fig. 8b and 8c, respectively. The soil nitrate content of the field ranged from 22.45 to 132.48 kg ha-1 in 2010–2011 and 24.70 to 127.99 kg ha-1 in 2011–2012. Soil ammonium content of the field ranged from 3.57 to 31.05 kg ha-1 in 2010–2011 and 4.23 to 47.88 kg ha-1 in 2011–2012.
Results Effect of Organic amendment on Nitrous oxide emission from Wheat The N2O emission from the wheat crop (variety - Sonalika) during the year 2010-2011(Fig 3a) wheat growing season varied from 31.55 to 116.56 N2O – N µgm m-2 hr-1 in NPK( T1), 15.42 to 93.03 N2O–N µgm m-2 hr-1 in cow dung ( T2), 18.23 to 131.99 N2O – N µgm m-2 hr-1 in rice straw ( T3), and 20.99 to 175.53 N2O – N µgm m-2 hr-1 in poultry manure ( T4). The highest cumulative N2O emission (Esif) was recorded from T4 with poultry manure (1.83 ± 0.61 kg N2O–N ha-1) followed by T1 (NPK = 1.78 ± 0.44 kg N2O–N ha-1), T3 (rice straw = 1.46 ± 0.49kg N2O–N ha-1) and lowest in T2 (cow dung = 1.34 ± 0.57kg N2O–N ha-1) (Fig 4). Similar variations also resulted during the second year (20112012) (Fig 3b) from the crop growing season with 25.35 – 125.27 N2O – N µgm m-2 hr-1 in T1, 18.91 – 91.23 N2O–N µgm m-2 hr-1 in T2, 23.67 – 128.67 N2O–N µgm m-2 hr-1 in T3 and 34.65 – 159.79 N2O – N µgm m-2 hr-1 in T4. Significant variations in the cumulative N2O emission (Esif) were recorded from all the treatments. However during the second year (i.e. 2011 – 2012) highest Esif was recorded from T1 (NPK = 1.95 ± 0.17 kg N2O–N ha-1) followed by T4 (1.88 ± 0.67kg N2O–N ha1 ), T3 (1.77 ± 0.94kg N2O–N ha-1) and T2 (1.36 ± 0.97kg N2O– N ha-1) (Fig 4). In both the years, the N2O emission started to increase gradually during the initial crop growing period in all the four treatments and the first high peak for T1 and T3 were recorded at 4 days after sowing (DAS) and in case of T2 and T4 on 7 DAS. The second high peaks for T1, T2 and T4 were recorded at 28 DAS and for T3 the peak was observed on 35 DAS. Irrespective of treatments the third high peak was recorded during panicle initiation stage and another peak was recorded during crop maturation stage. Field treated with cow dung, CD (C: N = 25:1) i.e. T2 resulted in lowest cumulative N2O emission in both the years. Along with the treated plots , the flux sampling was also measured from a barren plot without
Changes in plant growth parameters and yield Plant height and tiller numbers varied with the treatments during both the years. Plant height (cm) showed a positive correlation with N2O – N emissions (R11 = 0.517, p< 0.05 and R12 = 0.679, p< 0.01). There was an increase in tiller number up to 77 DAS (maximum tillering stage) during both the years of experimentation. Tiller number exhibited a good correlation
461
Table 1. Basic soil properties of the experimental field at 0 – 10 cm depth (mean ± standard deviation). Property Sand (%) 60.79 ± 0.61 Silt (%) 20.25 ± 0.83 Clay (%) 19.29 ± 0.96 pH 5.69 ± 0.17 Bulk density (gm cc-1) 1.21 ± 0.10 Cation Exchange Capacity (meq 100 g-1) 12.33 ± 0.96 Electrical conductivity (mmhos 100 g-1) 0.59 ± 0.03 Soil moisture content (%) 61.47 ± 2.64 Soil organic carbon (%) 0.98 ± 0.07 Total Carbon (mg g-1) 16.67 ± 2.70 Available nitrogen (kg ha-1) 114.76 ± 6.99 Available phosphorus (kg ha-1) 32.89 ± 4.51 Available potassium (kg ha-1) 175.85 ± 12.90
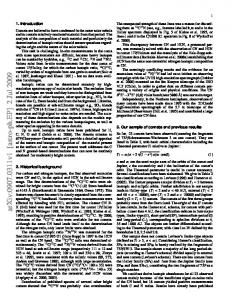
Fig 1. Map showing study area of North Bank Plain Zone of Tezpur, Assam, India. Table 2. Properties of the organic residues applied during both years of experimentation. Values are expressed in mg g -1 as given by CHN analyser. Treatment Fertilizer/ Organic residue Total C Total N C:N N applied @ 10t ha-1 -1 ---- mg g ---kg N ha-1 T2 T3 T4
Cow manure (CD) Rice straw (RS) Poultry manure (PM)
300.0 446.9 135.0
12.0 10.9 9.0
25 41 15
120 109 90
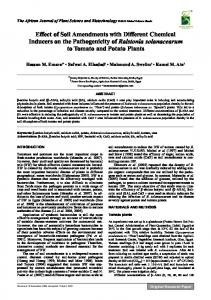
Fig 2. Daily precipitation and maximum and minimum air temperature during the crop growth period: (a) 2010 – 2011, (b) 2011- 2012 from December to April.
462
Table 3. Correlation coefficients of various parameters with N2O emission from both the years. Parameters 2010- 2011 2011 - 2012 Pearson Correlation (sig 2-tailed) Soil moisture (%) -0.238ns -0.401ns Soil total carbon content (%) 0.241ns 0.293ns Soil organic carbon (%) 0.776** 0.652** Soil NO3- - N (kg ha-1) 0.814** 0.858** Soil NH4+ - N (kg ha-1) 0.552* 0.842** Plant height (cm) 0.517* 0.679** Tiller number 0.565* 0.723** **Correlation is significant at the 0.01 level (2-tailed). * Correlation is significant at the 0.05 level (2-tailed).
Fig 3. Nitrous oxide fluxes N2O-N (µg m-2 h-1) from wheat under different treatments during (A) 2010 -2011 and (B) 2011 – 2012 (vertical bars represent standard error), T1 – NPK, T2- Cow dung (CD), T3 – Rice straw (RS) and T4 –Poultry manure (PM).
Table 4. Variations in Seasonal integrated flux (Esif), yield and yield attributing parameters of wheat under different treatments for both years of experimentation. 1000 grain Harvest Treatments Esif Panicle length Filled grain Sterility Yield weight index -2 mg N2O–N m cm % % gm t/ha 2010 -2011 NPK 177.94 c 9.82 ab 82.13 b 17.87 b 47.39 a 55.82 b 1.99 a CD 133.73 a 9.77 ab 88.39 b 11.32 a 57.50 b 57.27 b 2.08 a RS 145.67 b 8.07 a 72.70 a 23.90 c 44.74 a 42.16 a 1.45 a PM 182.81 c 11.43 b 85.12 b 14.31 ab 46.08 a 54.64 b 3.10 b 2011 – 2012 NPK 194.75 a 11.23bc 84.51 b 15.49 b 52.04 b 43.03 b 2.31 ab CD 135.57 b 12.07 c 90.43 c 9.57 a 63.73 c 44.08 bc 2.94 b RS 177.09 b 9.53 a 79.92 a 20.08 c 48.13 a 38.13 a 1.75 a PM 187.58 b 9.92 ab 89.20 c 10.80 a 64.58 c 48.33 c 3.82 c Note: In each column means with the same letter are not significantly different at p < 0.05 level by Duncan Multiple Range Test.
463
2011 -2012
2010 - 2011
A
PM (T4)
C RS (T3)
B B A
CD (T2)
NPK (T1)
0
40
80
120
160
200
NPK (T1)
CD (T2)
RS (T3)
PM (T4)
2011 -2012
194.75
135.57
177.09
187.58
2010 - 2011
177.94
133.73
145.67
182.81
Fig 4. Cumulative N2O flux, mg N2O-N m-2, (Esif) under application of different organic amendments for both the years of experimentation (vertical bars represent standard errors).
Fig 5. Nitrous oxide fluxes N2O-N (µg m-2 h-1) from barren land during both the years (vertical bars represent standard error).
Fig 6. Soil moisture content during the crop growth period in the year (A) 2010 – 2011 and (B) 2011 – 2012 (vertical bars represent standard error),T1 – NPK, T2- Cow dung (CD), T3 –Rice straw (RS) and T4 –Poultry manure (PM).
464
Fig 7. Soil organic carbon content (%) during the crop growth period for both the years of experimentation. (vertical bars represent standard error), T1 – NPK, T2- Cow dung (CD), T3 – Rice straw (RS) and T4 –Poultry manure (PM).
Fig 8. Correlation between N2O emission and (A) soil organic carbon, (B) NO 3- -N content of soil and (C) NH4+ -N content of soil, for both the years of experimentation.
465
with N2O - N emissions (R11 = 0.565 and R12 = 0.723, p < 0.01). The correlation coefficient of various parameters with N2O emission from both the years is shown in Table 3. Yield and yield attributing parameters were recorded after harvesting of the crop. The highest yield was recorded in T4 i.e. poultry manure (3.10 ± 0.45 t ha-1) followed by NPK, T1 (1.99 ± 0.29 t ha-1) and cow manure, T2 (2.08 ± 0.36t ha-1) respectively. The lowest yield was recorded in rice straw, T3 (1.45 ± 0.19t ha-1). In the second year (2011 – 2012), similar results were recorded with highest yield from T4, (3.82 ±0. 29 t ha-1) followed by T2 (2.95 ± 0.48 t ha-1) and T1 (2.31 ± 0.46t ha-1). The yield recorded at T3 (1.75 ± 0.42t ha-1) was the lowest. Variations in cumulative N2O emission (Esif) yield and yield attributing parameters of wheat under different treatments for both years of experimentation is shown in Table 4.
in decreased N2O emission due to a temporary immobilization of soil N, whereas low C-N ratio materials generally promote rapid mineralization after incorporation in soil leading to higher N2O emissions which may be the reason for higher N2O emission from the plots treated with T4 (C:N – 15:1) and these results are in conformity with the findings of Baggs et al., 2000. In the present investigation, high emissions of N2O-N were observed when the availability of organic carbon in the field was high. Denitrification is a facultative process that requires an extra source of organic C as electron donor. Hence the presence of available C would directly promote the growth of denitrifiers but it would also indirectly increase their activity by stimulating soil respiration and reducing O 2 availability in soil (Morley and Baggs, 2010). In our study we report a strong correlation of N2O emission with soil organic carbon and mineral N (NH4+ and NO3-). There are reports that an increase in soil organic carbon provides the carbon source to the microbial populations for carrying out nitrification and denitrification reactions, which influences the N2O emission (Tiedje et al., 1982; Baruah et al., 2012). Similar results have been corroborated by Huang et al., 2004; Toma and Hotana, 2007. In consequence to high C-N ratio, the microbes immobilize the soil nitrogen during the decomposition of residues. This microbial immobilization leads to the decrease in NH4+ and NO3- contents in the soils which are the precursors of N2O production (Zou et al., 2004). Our results on mineral nitrogen (NH4+ and NO3-) are in conformity with these findings. Soil nitrate–N and ammonium–N showed a fairly good correlation (p < 0.01) with N2O emission. Simultaneous occurrence of nitrification – denitrification in soils may be the possible reason behind the significant relationship of both the form of mineralized nitrogen with N2O emission and is in agreement with Lou et al., 2007. In wheat, soil nitrate – N is reported to play an important role in influencing N2O emission (Gogoi and Baruah, 2012). Significant variations were observed in plant growth parameters, yield and yield attributing parameters. This may be due to different degrees of photosynthate allocation to the grains which is governed by phloem loading and unloading efficiency (Baruah et al., 2012). Source sink relationship is also influenced by both genotype and environmental factors and this may contribute to the variation in photosynthate partitioning efficiency resulting in the variations in yield potential of wheat under different treatments. Detail studies on micronutrient availability in soil and their relationship with enzymes of photosynthesis and sucrose phosphate synthase may provide a clear mechanism of C-N relationship on yield development.
Discussion The first high peak of nitrous oxide was observed at 4 days after sowing in T1 possibly due to the basal application of nitrogenous fertilizer (urea) and in T2, T3, T4 due to decomposition of crop residues (Crews and Peoples, 2004; Lupwayi and Kannedy, 2007) and organic manures. The 2nd high peak at 28 DAS in T1 was due to application of remaining dose of nitrogenous fertilizer resulting in higher availability of nitrogen substrate for nitrifying and denitrifying microorganisms promoting both the processes of nitrification and denitrification (Hou and Tsuruta, 2003). In T2 and T4, the emission peaks at 28 DAS are considered to be due to profuse tillering and is in good agreement with Gogoi et al., (2005) and Baruah et al., (2010a). The slow decomposition of rice straw might have contributed to slow release of nutrients and are not readily available to the crop which might be the reason of late tillering observed in the plants at T3 (Eiland et al., 2001) resulting in an increase of N2O emission at 35 DAS. Next higher peaks were recorded during the panicle initiation stage i.e. at 56 DAS irrespective of the treatments. High peaks were also recorded towards the maturation stage of the plants (70 – 77 DAS) which paralleled with the high soil organic carbon. Thereafter the emission started to decline towards the harvesting period of the crop. The variations in the seasonal emission of N2O during the wheat growing season are considered to be due to different C-N ratios in the organic amendments incorporated in the soil which provides a source of readily available C and N influencing N2O emissions (Nishimura et al., 2011). Application of residues with high C:N ( > 30) to soil has been found to reduce N2O emission due to microbial N immobilization (Cayuela et al., 2010b) which is in agreement with our findings of N2O emission reduction at C:N = 25:1. Application of rice straw (C:N = 41:1) have been also found to reduce N2O emission compared to the N fertilizer treatment. Straw decomposition with a high C- N ratio may increase the net immobilization of N (Jensen, 1996) and thus reduce the amount of available N for nitrification and denitrification (Wang et al., 2011). Huang et al., 2004 reported that the stimulatory or inhibitory effect of crop residues on N2O emissions is actually dependent on the C-N ratios of the residues which also support our findings. Recent reports of C-N ratio of biochar > 30 in reducing N2O emission from soil (Cayuela et al., 2014) are in good agreement with our findings of high C-N ratio contributing to emission reduction. The application of organic material with a high C-N ratio results
Materials and Methods Location The field study was conducted in the experimental farm of Tezpur (Central) University campus (26 o 42’ N, 92o 49’ E) Assam, India for two consecutive years in 2010-2011 and 20112012 (Figure 1). The paddy – wheat (winter season) rotational crop system is the major cropping system of the area. The soil is characterized by recent and old alluvial soils with sandy to silty-loam texture with slight acidic pH and rich in organic matter. Soil samples were collected before the start of the
466
experiments and analyzed for physical and chemical properties (Table 1).
channel (50 cm × 30 cm) was used to accommodate the chamber. Gas samples were drawn from the chambers using a 50 ml airtight syringe fitted with a three-way stop-cock and a fine needle that was inserted through a self-sealing rubber septum. The samples were drawn at fixed interval of 0, 15, 30 and 45 minutes respectively starting at 0900 hrs in the morning and again at 1400 hrs in the evening from the day of sowing onwards at weekly interval. Nitrous oxide concentration in the gas samples were analyzed using a gas chromatograph (Varian, 3800 GC) equipped with an electron capture detector (ECD) within 4 - 6 hours of collection. Nitrogen (N2) was used as a carrier gas with a flow rate of 15 ml min-1. The gas chromatograph was calibrated by standard N2O obtained from CSIR - National Physical Laboratory, New Delhi, India. The injector, column and detector temperature were maintained at 80, 150 and 300 °C respectively. Nitrogen (N2) was used as a carrier gas with a flow rate of 15 ml min -1. N2O fluxes were estimated by successive linear increase of gas concentration inside the box at each sampling time (0, 15, 30, 45 minutes) after chamber closure. The average of morning and evening fluxes were considered as the flux value for the day and calculated according to the equation of Wang et al., 2011. Cumulative N2O emission is expressed as seasonal integrated flux (Esif) in mg N2O-N m-2 for the entire crop growth period was computed by the method given by Ma et al., 2009 by using the following formula: Cumulative N2O emission (Esif) = ∑ni=1 (Ri * Di) Where Ri is the mean gas emission, Di is the number of days in the sampling interval and n is the number of sampling times. Cumulative N2O emission is expressed as (Esif) in mg N2O-N m-2.
Meteorological parameters Meteorological information was recorded by a weather station located inside the University campus. The daily precipitation (mm) and maximum - minimum air temperature (°C) recorded during the experimental period (December – April) are presented in figure 2a and b. The region experienced a dry and mild winter from late November to early April. The average seasonal temperature recorded during the experimental period was between 8 - 36 °C with a total precipitation of 225.5 mm in 2010 – 2011 and 186.7 mm in 2011 - 2012. Experimental design and crop management Experiments were conducted by sowing seeds of wheat variety Sonalika, in a well prepared field on 23 rd December 2010 and 22nd December 2011, at a spacing of 20 cm (row to row). Four treatments with conventional N fertilizer (NPK) as control (T1), Cow dung, T2 (C:N = 25:1), Rice straw, T3 (C:N=41:1) and Poultry manure, T4 (C:N=15:1) respectively were applied in the field. Each treatment was replicated 5 times in a randomized block design in plot size of 16m2 = 4m x 4m. The conventional N fertilizer in the form of Urea (N), Super Phosphate (P) and Muriate of Potash (K), (NPK) was applied in the ratio of 80:34:42 kg N-P2O5-K2O/ha as per recommendation of the Department of Agriculture, Government of Assam, India. The first half of N (urea) and the whole quantity of P2O5 and K2O was applied as basal dose by broadcasting before last ploughing and mixed thoroughly with soil and remaining second half of N (urea) was applied at CRI (crown root initiation) stage just after first irrigation. To manage the C: N in soil and to observe the impact of different amount of N on nitrous oxide emissions and grain yield the organic amendments were applied at the rate of 10 ton dry matter per hectare (without any inorganic N fertilizer i.e., NPK). The organic residues were mixed thoroughly in each plot one day before sowing of the seeds. The chemical properties of the organic residues are given in Table 1. Care was taken to remove any perennial grass from the experimental plot during the study period. One pre sowing irrigation was applied 3 – 4 days before sowing for quick and uniform germination of seeds. First irrigation was applied a CRI stage 22 - 25 days after sowing of the crop. Second irrigation was done at maximum tillering stage (44 - 46 days after sowing) and third irrigation at heading stage (73 - 77 days after sowing). Crop was harvested on 7th April, 2011 and 5th April 2012 respectively.
Auxiliary field measurements Various parameters of soil, plant growth and yield were recorded during the gas sampling. Soil analysis Prior to wheat cultivation soil samples were collected randomly from different locations of the experimental plot up to a depth of 0 - 10 cm with the help of a soil core (5 cm in diameter , 30 cm in height) and mixed thoroughly to prepare a single composite sample which was analyzed for the following basic soil physico - chemical parameters, soil moisture, soil texture (sand, silt, clay percentage), bulk density, pH, soil organic carbon, available nitrogen, available phosphorus and available potassium. Soil texture was determined by the International Pipette Method. Bulk density was determined by the core sampler method (Mishra and Ahmed, 1987). Soil pH (1:2.5 soil water ratios) was measured using a Systronics Graph model D electronic pH meter during each nitrous oxide sampling period (Baruah et al., 2010a). Available soil nitrogen, phosphorus and potassium content were determined by Kjeldahl’s method, Bray’s & Kurtz P1 method and flame photometric method (Baruah et al., 2012) respectively. Moisture content, total carbon, total organic carbon, nitrate – N, ammonium –N of soil were analyzed at weekly interval at all the sampling days. The samples were collected with a soil core (5 cm in diameter , 30 cm in height) inserted in the soil (0 – 10 cm) from 4 points in each replicate of every treatment and mixed together to make a composite sample. Moisture content of the soil was analyzed by
Gas sampling Gas samples were collected from the day of sowing (0 Day after sowing, DAS) onwards at weekly intervals, 2 times a day throughout the growth period. The closed chamber technique (Gogoi and Baruah, 2012; Wang et al., 2011; Ma et al., 2009) was used to collect N2O gas from the soil - plant system. Chambers of 50 cm × 30 cm × 70 cm (l × b × h) made of 6 mm thick acrylic sheets and equipped with a circulating fan to homogenize the air inside the chamber were used for gas collection. Chamber with 100cm height was used from panicle initiation stage onward. The rectangular shaped aluminum
467
Gravimetric method (Anderson and Ingram, 1993). Air dried soil samples were passed through 2 mm mesh sieve to analyze the various other parameters. Total carbon content and total organic carbon of the soil was analyzed in TOC analyzer (Multi N/C 2100S with HT 1300 module, Analytik zena, Germany).The estimation of soil nitrate – N was done by colorimetric method after reaction with phenol-di-sulphonic acid (Ghosh et al., 1983) and ammonium – N by indo-phenol blue method after extracting the soils with 2M KCl solution in conventional steam distillation system (Keeney and Nelson, 1982).Soil temperature was measured with a soil thermometer on every sampling date. Plant parameters such as plant height and tiller number were recorded manually at each sampling date during the crop growing season.
necessary while trying to work out efficient biological mitigation strategy for greenhouse gas emissions. References Anderson JM, Ingram JSI (Eds.) (1993) Tropical Soil Biology and Fertility: a Handbook of Methods. CAB International, Wallingford, UK. Baggs EM, Rees RM, Smith KA, Vinten AJ (2000) Nitrous oxide emission from soils after incorporating crop residues. Soil Use Manage. 16:82–87. Baruah KK, Gogoi B, Gogoi P (2010a) Plant physiological and soil characteristics associated with methane and nitrous oxide emission from rice paddy. Physiol Mol Biol Plant. 16:79–91. Baruah KK, Gogoi B, Gogoi P, Gupta PK (2010b) N2O emission in relation to plant and soil properties and yield of rice varieties. Agron Sustainable Dev. 30:733–742. Baruah KK, Gogoi B, Borah L, Gogoi M, Boruah R (2012) Plant morpho-physiological and anatomical factors associated with nitrous oxide flux from wheat (Triticum aestivum). J Plant Res. 125: 507-516 Cayuela ML, Velthof GL, Mondini C, Sinicco T, and van Groenigen, JW (2010b) Nitrous oxide and carbon dioxide emissions during initial decomposition of animal by-products applied as fertilizers to soils. Geoderma. 157:235–242. Cayuela ML, Zwieten LV, Singh BP, Jeffery S, Roig A, Sánchez-Monedero MA (2014) Biochar’s role in mitigating soil nitrous oxide emissions: A review and meta-analysis. Agric Ecosyst Environ. 191:5-16. Crews TE, Peoples MB (2004) Legume versus fertilizer sources of nitrogen: ecological tradeoffs and human needs. Agric Ecosyst Environ. 10227:9–297. Datta A, Rao K S, Santra SC, Mandal TK, Adhya TK (2011) Greenhouse gas emissions from rice based cropping systems: Economic and technologic challenges and opportunities. Mitigation Adapt Strateg for Glob Chang. 16:597-615. Davidson EA (2009) The contribution of manure and fertilizer nitrogen to atmospheric nitrous oxide since 1860. Nat geosci. 2:659-662. Eiland F, Klamer M, Lind AM, Baath E (2001) Influence of initial C: N ratio on chemical and microbial composition during long term composting of straw. Microbiol Ecol. 41:272–280. Forster P, Ramaswamy V, Artaxo P, Berntsen T, Betts R, Fahey DW, Haywood J, Lean J, Lowe DC, Myhre G, Nganga J, Prinn R, Raga G, Schulz M, Van Dorland R, (2007) Changes in Atmospheric Constituents and in Radiative Forcing. In: Climate Change 2007: The Physical Science Basis. Contribution of Working Group I to the Fourth Assessment Report of the Intergovernmental Panel on Climate Change [Solomon S, Qin D, Manning M, Chen Z, Marquis M, Averyt KB, Tignor M and Miller HL (eds.)]. Cambridge University Press, Cambridge, United Kingdom and New York, NY, USA. Ghosh AB, Bajaj JC, Hasan R, Singh D (1983) Soil and water testing methods. Yugantar press, IARI, New Delhi, India, pp.14-16. Ghosh S, Wilson B, Ghoshal S, Senapati B, Mandale B (2012) Organic amendments influence soil quality and carbon sequestration in the Indo-Gangetic plains of India. Agric Ecosyst Environ. 156:134–141.
Plant growth parameters During the crop growth period, destructive sampling was done to estimate above ground and below ground biomass during vegetative, reproductive and maturation stages. The roots were separated from the shoot portion carefully and washed thoroughly to remove any soil particles under running water over a sieve. Biomass was recorded by drying the samples in an oven at 75 ± 2o C till a constant weight was obtained and weighed. Yield and yield attributing parameters Crop yield and yield attributing parameters were recorded after harvesting. The grains were separated from the straw, dried and weighed for yield. Yield attributing parameters (sterility %, fertile panicle per sq meter, harvest index, etc) were recorded after harvesting by standard methods. Harvest index was estimated as given by Yasin et al., 2011 as follows: 𝑒𝑐𝑜𝑛𝑜𝑚𝑖𝑐 𝑦𝑖𝑒𝑙𝑑 Harvest index = ∗ 100 𝑏𝑖𝑜𝑙𝑜𝑔𝑖𝑐𝑎𝑙 𝑦𝑖𝑒𝑙𝑑
Statistical analysis The SPSS 16.0 software package was used to calculate the correlation (Pearson) coefficient of soil and plant physiological parameters with N2O emission from the treatments. Two way analysis of variance (ANOVA) was conducted to analyze the significance of difference of different parameters among the treatments applied and subsequently Duncan Multiple Range Test (DMRT) with p < 0.05 to find out the critical differences between the recorded parameters. Conclusion Investigation on yield and yield related parameters showed higher grain yield and superior yield related parameters at T4 (C:N – 15:1, poultry manure) accompanied by higher N2O emissions. In this study, application of cow dung, C:N – 25:1 (T2) resulted in lower seasonal N2O emission than conventional N-fertilizer application during both the years. This may be considered a suitable treatment for mitigation of N2O from wheat ecosystem without compromising grain productivity. C:N ratio management with farmer friendly organic amendments can effectively reduce N2O emission from wheat agriculture. Better understanding on the influence of organic amendments on photosynthesis and yield development is
468
Gogoi N, Baruah KK, Gogoi B, Gupta PK (2005) Methane emission characteristics and its relations with plant and soil parameters under irrigated rice ecosystem of northeast India. Chemosphere. 59:1677–1684. Gogoi B, Baruah KK (2012) Nitrous oxide emissions from fields with different wheat and rice varieties. Pedosphere. 22:112-121. Gunapala N, Scow KM (1998) Dynamics of soil microbial biomass and activity in conventional and organic farming systems. Soil Biol Biochem. 30:805-816. Hou AX, Tsuruta H (2003) Nitrous Oxide and Nitric Oxide fluxes from an upland field in Japan: Effect of urea type, placement and crop residues. Nutr Cycl Agroecosyst. 65:191– 200. Huang Y, Zou J, Zheng X, Wang Y, Xu X (2004) Nitrous oxide emissions as influenced by amendment of plant residues with different C: N ratios. Soil Biol Biochem. 36:973–981. IPCC (2014) Assessment report 5, the physical science basis: summary for policy makers. Intergovernmental Panel on Climate Change, Geneva. Jensen ES (1996) Nitrogen immobilization and mineralization during initial decomposition of 15N labeled pea and barley residues. Biol Fertil Soils. 24:39-44. Keeney DR, Nelson DW (1982) Nitrogen – inorganic forms, In: Page AL, Miller RH, Keeney DR (eds) Methods of soil analysis, part 2. Chemical and microbiological properties. American Society of Agronomy, Madison, Wis., pp 674–676. Kong AYY, Hristona K, Scow KM, Six J (2010) Impacts of different N management regimes on nitrifier and denitrifier communities and N cycling in soil microenvironments. Soil Biol Biochem. 42:1523-1533. Kramer AW, Doane TA, Horwath WR,, van Kessel C (2002) Combining fertilizer and organic inputs to synchronize N supply in alternative cropping systems in California. Agric Ecosyst Environ. 34:43–50. Khalil MI, Inubushia K (2007) Possibilities to reduce rice straw-induced global warming potential of a sandy paddy soil by combining hydrological manipulations and urea-N fertilizations. Soil Biol Biochem. 39:2675–2681. Lou Y, Ren L, Li Z, Zhang T, Inubushi K (2007) Effect of rice residues on Carbon Dioxide and Nitrous oxide emissions from paddy soil of subtropical China. Water Air Soil Pollut. 178:157-168. Lupwayi NZ , Kennedy AC (2007) Grain legumes in Northen Great Plains: impacts on selected biological processes. Agro J. 99:1700–1790.
Nishimura S, Akiyama H, Sudo S, Fumoto T, Cheng W, Yagi K (2011) Combined emission of CH4 and N2O from a paddy field was reduced by preceding upland crop cultivation. Soil Soil Sci Plant Nutr. 57:167-178. Ma J, Ma E, Xu H, Yagi K, Cai Z (2009) Wheat straw management affects CH4 and N2O emissions from rice fields. Soil Biol Biochem. 41:1022-1028. Mishra RD, Ahmed H (1987) Manual on irrigation agronomy. Oxford and IBH, New Delhi, India Morley N, Baggs EM (2010) Carbon and oxygen controls on N2O and N2 production during nitrate reduction. Soil Biol Biochem. 421:864-1871. Mosier A, Kroeze C, Nevison C, Oenema O, Seitzinger S, van Cleemput O (1998) Closing the global N2O budget: Nitrous oxide emissions through the agricultural nitrogen cycle. Nutr Cycl Agroecosyst. 52:25–248. Tiedje JM, Sexstone AJ, Myrold DD, Robinson JA (1982) Denitrification: ecological niches, competition and survival, Antonie Von Leeuwenhoek.48:569–583. Toma Y, Hotana R (2007) Effect of crop residue C:N ratio on N2O emission from Gray lowland soil in Mikasa, Hokkaido, Japan. Soil Sci Plant Nutr. 53:198-205. Ussiri D, Lal R (2013) The role of Nitrous Oxide on climate change. Soil emission of Nitrous Oxide and its mitigation. Springer. Netherlands, 1–28. Wang JY, Jia JX, Xiong ZQ, Khalil MAK, Xing GX (2011) Water regime- nitrogen fertilizer-straw incorporation interaction: Field study on nitrous oxide emission from a rice agroecosystem in Nanjing, China. Agric Ecosyst Environ. 1414:37–446. World Meteorological Organization (2010) WMO Greenhouse gas bulletin: the state of greenhouse gases in the atmosphere based on observations through 2009. http://www.wmo.int/gaw/. Yasin BA, Ram M, Singh S, Wani BA, (2011) Genetic Improvement in Yield, Yield Attributes and Leaf Rust Resistance in Semi-dwarf Wheat Varieties Developed in India from Last 40 Years. Intl J of Agricultural Research, 6: 747753. Zou JW, Huang Y, Zong LG, Zheng XH, Wang YS (2004) Carbon dioxide, nitrous oxide and methane emissions from a rice-winter wheat rotation system as affected by crop residue incorporation and temperature. Adv Atmos Sci. 21:691–698.
469