PHYSICAL REVIEW B 66, 205402 共2002兲
Effect of oxygen pressure on the optical and structural properties of Cu:Al2 O3 nanocomposite films R. Serna,* D. Babonneau,† A. Sua´rez-Garcı´a, and C. N. Afonso ´ ptica, CSIC, Serrano 121, 28006 Madrid, Spain Instituto de O
E. Fonda and A. Traverse Laboratoire pour l’Utilisation du Rayonnement Electromagne´tique, Baˆt. 209D, Centre Universitaire, BP 34, 91898 Orsay Cedex, France
A. Naudon Laboratoire de Me´tallurgie Physique, UMR 6630 CNRS, Universite´ de Poitiers, SP2MI, Te´le´port 2, Bvd M. et P. Curie, BP 30179, 86962 Futuroscope Chasseneuil Cedex, France
D. E. Hole School of Engineering and I. T., Pevensey Building, University of Sussex, Brighton BN1 9QH, United Kingdom 共Received 12 February 2002; published 6 November 2002兲 Cu:Al2 O3 multilayer nanocomposite thin films have been produced by alternating pulsed laser deposition and analyzed by nondestructive synchrotron radiation techniques. The effect of growing in an oxygen atmosphere, or exposing the films to an oxygen atmosphere immediately after the copper deposition, on the formation and properties of Cu nanocrystals 共NC’s兲 has been investigated. The optical absorption of the films with Cu deposited in vacuum shows a band with a maximum around 630 nm, which is related to a surface plasmon resonance 共SPR兲 and is evidence of the presence of Cu NCs. When Cu is grown in an oxygen atmosphere, a decrease in the overall optical absorption and a damping of the SPR band are observed as the oxygen pressure is increased. Grazing incidence small-angle x-ray scattering results show that NC’s with an average size of ⬃5 nm are distributed within the Al2 O3 matrix forming discontinuous periodic layers, except for the films with copper deposited at the highest oxygen pressure (6.6⫻10⫺3 mbar) which show no evidence of NC formation. X-ray absorption spectroscopy analysis shows that whereas the Cu NC’s produced have negligible oxidation when Cu is deposited in vacuum, Cu oxide appears for all the other films. The results suggest that small Cu2 O clusters coexist with large weakly oxidized Cu clusters for the films produced in oxygen ambient at intermediate pressures 共up to 2.6⫻10⫺4 mbar). For the highest deposition oxygen pressure it appears that layers of highly disordered Cu oxides and AlCuO2 have been produced. When Cu NCs are exposed to oxygen after deposition an oxide shell preserving the metallic Cu core is formed. DOI: 10.1103/PhysRevB.66.205402
PACS number共s兲: 61.46.⫹w, 61.10.Ht, 61.10.Eq, 78.67.⫺n
I. INTRODUCTION
Metal clusters, usually with a crystalline structure and with characteristic sizes of the order of a few nanometers, show special properties that make them interesting for many technological applications. Due to their large surface to volume ratio they show a high chemical reactivity in oxidation and catalysis processes which are of interest to industry. In nanocrystals 共NC’s兲 the valence electrons are confined to regions that are smaller than their delocalization length 共or mean free path兲, and this so called quantum confinement effect modifies the quantum states of the electrons and their interaction with applied electrical and magnetic fields, and thus with light. When metal NC’s are embedded in a dielectric host, it is found that the optical response is modified in the medium, giving rise to an absorption band 共attributed to the surface plasmon resonance兲 and to an intensity dependent refractive index.1 This latter property has attracted great attention as it can be exploited for the development of ultrafast optical switching devices.2,3 The optical response mainly depends on the dielectric properties of the matrix, usually a glass, and of the metal, but can be greatly influenced by the size, size distribution, and shape of the NC’s, and also by the 0163-1829/2002/66共20兲/205402共10兲/$20.00
matrix-NC interaction.4 Thus for the synthesis of a suitable material all these issues should be addressed. Pulsed laser deposition 共PLD兲 is a technique that has shown great potential for the development of thin films with good adhesion, high density, and excellent optical properties.3,5 The use of multiple-target sequential PLD permits an independent control of the synthesis of the NC’s and of the embedding matrix. We have shown that by alternating the targets in vacuum, metal 共Bi, Cu, Ag, Fe兲 NC’s of appropriate dimensions can be synthesized.3,6 –9 PLD in a gas environment has also been extensively employed to produce nanocrystalline Si,10 to prepare CdTe NC’s embedded in a glass,11 or Cu NC’s in amorphous Al2 O3 . 12 In most of the cases an inert gas 共He, Ar兲 has been used at high pressures (⬎0.13 mbar), but only in some cases has the effect of a reactive gas been studied. In this work our aim is to investigate the effect of a controlled oxygen environment on the formation of Cu NC’s embedded in amorphous Al2 O3 produced by PLD. The modifications in the microstructure of the nanocomposite films as well as in the matrix-NC interaction will be analyzed. This latter issue has not been addressed before in the case of NC’s produced by PLD, although the possible oxida-
66 205402-1
©2002 The American Physical Society
PHYSICAL REVIEW B 66, 205402 共2002兲
R. SERNA et al.
tion by the oxygen of the Al2 O3 matrix even when the metal NC’s are produced in vacuum has been questioned.9 In addition it should be noted that the use of a reactive environment can promote the formation of copper oxides such as Cu2 O and CuO. Both of these materials are semiconductors with a direct band gap of 2.2 eV and an indirect band gap of 1.4 eV, respectively.13 Moreover, compounds formed from Cu, Al, and O have attracted interest recently since they have band gaps of about 3.5 eV and thus a number of them form optically transparent conductors.14,15 Hence, a detailed analysis of the structure and chemical environment of the Cu in NC’s is necessary in order to obtain a full understanding of the electrical and optical properties of nanocomposite films. In the following we present a detailed study of Cu:Al2 O3 nanocomposite films. By using nondestructive synchrotron radiation techniques, information about the structure and morphology, together with information on the local atomic order around the Cu nanocrystals has been obtained. Combined with optical absorption experiments, the results show the effect of the incorporation of oxygen on the growth, structure and optical response of these nanocomposite films. II. EXPERIMENT
Nanocomposite thin films were grown by PLD using an ArF excimer laser (⫽193 nm, ⫽20 ns) operating at 20 Hz. The laser beam was focused alternately onto high purity ceramic Al2 O3 and metallic Cu targets at an angle of incidence of 45°. During the process of ablation the targets were rotated to prevent crater formation. The energy density of the laser on the surface of the targets was 2 J cm⫺2 . The films were deposited simultaneously on silicon and glass substrates located 32 mm in front of the targets, and held at room temperature. The synthesis procedure consisted of the growth of an amorphous Al2 O3 layer (⬃10 nm thick兲 followed by the deposition of an amount of Cu 共nominal thickness of ⬃1.2 nm) sufficient to form metal NC’s in vacuum, as already observed by TEM.16 This growth sequence was repeated ten times and was finished with an Al2 O3 layer to prevent exposure of the last Cu deposit to the atmosphere. In order to analyze the effect of an oxygen environment during the deposition, samples were grown in a vacuum chamber either at the base pressure of 1⫻10⫺6 mbar 共vacuum兲 or under an O2 pressure of 2.6⫻10⫺4 or 6.6⫻10⫺3 mbar. It should be noted that the presence of oxygen during growth only affects the properties of the Cu NC’s, because it has been demonstrated that the properties of the Al2 O3 are not modified by the presence of a gas in this pressure range.12 The possibility of oxidizing Cu NC’s just after the deposition of the Cu was also explored. For this film Al2 O3 and Cu were grown in vacuum and, just after the deposition of Cu, the chamber oxygen pressure was raised to 1.3⫻10⫺1 mbar for 5 min. After that time, the chamber was evacuated and ablation started again. This process was repeated ten times. To ensure that it was only the effects of oxygen that were different between the samples, the metal content of the different films was kept constant. However, to observe the effect of oxidation on the size of the copper particles a set of samples was made at 6.6⫻10⫺3 mbar by allowing a differ-
TABLE I. The experimental deposition conditions and the results from RBS analysis. The table includes the information on the oxygen pressure in the chamber during or after the Cu deposition ( P O2 ), the Cu areal density per layer ( 关 Cu兴 ), the total film thickness, and the period of the multilayer, namely, the thickness of a Al2 O3 /Cu bilayer. The periods obtained from the GISAXS analysis are included for comparison.
P O2 共mbar兲 Vacuum 2.6⫻10⫺4 6.6⫻10⫺3 6.6⫻10⫺3 1.3⫻10⫺1 a a
关 Cu兴 /1015 (at cm⫺2 )
Total thickness 共nm兲
Period RBS 共nm兲
Period GISAXS 共nm兲
9.5⫾0.8 9.6⫾0.8 10.0⫾0.8 15.8⫾0.8 10.3⫾0.8
107⫾9 109⫾9 92⫾9 104⫾9 95⫾9
9.8⫾0.8 10.0⫾0.8 8.5⫾0.8 9.6⫾0.8 8.8⫾0.8
9.8⫾0.5 10.4⫾0.6 9.1⫾0.5 9.5⫾0.5 9.2⫾0.5
Oxygen exposure after deposition for 5 min.
ent number of pulses to hit the Cu target. The Cu content 共Cu areal density per layer, 关Cu兴兲, the total thickness and the period of the layered films were determined by Rutherford backscattering spectrometry 共RBS兲 using a 2-MeV 4 He⫹ beam. The experimental spectra were simulated by the RUMP program.17 The total thickness and the period of the films were deduced from the areal densities determined by RBS, assuming the density of the amorphous aluminum oxide estimated in an earlier work6 (8.72 ⫻1022 at cm⫺3 ) and that of bulk Cu (8.48⫻1022 at cm⫺3 ) for the Cu NC’s.18 Table I summarizes the experimental conditions of deposition and the results of RBS analysis. It can be seen that all the films have a similar total thickness (⬃100 nm) and a Cu content in the range of 1016 at cm⫺2 per layer. After deposition the absorption of the films prepared on glass substrates was recorded at normal incidence in the range 400– 800 nm with a standard monochromatorphotomultiplier setup. The coefficient of the linear optical absorption ( ␣ ) was obtained as ␣ ⫽(1/l)ln(I0 /It), with I 0 and I t being the transmitted intensities through the substrate and the film, respectively, and l the total thickness of the thin film as determined from RBS measurements. The morphology of the NC’s 共i.e., shape, center-to-center separation, average size, and size distribution兲 was investigated by means of GISAXS measurements carried out at the LURE synchrotron facility 共Orsay, France兲, on beam-line D22 of the DCI ring. This technique has advantages over direct TEM observation as no specific sample preparation is needed and in a single measurement, a few square mm of film can be analyzed.19,20 The incident x-ray beam was collimated to a height of 0.1 mm and a width of 1 mm, and the photon energy was set at 8275 eV corresponding to a wavelength of ⫽0.15 nm. Good surface sensitivity was achieved by keeping the angle of incidence ␣ i ⬇0.28°, slightly above the critical angle for a total external reflection of the analyzed films. Under these conditions, the penetration depth of the x-ray beam was approximately equal to the film thickness, so that the scattering signal originated from typically 1011 nanoparticles. A two-dimensional 共2D兲 gas-filled
205402-2
PHYSICAL REVIEW B 66, 205402 共2002兲
EFFECT OF OXYGEN PRESSURE ON THE OPTICAL . . .
detector placed 665 mm behind the sample was used to collect the scattered intensity in the (q y ,q z ) plane of the reciprocal space (q y and q z are the horizontal and vertical components of the scattering vector qជ with modulus q ⫽(4 /)⫻sin , where 2 is the scattering angle corrected for refraction and absorption兲. During the GISAXS experiments, a vertical beam stop located around q y ⫽0 masked the reflected beam as well as the major part of the diffuse scattering arising from surface and interface roughness. Onedimensional intensity plots were then obtained by integrating narrow stripes in the 2D intensity map. The scattered intensity was fitted using a theoretical model based on the local monodisperse approximation21 assuming a Gaussian distribution of ellipsoidal NC’s. The local atomic order around Cu atoms 共i.e., interatomic distances, number and type of atoms around the metal species兲, and thus the oxidation state of Cu, was investigated by means of x-ray absorption spectroscopy 共XAS兲 measurements. X-ray absorption near-edge structure 共XANES兲 and extended x-ray absorption fine structure 共EXAFS兲 data were recorded on beam line D42 of the DCI ring at LURE with a Si 111 channel cut monochromator. All spectra were recorded in conversion electron yield mode under helium flow with the electric field parallel to the surface and a beam incident at 15° from the surface.22 The samples were cooled to about 80 K in a liquid nitrogen cryostat. The spectra of pure samples of Cu and CuO were recorded under the same conditions to be used as references. The energy scale was calibrated on the Cu foil assigning 8980 eV to the half of the K edge. The scans were performed from 8850 to 9980 eV with a constant 2-eV step and 2 s per point integration time. Two scans of each sample were sufficient to obtain a good signal-to-noise ratio. The analysis of the EXAFS spectra was carried out with the UWXAFS 共Ref. 23兲 and FEFF 7.02 codes.24 Background removal and normalization were performed by extrapolating the pre-edge with a straight line, the aboveedge background with cubic splines in order to minimize the signal with frequencies below 0.9 Å, and the normalization was done using a constant value for the edge step. XANES spectra were normalized in the same way; the edge step was calculated by extrapolating a third degree polynomial that fits some 200 eV above the edge. EXAFS spectra refinements were done employing theoretical standards calculated with FEFF 7.02 on CuO and Cu metal structures. The refinements were performed in r space. The Fourier transform of the signal was applied between 2.5 and 13 Å⫺1 , except for the sample deposited at 2.6⫻10⫺4 mbar for which it was performed between 2.5 Å⫺1 and 11.5 Å⫺1 . The value of the many body amplitude reduction factor, S 20 , 25 was obtained by fitting the Cu metal signal, S 20 ⫽0.73⫾0.02. III. RESULTS A. Linear optical properties
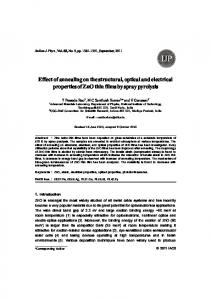
Figure 1 shows the linear absorption of the films. For the film deposited in vacuum the spectrum shows a broad absorption band with a maximum at 630⫾5 nm, and a full width at half maximum 共FWHM兲 ⬃195 nm, attributed to the
FIG. 1. The optical absorption spectra for the Cu:Al2 O3 nanocomposite films. The numbers on the curves make reference to the oxygen pressure, in mbar, at which the Cu was deposited, or was exposed to after deposition 共curve marked post兲.
surface plasmon resonance 共SPR兲 of metallic Cu NC’s embedded in the amorphous Al2 O3 matrix.3,26 Note that the wavelength at which the SPR band occurs is characteristic of the dielectric functions of both the metal NC’s and the host material. The optical absorption for the film with the Cu exposed to an oxygen atmosphere just after deposition behaves similarly to that of the film grown in vacuum, since the SPR is well defined and its maximum position is at 635 ⫾5 nm. The main difference is a decrease of the absorption. For the films in which the Cu was deposited in an oxygen environment the optical absorption spectra features change as the oxygen pressure is increased. For the film with Cu grown at 2.6⫻10⫺4 mbar pressure, the SPR band maximum is at 645⫾5 nm, slightly displaced to the red, and its intensity is reduced with respect to the film with Cu grown in vacuum. For the highest O2 pressure, the absorption spectra of the two studied films are very similar, irrespective of the Cu content. They show a decrease of the absorption as the wavelength increases, and there is no SPR band. In both spectra there is an inflection point around 640⫾5 nm instead of a maximum. The evolution of the absorption at 630 nm with the oxygen pressure for the films with equal Cu content ( 关 Cu 兴 ⬇1016 at cm⫺2 ) is shown in Fig. 2. It can be seen that the absorption height decreases exponentially as the oxygen pressure during deposition increases, thus showing that the optical properties of the films are very sensitive to the presence of oxygen. B. Morphological properties
Figure 3 shows the GISAXS pattern of the films deposited in vacuum 共a兲 and in 6.6⫻10⫺3 O2 mbar 共b兲. In the pattern of Fig. 3共a兲, a nonspecular diffuse scattering characteristic of rough layered systems is detected on both sides of the vertical beam stop. Three diffraction satellites 共Bragg peaks兲 can be observed at q z ⫽0.67, 1.31, and 1.97 nm⫺1 共very weak兲, from which the period of the multilayer can be deduced.27 It should be noted that such a diffuse intensity, indicating lay-
205402-3
PHYSICAL REVIEW B 66, 205402 共2002兲
R. SERNA et al.
FIG. 2. The optical absorption at 630 nm as a function of the oxygen pressure, in mbar, at which the Cu was deposited, or was exposed to after deposition 共point marked post兲.
ering, was observed in all the analyzed films, including those deposited in the highest oxygen pressure 关see Fig. 3共b兲兴. Table I shows that the thickness of the Al2 O3 /Cu bilayers measured by GISAXS is consistent with that measured by RBS within the uncertainty of both techniques. Also clearly visible in Fig. 3共a兲 is a dominant signal symmetrical in relation to the q z axis with interference maximum in the direction parallel to the q y axis. Similar well-defined signals, evidencing the presence of scattering bodies with characteristic sizes of a few nanometers 共i.e., NC’s distributed within the film兲, were observed in the other films, with the exception of those deposited at the highest oxygen pressure 关see Fig. 3共b兲兴. The lateral and vertical extensions of the scattering enable the average lateral and vertical dimensions of the NC’s to be determined, respectively. Figure 4共a兲 shows a cross-section of the scattering pattern parallel to the q y axis at the exit angle ␣ f ⫽0.56° of the scattered beam 共corresponding to q z ⫽0.41 nm⫺1 ). The interference peaks ob-
FIG. 3. Two-dimensional GISAXS patterns for the Cu:Al2 O3 nanocomposite films with the Cu deposited in vacuum 共a兲 and at an oxygen pressure of 6.6⫻10⫺3 mbar 共b兲. The arrows point to the position of the Bragg peaks related to the multilayer structure of the films from which the period of the multilayer can be determined.
FIG. 4. The cross-section of the GISAXS pattern for the Cu:Al2 O3 nanocomposite film deposited in vacuum 关Fig. 3共a兲兴 parallel to the q y axis at the position q z ⫽0.41 nm⫺1 共a兲 and parallel to the q z axis at the position q y ⫽0.81 nm⫺1 共b兲. The solid lines are the best fit to the experimental values using the parameters listed in Table II.
served in the 1D GISAXS profile are attributed to in-plane spatial correlation between isolated NC’s embedded in the Al2 O3 matrix. Assuming an assembly of polydisperse rotational ellipsoids interacting with a hard-sphere potential, the GISAXS profile is expressed in the local monodisperse approximation 共LMA兲 by I共 q y 兲⬀
冕
⬁
0
¯ ,w D 兲 dD 共1兲 P 共 q y ,D 兲 S 共 q y ,D hs , hs 兲 N 共 D,D
where P(q y ,D) is the form factor of ellipsoids with diameter D,28 and S(q y ,D hs , hs ) is the structure factor for the hard spheres with diameter D hs ⫽CD and volume fraction ¯ ,w D ) was taken as a Gaussian function hs . 21,29 N(D,D ¯ of the ellipsoids specified by the average in-plane diameter D and the FWHM w D of the size distribution. The solid line in ¯, Fig. 4共a兲 is the best fit of the experimental points using D w D , C, and hs as fitting parameters. The agreement with the experimental data is satisfactory except for q y →0 due to the presence of the vertical beam-stop. The signal modeled by using the LMA also yields the correlation length ⌳ between NC’s 共average interparticle distance兲 as ⌳ 3 ¯ 3 )/(6 hs ). ⫽ 冑( C 3 D Figure 4共b兲 shows a cross-section parallel to the q z axis at q y ⫽0.81 nm⫺1 corresponding to the position of the interference peak in Fig. 4共a兲. For a perfect reproduction of the 1D GISAXS profile seen in Fig. 4共b兲, dynamical calculations should be performed on the basis of the distorted-wave Born approximation applied to rough multilayers.30 However, such a treatment is not easy to apply in this case because the Cu layers are discontinuous and the interfaces with the Al2 O3
205402-4
PHYSICAL REVIEW B 66, 205402 共2002兲
EFFECT OF OXYGEN PRESSURE ON THE OPTICAL . . .
¯ ), FWHM of the TABLE II. The results from the GISAXS analysis: average in-plane NC’s diameter (D ¯ ), average size ( ¯ ), aspect ratio (H ¯ /D ¯ ) to size distribution (w D ), correlation length (⌳), average height (H estimate the ellipticity of the NCs, estimated Cu areal density calculated from the GISAXS data ( 关 Cu兴 * ), and ratio 关 Cu兴 * / 关 Cu兴 for comparison with RBS analysis. P O2 共mbar兲 Vacuum 2.6⫻10⫺4 6.6⫻10⫺3 6.6⫻10⫺3 1.3⫻10⫺1 a
⌳
¯ D 共nm兲
共nm兲
共nm兲
5.5⫾0.5 5.6⫾0.5
2.2⫾0.2 2.3⫾0.2
9⫾2 9⫾2
5.1⫾0.4
2.1⫾0.2
8⫾2
wD
¯ H 共nm兲 3.7⫾0.3 3.3⫾0.3 No No 3.5⫾0.3
¯ 共nm兲
¯ /D ¯ H
4.8⫾0.4 0.67⫾0.11 4.7⫾0.4 0.59⫾0.10 signal detected signal detected 4.5⫾0.4 0.69⫾0.11
关 Cu兴 * /1015
(at cm
⫺2
关 Cu兴 * / 关 Cu兴
)
7⫾2 6⫾2
0.71 0.60
5.7⫾1.8
0.55
a
Oxygen exposure after deposition for 5 min.
layers are difficult to model. Accordingly, adjustment of the scattered signal in Fig. 4共b兲 共solid line兲 was simplified by taking into account only the form factor of the NC’s and ¯ ) with H ¯ betherefore the scattered intensity, I(q z )⬀ P(q z ,H ing the average height of the ellipsoids, was used as the unique fitting parameter. The results for all the films showing a GISAXS signal are ¯ reported in Table II together with the NC ‘‘average size’’ 共i.e., the diameter of a sphere having the same volume as the ¯ ⫽ 3冑D ¯ 2H ¯ , the NC ‘‘aspect ratio’’ average NC calculated as ¯ ¯ H /D , and the ‘‘apparent Cu content’’ given by 关 Cu兴 * ¯ 3 Cu )/(6⌳ 2 ) where Cu is the bulk metal density. As ⫽( a general comment, it is demonstrated that the films deposited in vacuum consist of isolated oblate NCs 共i.e., rotational ellipsoids with the large axis laying on the film plane兲 homogeneously distributed in the plane of each Cu layer. Furthermore, the NC morphology is not dramatically affected by the deposition conditions, since the size and shape of the NC’s formed at 2.6⫻10⫺4 O2 mbar and subjected to an oxygen atmosphere after metal deposition are similar to those in vacuum. However, the amount of Cu atoms as deduced from GISAXS is systematically smaller than the one deduced from RBS 共as shown by the 关 Cu兴 * / 关 Cu兴 ratio being smaller than 1兲 and the difference is larger in the presence of O2 . Finally, for the films deposited in 6.6⫻10⫺3 mbar, no scattering signal from NC’s within the Al2 O3 matrix was detected. C. Cu local structure
Figure 5 shows the XANES spectra of the Cu:Al2 O3 nanocomposite films and of the Cu and CuO references, for comparison. In the following, only one of the films grown at the pressure 6.6⫻10⫺3 mbar, the one with the highest Cu content (1.58⫻1016 at cm⫺2 ), has been analyzed, since both showed similar optical and morphological properties. The comparison of the absorption edges of the spectra in Fig. 5 shows that a net distinction can be made between the film deposited at 6.6⫻10⫺3 mbar and the other samples. Qualitatively the XANES spectrum of the film grown at the highest O2 pressure is similar to that of CuO, and therefore the Cu appears to be highly oxidized. In contrast, for films deposited
in vacuum, at 2.6⫻10⫺4 mbar O2 , or exposed to an oxygen atmosphere after metal deposition, the XANES spectra resemble that of metallic copper. As a first approximation, we have assumed that the total absorption is the sum of the absorption of oxide and metallic phases. Then a linear combination can be used to estimate the composition of the Cu system in terms of the relative amount of oxide and metal phases. The result of this analysis is shown in Table III. The trend is that the amount of oxidized phase in the films increases as O2 is introduced in the chamber either during or after deposition. It should be pointed out that since the energy resolution of the D42 S111 monochromator and of the optical setup does not allow CuO and Cu2O to be distinguished we have only stated the presence of oxidized and metallic copper. A quantitative analysis of the EXAFS oscillations 共Fig. 6兲 has been performed by taking into account the presence of oxygen as a Cu neighbor as deduced from the XANES features and confirming the tendency shown in Table III. Figure 7 shows the Fourier transform 共FT兲 共imaginary parts and modulus兲 calculated from the EXAFS oscillations. The FT spectrum for metallic Cu shows a peak at the apparent 共not phase corrected兲 distance of almost 2.1 Å, which is the first Cu–Cu distance in the metal. The FT spectrum of the CuO shows a broad peak at an apparent distance of 1.5 Å which corresponds to the Cu-O contribution 共the Cu-O average distance in CuO is 1.959 Å: 1⫻1.907 Å, 1⫻1.932 Å, 1 ⫻1.977 Å, and 1⫻2.019 Å). 31 Using these features as a reference, it is easy to attribute the film grown in a vacuum to the metallic phase, the peaks at higher distances also corresponding well to those of the Cu foil. Similarly, the film grown at the highest O2 pressure most probably includes a Cu oxide phase. The films grown at intermediate O2 pressures exhibit features similar to that of the metallic foil that decrease as the O2 increases. At the same time, a peak at the distance corresponding to the Cu-O appears. The refinements of the EXAFS spectra provided the structural parameters that are presented in Table IV together with data from literature for Cu2 O and CuAlO2 references.32,33 It should be noted that the weaker the contribution to the total signal, the larger the error affecting the corresponding structural parameter value. Usually the Debye-Waller factor is the parameter affected by
205402-5
PHYSICAL REVIEW B 66, 205402 共2002兲
R. SERNA et al.
FIG. 5. The XANES spectra of the Cu:Al2 O3 nanocomposite films. The spectra obtained for metallic Cu and Cu oxide 共CuO兲 references are included for comparison. The dashed lines are a guide for the eye. The numbers on the curves make reference to the oxygen pressure, in mbar, at which the Cu was deposited, or was exposed to after deposition 共curve marked post兲.
the largest uncertainty and this explains the peculiar value reported for the weak Cu-O contribution in the vacuum grown film ( 2 ⫽0⫾5⫻10⫺3 Å2 ). The results presented in Table IV reveal that the sample grown in vacuum has a metallic Cu structure with a very small Cu-O contribution that stays at the Cu-O distance of CuO. In the film deposited at 2.6⫻10⫺4 O2 mbar and the one subjected to an oxygen atmosphere after metal deposition, the oxidized Cu contribution is well defined and the Cu-O distance is shorter 共1.88 and 1.85 Å, respectively兲. A Cu-Cu contribution is still present with a distance close to the metallic one. Hence the systems are made either of 共i兲 Cu NC’s with an oxidized surface or 共ii兲 Cu NC’s coexisting with Cu atoms in an oxide phase. In the EXAFS spectra of the film grown at 6.6 ⫻10⫺3 O2 mbar, a rather broad and weak Cu-Cu contribution at 2.85 Å and a Cu-O contribution at 1.94 Å are found, while the metallic Cu-Cu contribution at 2.55 Å is not detected. The Cu-O distance and coordination number are similar to that in CuO, but the Cu-Cu distance is significantly TABLE III. The results from the XANES analysis. The percentage of oxidized Cu is quoted using CuO and Cu foil as references. No distinction is possible between CuO and Cu2O. Sample/ P O2 共mbar兲
% oxidized Cu
Cu reference CuO reference Vacuum 2.6⫻10⫺4 1.3⫻10⫺1 a a
Oxygen exposure after deposition for 5 min.
0 100 8⫾5 17⫾5 30⫾5
FIG. 6. The EXAFS spectra of the Cu:Al2 O3 nanocomposite films. The spectra obtained for metallic Cu and Cu oxide 共CuO兲 references are included for comparison. The numbers on the curves refer to the oxygen pressure, in mbar, at which the Cu was deposited, or was exposed to after deposition 共curve marked post兲.
shorter: 2.85 Å in the sample versus an average value of 3.03 Å in CuO.31 This system is thus clearly different from the two previous ones. IV. DISCUSSION
We have synthesized composite nanostructured films formed by amorphous Al2 O3 containing embedded layers of Cu with a period of ⬇10 nm, and by varying the preparation conditions we have been able to change the morphology and chemical composition of the Cu deposits from pure metallic NC’s to a complex layered oxide structure. Thus the optical and structural properties of the films exhibit a strong dependence on the presence of oxygen applied either during or after Cu deposition. We will start the discussion with the films showing a SPR band, i.e., those with the Cu deposited at oxygen pressures lower than 2.6⫻10⫺4 mbar and those exposed to oxygen after Cu deposition. GISAXS and XAS measurements show that the film with the Cu deposited in vacuum has NCs formed by metallic Cu. This is in agreement with previous TEM observations,3,7,12,16 and results from a Volmer-Weber growth mechanism. From the GISAXS data it has been determined a NC average size ¯ ⫽4.8 nm and an aspect ratio H ¯ /D ¯ ⫽0.67 corresponding of to an oblate shape 共see Table II兲. It has been reported by D’Acapito and co-workers34,35 that Cu NC’s prepared by ion implantation in glasses display a spherical shape due to a three-dimensional and isotropic atom diffusion process. For nanocomposite films prepared by PLD, different nucleation and growth processes occur by surface diffusion of the incoming species. Thus the oblate shape of our NC’s is due to the preparation technique used here where the large interfa-
205402-6
PHYSICAL REVIEW B 66, 205402 共2002兲
EFFECT OF OXYGEN PRESSURE ON THE OPTICAL . . .
FIG. 7. Fourier transforms 共imaginary part and modulus兲 of the k-weighted EXAFS spectra of Fig. 6 共continuous lines兲 and of the simulated signals 共dashed lines兲. Line A indicates the Cu-O distance in the Cu oxide, and line B indicates the Cu-Cu distance in the metallic Cu. The numbers on the curves make reference to the oxygen pressure, in mbar, at which the Cu was deposited, or was exposed to after deposition 共curve marked post兲. Note the difference in the imaginary part for films deposited at 6.6⫻10⫺3 mbar compared to the other films.
cial energy of the metal/oxide system plays a significant role.36,37 GISAXS results show that the apparent Cu atomic content, 关 Cu兴 * , determined from the measured average volume of the NCs and assuming the Cu bulk density, gives a value lower than that measured by RBS, 关 Cu兴 : 关 Cu兴 * / 关 Cu兴 ⬇0.71. This suggests that there is a fraction of Cu that is not contributing to the analyzed GISAXS signal. It should be noted that the scattered intensity is proportional to the sixth power of the NC radius, and thus the larger NC’s dominate the scattering pattern. Therefore, the lower amount of Cu detected by GISAXS suggests the presence of isolated Cu atoms dissolved in the matrix or small NC’s coexisting with larger detectable ones. Regarding the local atomic environment of Cu, it can be observed from the EXAFS analysis of the film grown in vacuum, that there is a very slight decrease of the Cu-Cu coordination number compared to that of the Cu reference 共10.7 vs 12; see Table IV兲. In the case of NCs, it has been shown that there are size-dependent effects and that the coordination number depends on the diameter through structure-dependent formulas.38 GISAXS measurements give an average particle size of 4.8 nm which implies a reduction of the coordination number to about 11. This is in good agreement with the EXAFS finding of 10.7⫾0.6. Nevertheless it can be observed that the predicted reduction in the coordination number is small due to the relatively large
size of the NC’s, and it should be noted that it is within the same order of magnitude as the EXAFS error. Therefore it is not reasonable to speculate on the coordination number reduction due to NC size effects. In addition, there are a few Cu-O bonds 共the coordination number is low, 0.8兲 corresponding to the Cu-O distance for the first shell in CuO. Thus the weak Cu-O contribution in the EXAFS signal can be related mainly to the Cu atoms located at the NC-matrix interface, although the existence of some small CuO clusters that are not contributing to the GISAXS intensity cannot be ruled out. These results suggest that it is most likely that a large fraction of the Cu is forming pure Cu NC’s. The apparent weak reactivity of Cu NC’s with the Al2 O3 host is not surprising, since it has been reported that Al2 O3 acts as a suitable diffusion barrier for Cu at low temperatures creating a well-defined interface.39 For the films with Cu deposited at 2.6⫻10⫺4 mbar and with Cu exposed to oxygen after deposition, the effect of the oxygen on the morphology of the NC’s is not very strong, although it can be noticed that the average sizes are slightly smaller than the ones found in the film grown in vacuum. ¯ /D ¯ ) of the ellipsoidal NC’s Nevertheless, the aspect ratio (H ⫺4 produced at 2.6⫻10 mbar is smaller than that of NC’s produced in vacuum. It should be noted that such an effect is not observed in the Cu NC’s exposed to O2 after deposition. In this latter case the reduction in size occurs in both dimensions. This means that the oxygen environment during deposition tends to favor the growth of the NC’s in the film plane compared to that in the perpendicular direction. The observed change in the morphology of the NC’s could be due to a reduced adatom mobility caused by the presence of oxygen, not only in the atmosphere, but also at the Al2 O3 surface where the Cu NC’s are being formed. This process is similar to that reported for Cu NC’s deposited on Al2 O3 共0001兲 surfaces with different degrees of oxidation: the Cu NC sizes were smaller on oxidized than on reduced surfaces.40 In contrast, when the oxygen is introduced after the deposition of the NC’s, surface diffusion of Cu is unlikely. The most likely process is that oxidation is initiated at the surface of pure Cu NC’s 共having characteristics similar to those in the film grown in vacuum兲 without significant changes in the original NC aspect ratio. Compared to the vacuum films, the local Cu structure is clearly affected by the presence of oxygen in the films grown at 2.6⫻10⫺4 mbar and in the films exposed to oxygen after deposition. The presence of the SPR in the absorption spectra of these films, together with the evidence of Cu-Cu metallic bonds by EXAFS, suggests that there are still metallic NC’s in these films. Nevertheless, XANES results show that a nonnegligible amount of Cu is oxidized. The presence of oxidized Cu is confirmed by the EXAFS study which not only reveals a reduction in the Cu-Cu coordination number, but also the existence of Cu atoms bonded to O with an increase in the Cu-O coordination number. By using the film grown in vacuum as a reference, we can evaluate the relative amount of oxidized Cu in the other films from the ratio between the number of Cu neighbors: we obtain 100⫻ 关 1⫺(9.1/10.7) 兴 ⫽15% for the film grown at 2.6⫻10⫺4 mbar and 100⫻ 关 1 ⫺(6.5/10.7) 兴 ⫽39% for the film with Cu NC’s exposed to
205402-7
PHYSICAL REVIEW B 66, 205402 共2002兲
R. SERNA et al.
TABLE IV. The results from the EXAFS anaysis: type of neighbor 共Cu or O兲, number of nearest neighbors 共coordination number兲, corrsponding distance and Debye-Waller factor, 2 , giving the mean square relative displacement. Data for Cu2O and CuAlO2 have been obtained from Refs. 32 and 33, respectively. Error bars are calculated using the procedure described in Ref. 23 and do not take directly into account systematic errors.
oxygen after deposition. In a similar manner, by using the film grown in vacuum as a reference, we can calculate the reduction in the relative amount of Cu not detected by GISAXS from the 关 Cu兴 * / 关 Cu兴 ratios displayed in Table II. We obtain 100⫻ 关 1⫺(0.60/0.71) 兴 ⫽15% for the film grown at 2.6⫻10⫺4 mbar and 100⫻ 关 1⫺(0.55/0.71) 兴 ⫽23% for the film with Cu NC’s exposed to oxygen after deposition. The comparison of the relative amount of oxidized Cu as determined from EXAFS to the reduction in the 关 Cu兴 * / 关 Cu兴 ratios measured from GISAXS suggests that most of the oxidized Cu is not detected by GISAXS in the film grown at 2.6⫻10⫺4 mbar, while a large fraction of the oxidized Cu phase is detected by GISAXS in the film with Cu NCs exposed to oxygen after deposition. In addition, where the Cu NC’s were exposed to oxygen after deposition, the Cu-O distance determined from EXAFS corresponds well to the first shell for Cu2 O, while in the film grown at 2.6 ⫻10⫺4 mbar the Cu-O distance is between those of Cu2 O and CuO. Consequently, it can be suggested that when O2 is introduced in the chamber during deposition, there is a metal-oxide phase separation and the oxide phase grows at an expense of extracting Cu from the metallic Cu NC’s. According to this interpretation, there are 共i兲 small Cu2 O NC’s distributed in the matrix 共not seen by GISAXS兲 that give rise to a Cu共I兲-O (Cu2 O) contribution in the EXAFS signal and, 共ii兲 large metallic Cu NC’s 共very similar to those detected by GISAXS in the film grown in vacuum兲 with Cu-O bonds located at the surface, giving rise to a weak Cu共II兲-O 共CuO兲 contribution. In contrast, when O2 is introduced after deposition, in addition to the small Cu2 O NCs not seen by GISAXS, a large fraction of the oxidized Cu might form a
Cu2 O shell around the large NC’s detected by GISAXS. It should be noted that GISAXS is sensitive to electron density contrast between the NC’s and the matrix. By considering NC’s made of a Cu core surrounded by a Cu2 O shell embedded in an Al2 O3 matrix with interdiffusion at the Cu/Cu2 O and Cu2 O/Al2 O3 interfaces, the electronic density decreases toward the surface of the NCs. Therefore, the GISAXS signal is measuring a NC size slightly larger than that of the core, but smaller than that of the core plus the Cu2 O shell, leading to an underestimation of the NC size. Regarding the optical response, the reduction in the relative amount of metallic Cu in the films deposited at 2.6 ⫻10⫺4 mbar or exposed to oxygen at 1.3⫻10⫺1 mbar after deposition, compared to that of the film deposited in vacuum, can qualitatively explain the observed reduction of absorption of the SPR band in these films. The negligible displacement of the SPR maximum for both films with respect to that in vacuum is also in agreement with the small variations in the NC’s size determined from GISAXS analysis, since it has been observed experimentally that for particles with average diameters between 2 and 15 nm, the SPR peak position is independent of particle size.4,8,26 For the film with Cu NC’s exposed to oxygen at 1.3⫻10⫺1 mbar after deposition, the optical response seems still to be dominated by the metallic Cu core of the NC’s. Lorentzian fits to the experimental spectra have been performed to analyze the evolution of the width of the SPR band. It is found that the band shifts from 195 nm for the films with the Cu deposited in vacuum to 220 nm for the film with Cu exposed to oxygen at 1.3 ⫻10⫺1 mbar after deposition. This increase could be related
205402-8
EFFECT OF OXYGEN PRESSURE ON THE OPTICAL . . .
PHYSICAL REVIEW B 66, 205402 共2002兲
to a core/shell structure with blurred interfaces. However, the effect of the oxide shell on the optical properties of the Cu NCs is not clear and should be the subject of further investigation. The films with Cu deposited at 6.6⫻10⫺3 mbar clearly show a different behavior from the films discussed previously in both their structural an optical properties. In this case, the SPR associated with the presence of metallic Cu NC’s has completely disappeared. The features of these spectra are characteristic of a material showing an optical band gap. A plot of ( ␣ h ) 2 as a function of h 共not shown兲, where ␣ is the absorption coefficient and h is the photon energy in eV, allows the optical band-edge absorption to be determined to be 2.8 eV. This optical bandgap falls between those of crystalline bulk CuO and Cu2 O 共1.4 and 2.2 eV, respectively兲 共Ref. 13兲 and that reported for CuAlO2 共3.5 eV兲.14 This might be an indication of a mixture of several oxides. The analysis of the structural properties of these films by GISAXS shows no small-angle scattering signal, and thus suggests the absence of NC’s and the formation of a continuous layer giving rise to a nonspecular diffuse scattering along the vertical beam stop 关see Fig. 3共b兲兴. The XANES spectra of the films resemble that of the CuO reference, and the EXAFS analysis shows a Cu-O distance and a number of neighbors compatible with CuO. However, the EXAFS results also show the presence of a signal corresponding to Cu-Cu distances at 2.85 Å, which are significantly larger than the Cu-Cu distances in metallic Cu 共2.55 Å兲 and shorter than those in CuO 共3.03 Å兲 and Cu2 O 共3.02 Å兲. This intermediate Cu-O distance value and the large Debye-Waller factor suggests a mixture of disordered oxides, eventually mixed with a disordered aluminate AlCuO2 and is in agreement with the result of the optical band gap value. Indeed, around Cu in CuAlO2 there are 6 Cu neighbors at 2.86 Å,33 which compares quite well with the corresponding values found experimentally. To justify the Cu-O average distance found, we must invoke the presence of both Cu共II兲 and Cu共I兲 species, where Cu共II兲 species are in an amorphous CuO form and Cu共I兲 species are probably in a CuAlO2 -like form. In fact, the formation of a Cu⫺Al bond might occur at the Cu oxide/Al2 O3 interface when the Al2 O3 is subsequently deposited, by a reaction that can be simply described as: Al2 O3 ⫹Cu2 O→2CuAlO2 . Nevertheless, for the films deposited at 6.6⫻10⫺3 mbar, it is difficult to determine which is the exact structure and a nonstoichiometric Cu-Al-O compound cannot be excluded.
V. CONCLUSIONS
*Electronic address:
[email protected] †
Present address: Laboratoire de Me´tallurgie Physique, UMR 6630 CNRS, Universite´ de Poitiers, SP2MI, Te´le´port 2, Bvd M. et P. Curie, BP 30179, 86962 Futuroscope Chasseneuil Cedex, France 1 C. Flytzanis, F. Hache, M. C. Klein, D. Ricard, and Ph. Rousignol, Nonlinear Optics in Composite Materials 共Elsevier Science, Amsterdam, 1991兲; C. Flytzanis, Beam Shaping and Control with Nonlinear Optics 共Plenum, New York, 1998兲. 2 G.I. Stegeman and E.M. Wright, Opt. Quantum Electron. 22, 95 共1990兲. 3 J.M. Ballesteros, R. Serna, J. Solis, C.N. Afonso, A.K. Petford-
Nanocomposite Cu:Al2 O3 films have been produced by PLD, and the effect of oxygen pressure during and after Cu deposition has been studied. It has been found that when Cu is deposited in vacuum, Cu NC’s of average size ⬃4.8 nm and oblate in shape 共aspect ratio ⬃0.7) are formed and embedded in the Al2 O3 matrix. In that case, the oxidation of Cu is negligible and the optical properties are dominated by metallic Cu, suggesting a very limited interaction at the Cu NCs/Al2 O3 matrix interface. The interface seems to be formed by Cu-O bonds at the average distance of CuO. When the Cu NC’s are prepared in vacuum and then exposed to oxygen after deposition the presence of metallic Cu is detected by XAS and the optical absorption features are still dominated by the metallic Cu NC’s. Nevertheless, oxidation of the Cu is also observed and this is consistent with an oxidation process initiated at the surface of the NC’s and probably leads to the formation of a Cu2 O shell. When oxygen is introduced in the chamber during deposition at intermediate pressures, the morphology of the NC’s is similar to that in vacuum and the presence of metallic Cu still dominates the optical response and the XANES/EXAFS signals. However, the presence of oxidized Cu is evidenced by XAS in the form of small Cu2 O NCs not detected by GISAXS, giving rise to a decrease of the optical absorption and a damping of the SPR band. For the NC’s prepared at the highest oxygen pressure (6.6⫻10⫺3 mbar), Cu reacts with O2 to form a continuous layer of disordered CuO and Cu2 O, and upon the subsequent deposition of Al2 O3 there is most probably a reaction at the interface forming AlCuO2 . The formation of this mixed oxide layer is in agreement with the absence of the GISAXS signal and the SPR band, and with the optical bandgap calculated from the absorption measurements. ACKNOWLEDGMENTS
We are grateful to the technical staff of LURE-DCI for providing the synchrotron beam and for assistance during the x-ray experiments. This work was partially supported by TIC99-0866, CICYT 共Spain兲, and by the CSIC-CNRS 2000FR0026 agreement for travel funds. D. B. and E. F. acknowledge support from the EU through a Marie Curie fellow grant 共Contract Nos. HPMF-CT-2000-00736 and HPMF-CT-2001-01125, respectively兲.
Long, D.H. Osborne, and R.F. Haglund, Jr., Appl. Phys. Lett. 71, 2445 共1997兲. 4 U. Kreibig and M. Vollmer, Optical Properties of Metal Clusters 共Springer Verlag, Berlin, 1995兲. 5 C. N. Afonso, in Insulating Materials for Optoelectronics 共World Scientific, Singapore, 1995兲, Ch. 1. 6 R. Serna, J.C.G. de Sande, J.M. Ballesteros, and C.N. Afonso, J. Appl. Phys. 84, 4509 共1998兲. 7 R. Serna, J. Gonzalo, A. Sua´rez-Garcı´a, C.N. Afonso, J.P. Barnes, A.K. Petford-Long, R.C. Doole, and D. Hole, J. Microsc. 201, 250 共2001兲.
205402-9
PHYSICAL REVIEW B 66, 205402 共2002兲
R. SERNA et al. 8
J.C.G. de Sande, R. Serna, J. Gonzalo, C.N. Afonso, D.E. Hole, and A. Naudon, J. Appl. Phys. 91, 1536 共2002兲. 9 N.M. Dempsey, L. Ranno, D. Givord, J. Gonzalo, R. Serna, G.T. Fei, A.K. Petford-Long, R.C. Doole, and D.E. Hole, J. Appl. Phys. 90, 6268 共2001兲. 10 T. Yoshida, S. Takeyama, Y. Yamada, and K. Mutoh, Appl. Phys. Lett. 68, 1772 共1996兲. 11 S. Ohtsuka, K. Tsunemoto, T. Koyama, and S. Tanaka, Opt. Mater. 21, 209 共1993兲. 12 C.N. Afonso, J. Gonzalo, R. Serna, J.C.G. de Sande, C. Ricolleau, C. Grigis, M. Gandais, D.E. Hole, and P.D. Townsend, Appl. Phys. A: Mater. Sci Process 69, S201 共1999兲. 13 C. G. Ribbing and A. Roos, Handbook of Optical Constants of Solid II, edited by E. D. Palik, 共San Diego, CA, 1998兲. 14 H. Gong, Y. Wang, and Y. Luo, Appl. Phys. Lett. 76, 3959 共2000兲. 15 H. Kawazoe, M. Yasukawa, H. Hyodo, M. Kurita, H. Yanagi, and H. Hosono, Nature 共London兲 389, 939 共1997兲. 16 R. Serna, C.N. Afonso, J.M. Ballesteros, A. Naudon, D. Babonneau, and A.K. Petford-Long, App. Surf. Sci. 138-139, 1 共1999兲. 17 L.R. Doolitle, Nucl. Instrum. Methods Phys. Res. B 9, 344 共1985兲. 18 CRC Handbook of Chemistry and Physics, edited by D. R. Lide 共CRC Press, Boston, MA, 1998兲. 19 A. Naudon and D. Thiaudie`re, J. Appl. Crystallog. 30, 822 共1997兲. 20 D. Babonneau, I.R. Videnovic´, M.G. Garnier, and P. Oelhafen, Phys. Rev. B 63, 195401 共2001兲. 21 J.S. Pedersen, J. Appl. Crystallogr. 27, 595 共1994兲. 22 G. Tourillon, E. Dartyge, A. Fontaine, M. Lemonnier, and F. Bartol, Phys. Lett. A 121, 251 共1987兲. 23 E.A. Stern, M. Newville, B. Ravel, Y. Yacoby, and D. Haskel, Physica B 208-209, 117 共1995兲.
A.L. Ankudinov and J.J. Rehr, Phys. Rev. B 62, 2437 共2000兲. J.J. Rehr and R.C. Albers, Rev. Mod. Phys. 72, 621 共2000兲. 26 R. Serna, J. Gonzalo, C.N. Afonso, and J.C.G. De Sande, Appl. Phys. B: Lasers Opt. 73, 339 共2001兲. 27 D. Babonneau, F. Petroff, J.-L. Maurice, F. Fettar, and A. Vaure`s, Appl. Phys. Lett. 76, 2892 共2000兲. 28 A. Guinier and G. Fournet, Small-Angle Scattering of X-Rays 共Wiley, New York, 1955兲. 29 N.W. Ashcroft and J. Lekner, Phys. Rev. 145, 83 共1966兲. 30 V. Holy´ and T. Baumbach, Phys. Rev. B 49, 10668 共1994兲. 31 S. Åsbrink and A. Was´kowska, J. Phys.: Condens. Matter 3, 8173 共1991兲. 32 R. Restori and D. Schwarzenbach, Crystallogr. Sect. B: Struct. Sci. 42, 201 共1986兲. 33 T. Ishiguro, A. Kitazawa, N. Muzitani, and M. Kato, J. Solid State Chem. 40, 170 共1981兲. 34 F. Gonella, E. Cattaruzza, G. Battaglin, F. D’Acapito, C. Sada, P. Mazzoldi, C. Maurizio, G. Mattei, A. Martorana, A. Longo, and F. Zontone, J. Non-Cryst. Solids 280, 241 共2001兲. 35 F. D’Acapito, S. Mobilio, J.R. Regnard, E. Cattaruzza, F. Gonella, and P. Mazzoldi, J. Non-Cryst. Solids 232-234, 364 共1998兲. 36 C. Noguera, Metal Oxide Interfaces in Physics and Chemistry at Oxide Surfaces 共Cambridge University Press, Cambridge, 1996兲. 37 R. Serna, C.N. Afonso, C. Ricolleau, Y. Wang, Y. Zheng, M. Gandais, and I. Vickridge, Appl. Phys. A Mater Sci. Process 71, 583 共2000兲. 38 H.G. Fritche and R.E. Benfield, Z. Phys. D 26, S15 共1993兲. 39 J.G. Chen, M.L. Colaianni, W.H. Weinberg, and J.T. Yates, Jr., Surf. Sci. 279, 223 共1992兲. 40 S. Gota, M. Gautier, L. Douillard, N. Thromat, J.P. Duraud, and P. Le Fe`vre, Surf. Sci. 323, 163 共1995兲. 24 25
205402-10