Proceedings of 2013 IAHR World Congress
Effect of Pipeline Orientation on Scour Mechanism in Unidirectional Steady Flow Mohd. Azlan Mohd Yusoff1*, Hazi Md. Azamathulla1 , Zorkeflee Abu Hasan1, Nor Azazi Zakaria1, Mohd Zulkifly Abdullah2 1 River Engineering and Urban Drainage Research Centre (REDAC), Universiti Sains Malaysia, Engineering Campus 14300 Nibong Tebal, Malaysia. 2
School of Mechanical Engineering, Universiti Sains Malaysia, Engineering Campus, 14300 Nibong Tebal, Malaysia *Corresponding Author, Email:
[email protected] Email address:
[email protected] ( H. Md. Azamathulla),
[email protected] ( Z., Abu Hasan),
[email protected] ( N. A. Zakaria),
[email protected] ( M. Z. Abdullah)
ABSTRACT: The 3-dimensional flow velocity components at several different points, which are distributed equally across the channel width and the associated scour hole, are measured in order to investigate the flow components and scour mechanism around fully submerged pipeline across the channel. Three different pipeline orientations, which are 30°, 60° and 90° from the side wall of the channel are installed at fully developed flow point in the main channel. A 3-dimensional down-looking acoustic Doppler velocimeter (ADV) is then used to measure the flow velocities at several points across and along the channel. The effect of the pipeline orientation, the flow characteristics, the horseshoe vortex effect and other associated factors is discussed in the paper. KEY WORDS: Pipeline scour, 3-dimensional scour, Scour mechanism, Pipeline orientation, Flow structures 1 INTRODUCTION Scour constitutes an important field of research due to its frequent occurrence in engineering applications. Since scour formation downstream of a hydraulic structure is a safety issue, designers have to carefully estimate the ultimate scour depth. Since long time this analysis is performed by means of empirical expressions, mostly developed from physical model tests and prototype observations. However, to date, no universal formula has been found capable of modeling the complexity flow downstream of hydraulic structures. The underlying erosion process is complicated and it depends on the interaction of hydraulic, geotechnical, and hydrologic (discharges varying with time) conditions. Structure failures induced by scour such pipeline occur in extreme cases of unsteady flows interacting with changing channel conditions (Breusers and Raudkivi, 1991). There several physical and numerical studies have been made on the offshore pipeline on moveable bed but fewer experiences on local scouring induced by waves are available compared with currents. The free span of pipeline is susceptible for damage due to natural process and environmental forces of human activities which may cause severe problems environmentally and economically (Mousave et. al., 2009). The implementation of flow visualization using 3-dimensional down-looking acoustic Dopples velocimeter (ADV) provide the 3-dimensional flow velocity components at the span shoulder where the unidirectional steady current was measured in order to investigate the flow structure and mechanics of the lateral propagation 3-D pipeline scour hole (Wu and Chiew, 2012). Generally, local scour occur due to several condition i.e. (a) flow condition, (b) Structure, (c) riverbed material, which very severe in hydraulic problems especially for structure failure at either at river or ocean. There many difficulties were encountered by past research studies in terms of considering the riverbed material and scour changes on time varies to the equivalent scour development stage. For my point of view, the research scope should be focus on the mechanism of the scour itself so that we can understand exactly the process. The influenced by the shear-stress applied on the boundary between the riverbed and the structure need to be investigate, so that we can understand the scour
phenomenon and the effect of time on scour depth, the shear-stress around hydraulic structures and the particles critical shear-stress. In 2009, Chen and Zhang have reviewed the pipelines scour in three perspectives, i.e., two-dimensional physical scour modeling, three-dimensional physical scour modeling, and numerical scour modeling. By assuming that a pipeline is laid on an erodible bed in currents, the sediment soil and flow conditions are the same along the pipeline length, the two-dimensional (2-D) analysis has been conducted. The onset scour phenomenon attributed to the seepage flow underneath the pipeline, which caused by a large jump of pressure or difference relative pressure coefficient (Cp) between the upstream and downstream sides (Mao, 1988). Scour can be classified into three categories which are; local scour that usually occur around single piles, global or dishpan scour that occur at a shallow wide under and around individual installations, and overall sea bed movement. The failure of bridges due to scour will result in economical loss and may also result in losses of human life. Likewise, scour caused by pipeline on riverbed is also significant. Pipeline and its erodible bed under strong current and/or wave conditions may cause scour around the pipelines. This process involves the complexities of both the three-dimensional flow pattern and sediment movement. Scour underneath the pipeline may expose a section of the pipe, causing it to become unsupported. If the free span of the pipe is long enough, the pipe may experience resonant flow-induced oscillations, leading to settlement and potentially structural failure. Accurate estimate of the scour depth is important in the design of submerged pipelines (Chiew, 1991). The estimation of the scour characteristics of underwater pipelines continues to be a concern for hydraulic engineers. The three-dimensional flow field around the pipelines extremely complicated due to the separation and multiple vortices that occur around the pipes. The complexity of the flow is further exaggerated due to the dynamic interaction between the flow and movable boundary in the process of obtaining equilibrium scour hole. Most of the present study of the pipeline scouring focused on the sea condition whereas less study has been done on the river condition. As at the best of my knowledge and literature review, less research that is conducted for the scour development vicinity submerged pipeline on the sand bed under river environment. Therefore, the main aim of this research is to conduct experimental simulations of scour caused by pipeline across river. Previous research stated that the scour hole under the pipelines could be regarded as a function of Froude number and of a dimensionless clearance between the pipe and the undisturbed bed (Maza, 1987). A physical model will be constructed in hydraulic laboratory. There are two different of scour view of scour which are the 2-D and 3-D scour. The 2-D scour occur in conjunction to the tunnel erosion and lee-wake effect while the 3-D scour focusing on the scour around the span shoulders. The 3-d scour depend on the flow, the soil characteristics and pipe stiffness. The continuous process of the scour along the pipeline will resulted to the self burial of the pipe. The experimental simulations will focus on the tunnel erosion. To create the tunnel erosion condition, the pipe will be installed on the river bed. The continuous erosion process will create free-span of the pipe. The free-span pipe will create vibration and slowly affected the sediment recess vicinity the pipe. Data such as dimension of the scour hole and corresponding hydraulic parameters such as flow and water depth will be collected from the physical simulations. A number of empirical formulas have been developed in the past to estimate equilibrium scour depth below pipelines, including Chao and Hennessy (1972), Kjeldsen et al., (1973), Ibrahim and Nalluri (1986), Dutch research group (Bijker and Leeuwestein, 1984), Moncada and Aguirre (1999), and Chiew (1991). The numerous techniques and methodologies for the prediction of the maximum scour depth below pipelines were proposed by various investigators but a few are found suitable and easily applicable (Dey and Singh, 2008). The upstream scour profiles prediction using numerical method and application of modified von Muller method integrated with the sediment bed-load continuity equation, respectively has been simulated by Hansen et al.(1986). Although numerous researched have been conducted to study the scour process, none of the research discussed about the impact and influenced of skew angle, θ on the scour profiles. This study reviews some of the parameters that affected the scour profiles as well as the new parameter which is the skew angle, θ of the pipeline orientation. 2 EXPERIMENTATION Experiments were conducted in a concrete man-made flume of 12 m long, 1.5 m wide and 0.9 deep located in the REDAC Physical Hydraulic Laboratory. The arrangement of the experiment setup is shown in Figure 1. The flume was divided into 3 section which are the false floor, sediment recess and sediment basin The false floor was locate after the inlet sump with the length of 3 m. The sediment recess was 7 m
2
long, 1.5 m wide and 0.3 deep, located 3 m from downstream the flume inlet which is after the false floor. The sediment basin was located at the downstream part to cater the sediment that transported through the channel, purposely. The pipeline model, which is circular pipes with 5 cm of diameter is placed across the flume channel at 30˚, 60˚ and 90˚ and on the sediment bed. Sand and gravel bed will be used for these experiments. The gravel was located after the false to control the scour after the false floor. The uniformly sediment with median diameters 0.58 mm was used in the experiments. The experiments were conducted for two different water levels. The water level was set in accordance to the pipe diameter which 3D and 4D, where D = pipe diameter. According to Chiew (1991a), the scour development under the pipeline is not significant if the upstream water depth exceeds four time the pipe diameter (4D), D = diameter for the pipe. Previously, HR Wallingford (1972) has considered that the deep water conditions approximately greater than 3 times the pipe diameter from the prototype behaviour pipelines at an estuarine site that he examined and this condition confirmed by Kjeldsen et al. (1974). The flow depth in the flume was controlled by the adjustable gate located at the downstream. The slope of the sediment recess was set 1:1000. The false floor was constructed because the fully developed velocity is not significant at early stage. The fully developed flow velocity occur after the 3 meter. In other hand, the false floor used to maintain the sediment bed level throughout the upstream reach.
1.5
Test Pipe made of Perspex in various sizes (3 to 7 cm) and
Flow Test Angle:
12 (a) Plan View of Proposed Test Channel
0.9
Flow
Test Pipe made of Perspex in various sizes (3 to 7 cm) and shapes 0.3m thick sediment layer ( l d d)
Adjustable Gate
7m (b) Longitudinal Section of Proposed Test Channel
Figure 1 Arrangement of physical model setup
In order to avoid the undesirable scour profiles at early stage, the test channel is filled with water up to 100 mm. So, the pipe was submerged at early stage. The water will flow in the test channel until it reached the desire depth for experiments. Then, experiments were run until the scour profile reached the equilibrium state. The average flow velocity depends on the flow intensity V/Vc. The experiments were conducted in a clear water scour conditions where the flow intensity, V/Vc less than 1. The threshold velocity was estimated using the shear stress approach, ζ/ζc = (U*/U*c)2. The total duration of each experiment was allowed until the scour profile achieved the equilibrium state. After reached the equilibrium state, the water is drained out and the maximum scour profile is measured. 3 PHYSICAL OBSERVATIONS The scour profiles were observed physical where the scour depth, scour width and scour length along the pipe enlarged rapidly with time duration. The scour process occured at the downstream part of the pipe while the sediment is at rest at the upstream part. From the observations, it is proved that the experiments were conducted in clear water conditions. It is very important to know whether the experiments either in clear water scour or live bed scour. The scour location for the whole experiments was at the downstream as shown in Figure 2.
3
Figure 2 Scour location for clear water conditions.
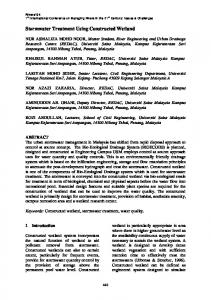
The scour profiles (depth and width) for the skew angle, 30° and 60° moved near to the left bank. The tendency of the maximum scour depth and width are near the left bank as shown in Figure 3. It can be concluded that the skew angle moved the critical point of scour profiles to one side. According to Chiew (1991a), the scour is not significant for water depth exceed 4D and Wallingford considered the 3D as the significant deep. However, the experiments results show that the scour profiles were still occurred but it takes quite a long time with total duration to achieved the equilibrium is 56 hours while for 3D is 48 hours. Figure 4 show the relationship between time and scour profiles
Figure 4 Relationship between the scour profiles (depth, width, length) and the time to achieve equilibrium state.
4
Width (cm)
5.8
6
6.2
6.4
6.6
6.8
7
7.2
7.4
7.6
7.8
8
8.2
8.4
8.6
8.8
9
Scour Depth (cm)
8 50
100
150
200
250
Distance from left bank (cm)
(a) Scour contour for 30° of skew angle
Width (cm)
10.1 10 9.9 9.8 9.7 9.6 9.5 9.4 9.3 9.2 9.1 9 8.9 8.8 8.7 8.6 8.5 8.4
Scour Depth (cm)
12 20
40
60
80
100
120
140
160
Distance from left bank (cm)
(b) Scour contour for 60° of skew angle. Figure 3 Scour contour of the maximum scour profiles.
Velocity (m/s)
The flow velocity in the channel was taken using a Micro Acoustic Doppler Velocimeter (ADV) to capture flow pattern and hydraulic efficiency. The velocity measurement was taken at three section which are Section A which is 1 ft from the pipe location, section B which 2 ft from pipe location, and section C which is 3 ft from pipe location. There are seven points at each section. Although, the tendency of maximum scour profiles for the skew angle, θ of pipe is near the left bank, the velocity distributions along the horizontal line were not too significant to each others. The velocities distributions almost average at the middle section unless near the side wall due to the frictional effect. Figure 5 show the velocity distributions along the horizontal line.
0.2 Y 0.4 Y 0.6 Y
0.125 0.120 0.115 0.110 0.105 0.100 0.095 0.090 0.085 0.080 0.075 0.070 0.065 0.060 0.055 0.050 0.045 0.040 0.035 0.0
0.2
0.4
0.6
0.8
1.0
1.2
1.4
Distance from left bank (m)
Figure 5 Velocity distributions along the horizontal line.
5
4 CONCLUSIONS The maximum scour profiles below the submerged pipeline achieved the equilibrium state when the scour dimension stagnant for quite a long period. After achieved the equilibrium state, the maximum scour profiles were tabulated in scour contours form. The skew angle, θ of pipe has moved the maximum scour location to the left side compared to the 90° of pipe arrangement. The skew angle, θ has changed the direction of the flow velocity and vortex effect to the left side. Furthermore, the maximum scour depth and width for the skew angle much lower than the pipe perpendicular across the channel. In general, the impact of the skew angle on the scour profiles is quite significant and the maximum scour takes a long period to achieve the equilibrium state. Further research with various sediment sizes, pipe diameter, water level and group pipes need to conduct to study the impact of the skew angle, θ. 5 ACKNOWLEDGEMENT The authors take the opportunity to thank the Director of River Engineering and Urban Drainage Centre (REDAC) for giving the chance to conduct the experiments at their facilities. Authors are grateful to University Sains Malaysia for providing intensive grant. References Bijker, E. W., and Leeuwestein, W. (1984). Interaction between pipelines and the seabed under influence of waves and currents.” Proc.,Symp. on Int. Union of Theoretical Chao, J.L. and Hennessy, P.V. (1972). Local scour under ocean outfall pipe-lines. Water Pollut. Control Fed., 44(7), 1443–1447. Chen, C., and Zhang, J., (2009).” A review on scour modeling below pipelines.” J. Pipelines Sys. And Engr. Practice. 1019-1028. Chiew, Y.M., (1991). Prediction of maximum scour depth at submarine pipelines. J. Hydraulic Engineering , 117 (4), 452-466. Dey, S., and Singh, N. P. (2008). “ Clear-water scour below underwater pipelines under steady flow”. J. Hydraul. Eng., 134 (5), 588-600. Ibrahim, A., and Nalluri, C. (1986). “Scour prediction around marine pipelines.” Proc., 5th Int. Symp. on offshore Mechanics and Arctic Engineering, 679–684. Kjeldsen, S. P., Gjørsvik, O., Bringaker, K. G., and Jacobsen, J. (1973). “Local scour near offshore pipelines.” Proc., 2nd Int. Conf. on Port and Ocean Engineering under Arctic Conditions, Univ. of Iceland, 308–331. Moncada-M., A.T. and Aguirre-Pe, J. (1999). Scour below pipeline in river crossings. J. of Hydraulic Engineering, 125(9), 953–958. Sumer, B. M., Truelsen, C., Sichmann, T., and Fredsoe, J. (2001).” Onset of scour below pipelines and self-burial.” Coastal Eng. Mousavi, M., E., Bakhtiary, A.,Y., and Enshaei, N., (2009).” The Equivalent depth of Wave-Induced Scour Around Offshore Pipelines.” Journla of Offshore Mechanics and Arctic Engineering (ASME) Vol. 1, May 2009. Wu., Y. amd Chiew, Y-Meng.(2012).” Mechanics of Three-dimenisonal Pipeline Scour in Unidirectional Steady current.” Journal of Pipeline –Engineering and Practice. ASCE June 15,02012.
6