386
Nowak et al.: Effect of Plot and Sample Size on Timing and Precision
Arboriculture & Urban Forestry 2008. 34(6):386–390.
Effect of Plot and Sample Size on Timing and Precision of Urban Forest Assessments David J. Nowak, Jeffrey T. Walton, Jack C. Stevens, Daniel E. Crane, and Robert E. Hoehn Abstract. Accurate field data can be used to assess ecosystem services from trees and to improve urban forest management, yet little is known about the optimization of field data collection in the urban environment. Various field and Geographic Information System (GIS) tests were performed to help understand how time costs and precision of tree population estimates change with varying plot and sample sizes in urban areas using random sampling approaches. Using one-tenth acre (0.04 ha) plots, it is estimated that, on average, approximately three plots per day can be measured with plot data collected on several variables for all trees greater than 1 in (2.54 cm) in diameter along with general plot, ground cover, and shrub data. A field crew of two people can gather approximately 200 one-tenth acre (0.04 ha) plots during a 14 week summer field season depending on city traffic, city area, and tree cover conditions. These 200 plots typically yield approximately a 12% relative standard error on the total number of trees. Key Words. Tree measurement; urban forest monitoring; urban forest sampling.
Measuring the urban forest structure (i.e., species composition, number of trees, tree sizes and locations, tree health) can give managers and planners a basis with which to develop and evaluate programs for managing urban trees and forests throughout a city. In addition, long-term monitoring of urban forest structure can provide essential data related to rates and factors of change affecting population totals, tree mortality, tree planting and natural regeneration, tree health, and species changes. An accurate quantification of urban forest structure is also needed to assess the various ecosystem services and values provided by the urban forest. Urban vegetation, particularly trees, provides numerous benefits that can improve environmental quality and human health in and around urban areas. These benefits include improvements in air and water quality, building energy conservation, cooler air temperatures, reductions in ultraviolet radiation, and many other environmental and social benefits (Nowak and Dwyer 2007). By having accurate information on urban forest structure, managers can understand what the current urban forest provides in terms of various environmental benefits and also alter the structure of the urban forest (e.g., tree plantings, species and site selections, and tree maintenance and removals) to enhance these benefits in the future. One of the best ways to assess the entire urban forest is through sampling procedures. However, varying sample and plot sizes affect total cost (time) of data collection and the precision of the urban forest estimate. The purpose of this article is to illustrate, based on field data collection tests, how plot and sample size of randomly located circular plots in urban areas can affect data collection time, number of permissions needed to access plots, and precision of tree cover and total tree population estimates. These types of data have been lacking related to urban forest sampling and can be useful in developing sampling schemes to help provide desired precision of estimates and understand the costs associated with obtaining that precision. ©2008 International Society of Arboriculture
METHODS Effect of Plot Size on Data Collection Time and Total Population Estimate Precision To estimate the effect of plot size on time needed to collect field data and on total population estimates, a random sample of 26 residential plots (from a total of 100 residential plots that were measured and analyzed using the Urban Forest Effects [UFORE] model in Syracuse, NY, U.S. [Nowak and Crane 2000; Nowak and O’Connor 2001]) were measured and timed using a field crew of two people. Crews were trained before field data collection and were experienced in urban forest field data collection. For each plot, permission was obtained from the lot owner (where the plot center was located) by knocking on the front door of the lot residence. If the plot encompassed more than one lot, additional lot owners were contacted for permission if trees in those additional lots were located within the plot boundary. On each plot, all UFORE variables (i-Tree 2007) were collected on concentric one-twenty-fourth acre (24 ft radius circle), one-tenth (37.2 ft radius), and one-sixth acre plots (48.1 ft radius) (0.0168 ha [7.3 m radius], 0.04 ha [11.3 m radius], and 0.067 ha [14.7 m radius] plots, respectively). These variables include several tree variables (e.g., species, diameter at breast height, crown, and health parameters) on all trees greater than 1 in (2.54 cm) in diameter at breast height (4.5 ft [1.37 m]) and general plot information (e.g., location, plot center, tree and shrub cover), ground cover types, and general shrub types and dimensions. Electronic distance measuring devices were used to record trees distances from plot center and tree heights. Data collection also included measures of general plot slope and aspect. Data collection was cumulatively timed moving from the smallest to largest plot and number of access permissions needed was recorded. Average measurement time, number of lots accessed, and number of trees along with associated standard errors were assessed for each plot design. In addition, an estimated total number of trees in the residential area was calculated and compared with an estimate using 100 one-tenth acre (0.04 ha) plots
Arboriculture & Urban Forestry 34(6): November 2008
387
to illustrate how plot size affects the total tree and standard error estimate. Average plot time for field plot setup, cover estimates, and measurements per tree were used to estimate how average field measurement time would likely vary as tree cover changes. In a separate analysis, an additional test of plot size and plot design was conducted using GIS tree cover, land use, and parcel data for the city of Syracuse. Five hundred points were randomly distributed throughout the city. At each point, the following seven different plot sizes or designs were constructed around the point using GIS: 1) one-twenty-fourth acre (0.017 ha) circular plot; 2) one-twelfth acre (0.034 ha) circular plot; 3) one-tenth (0.04 ha) circular plot; 4) one-eight acre (0.05 ha) circular plot; 5) one-sixth acre (0.067 ha) circular plot; 6) one-fourth acre (0.1 ha) circular plot; and 7) four one-twenty-fourth acre (0.017 ha) circular plots (cluster plot) using the USDA Forest Service Forest Inventory and Analysis (FIA) plot design (USDA Forest Service 2000). With this cluster plot design, three subplots were established 120 ft (36.6 m) from the center subplot at 120°, 240°, and 360° azimuths. For each of the plot sizes and designs, total amount of tree cover within the plot was assessed using a 2 ft (0.61 m) resolution tree cover map (Myeong et al. 2003), and the number of parcels and associated number and area of land uses in each parcel within the plot design was recorded using a digital land use parcel map. The average amount of permissions required for each plot design was categorized among three classes: 1) permission required (residential land use parcels); 2) permission questionable—uncertain if crew would need to obtain permission (commercial/industrial, institutional, utility/transportation parcels); and 3) no permission needed (greenspace, street rightof-ways, and vacant parcels) to assess how permissions would vary based on plot size and design. The average percent of plot area within the parcel that contained the plot center was also calculated. This calculation was done to help determine how
much of the plot area would require the crew to move to an additional parcel and how much of that extra plot space would require additional permissions. Mean tree cover and standard error for each plot design were calculated and compared with the actual tree cover as classified by the tree cover map.
Effect of Sample Size on Total Population Estimate Precision To determine the effect of sample size on the standard error estimate for the total tree population, sample data from 14 cities were analyzed using the UFORE model (Nowak and Crane 2000; Nowak et al. 2002) (Table 1). For each city, population total, standard error (SE), and relative SE were calculated. The relative SE is a measure of estimated reliability and is the ratio of SE to the estimate, in this case, population total (SE/total × 100) (US Department of Health and Human Services, Centers for Disease Control and Prevention 2007). Eleven of the cities were sampled using a stratified random sampling approach, and three using a randomized grid approach, which was used to facilitate long-term monitoring of urban forest change. Standard error for each city was standardized to a population size of 200 plots using the formula: SE ⳱ standard deviation/√n. The average SE using 200 plots was calculated for the 14 cities and used to illustrate how SE of the total tree population estimate will vary as sample size varies between 10 and 500 plots.
RESULTS Effect of Plot Size on Data Collection Time and Total Population Estimate Precision Increasing plot size from a one-twenty-fourth acre (0.017 ha) plot to a one-sixth acre (0.067 ha) plot nearly doubled the amount of time needed to measure the plot variables, but also nearly cut in half the relative standard error for the total popu-
Table 1. Estimates of total number of trees and standard errors from 14 cities analyzed using the UFORE model.z 200 ploty
Number of trees City
Total
SE
Year
No. plots
SE
RSE
Samplex
Atlanta, GAw Baltimore, MDv Boston, MAw Freehold, NJu Jersey City, NJu Minneapolis, MNt Moorestown, NJu Morgantown, WVs New York, NYw Philadelphia, PAw San Francisco, CAr Syracuse, NYv Washington DCq Woodbridge, NJu
9,415,000 2,571,000 1,183,000 48,000 136,000 979,000 583,000 658,000 5,212,000 2,113,000 668,000 876,000 1,928,000 986,000
749,000 494,000 109,000 6,000 22,000 165,000 53,000 79,000 719,000 211,000 98,000 119,000 224,000 97,000
1997 2004 1996 1998 1998 2004 2000 2004 1996 1996 2004 2001 2004 2000
205 200 217 144 220 110 206 136 206 210 194 197 201 215
758,000 494,000 114,000 5,000 23,000 122,000 54,000 65,000 729,000 216,000 97,000 119,000 224,000 100,000
8.1 19.2 9.6 10.1 16.7 12.5 9.3 9.9 14.0 10.2 14.5 13.5 11.6 10.2
Str. random Str. random Str. random Str. random Str. random Random grid Str. random Str. random Str. random Str. random Random grid Str. random Random grid Str. random
Average relative standard error ⳱ 12.1%. Estimated standard error (SE) and relative standard error (SE/total × 100; RSE) using a sample of 200 one-tenth acre (0.04 ha) plots. x Str. random ⳱ stratified random sample; random grid ⳱ randomized grid sample. w Data collection by ACRT, Inc. v Data collection by U.S. Forest Service. u Data collection by New Jersey Department of Environmental Protection. t Data collection by Davey Resource Group. s Data collection by West Virginia University. r Data collection by city personnel. q Data collection by Casey Trees Endowment Fund. z
y
©2008 International Society of Arboriculture
388
Nowak et al.: Effect of Plot and Sample Size on Timing and Precision
lation estimate (Table 2). Average time per plot increased from approximately 62 min (SE ⳱ 7.4) for a one-twenty-fourth acre plot (0.017 ha) to 106 min (SE ⳱ 14.0) for a one-sixth acre (0.067 ha) plot. Number of permissions (lots) also increased from an average 1.9 (SE ⳱ 0.1) to 3.1 (SE ⳱ 0.2), and number of trees measured per plot increased from 2.6 (SE ⳱ 1.1) to 6.5 (SE ⳱ 1.5). All three plot sizes produced total population estimates with a sampling error within 1 SE of the estimated population total of 251,000 trees, but as plot size increased, the total estimate moved closer to the 251,000 estimate and SE decreased (Table 2). The trend of the overall estimate decreasing with plot size (Table 2) suggests that the sample size was not large enough for the two smaller plot sizes. The effect of increasing the number of plots for the smaller plots sizes such that the total sample area remains the same among all plots sizes remains to be investigated. A similar pattern occurred when accessing tree cover from digital maps using plot sizes that ranged from one-twenty-fourth acre (0.017 ha) to one-fourth acre (0.1 ha), including an FIA cluster plot. Number of permissions increased and percent of plot in parcel with plot center decreased as plot size increased (Table 3). The one-fourth acre (0.1 ha) plot produced the closest estimate of actual tree cover value and had the lowest SE and relative SE. The one-twenty-fourth acre (0.017 ha) plot produced the estimate farthest from the actual tree cover value, although it was still within 1 SE from the true mean and had the highest SE and relative SE. The FIA cluster design, which is being used in the urban forest health monitoring program (Cumming et al. 2008), produced estimates of tree cover with a slightly higher SE and relative SE than a one-sixth acre (0.067 ha) single plot design. The FIA plot design also required nearly double the permissions of the one-sixth acre (0.067 ha) plot design (Table 3). Average time to set up a residential plot (e.g., gain permission and establish plot center) was 15.6 min (SE ⳱ 1.9); average time needed to estimate cover types was 12.8 min per plot (SE ⳱ 1.1). Thus, the average fixed time per plot was approximately 30 min. The average time to record all measurements on one tree was 12.2 min (SE ⳱ 0.9).
sion of an estimate at minimal cost. Unfortunately, there is not much information in the literature on costs of urban field plots and structural variability across the urban forest. A general rule of sampling is increasing the plot size and number of plots tends to increase precision, but at increased cost. Data presented in this article begin to reveal the increases in precision and time costs associated with different sample designs for sampling trees in urban areas. Assuming an average tree density of 204 trees per acre of urban tree cover (504 trees/ha cover) (Dwyer et al. 2000) and a national average tree cover of 27.1% (Nowak et al. 2001), the average time to set up and measure a one-tenth acre (0.04 ha) urban plot in the United States would be approximately 95 min (five plots per 8 hr day). However, this estimate does not include travel time. The longer the distance between plots and the slower the traffic, the fewer the number of plots that can be measured per day. This estimate also includes plot permissions; however, plots on several land uses often do not require permission and access setup time could be reduced. Also, the fewer the trees per plot or fewer variables measured, the more plots can be measured per day. A reasonable estimate of average number of onetenth acre (0.04 ha) plots per day for a field crew of two people would be approximately three plots per day for a full suite of tree and plot measurements in a midsized city. Number of plots per day will vary by the amount of tree cover in a region because when tree cover increases, the amount of time measuring trees increases. In desert regions, urban tree cover averages 9.3% (Nowak et al. 2001) and average plot setup and measurement time would be approximately 51 min. In grasslands (urban tree cover averages 17.8%), average plot time would be approximately 72 min. In forested areas (urban tree cover averages 34.4%), average plot time would be approximately 113 min. Again, these estimates do not include travel time or office time needed to establish plot locations and maps. The standard UFORE model sampling approach establishes approximately 200 one-tenth acre (0.04 ha) circular plots in randomized grid or stratified random sample. The selection of 200 plots was based on an estimated amount of plots that could be surveyed by field crew of two people during a summer season (14 weeks), given an average data collection rate of three plots per day. In some cities with high tree cover and/or traffic volumes, data collection will take longer than 14 weeks. In addition to data collection time, there are also costs associated with establishing the locations of the plots, transportation, equipment, data entry or data transfer, and data analysis and reporting costs. The use of 200 one-tenth acre (0.04 ha) plots produces a reasonable population estimate if a 12% RSE is acceptable to the user. Depending on the desired precision, a smaller sample size may provide adequate estimates of the urban forest population.
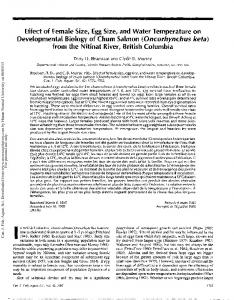
Effect of Sample Size on Total Population Estimate Precision The relative standard error (RSE) of total number of trees drops significantly with the first 50 to 100 one-tenth acre (0.04 ha) plots established, from 54.1% RSE with 10 plots to 17.1% RSE at 100 plots. After approximately 100 plots, the RSE continues to drop, but a reduced rate per additional plot (Figure 1). The average RSE for 200 plots is 12.1% (Table 1).
DISCUSSION The key to assessing urban forests is to determine the optimal number of plots and plot size needed to gain the desired preci-
Table 2. Average time, number of lots accessed, trees per plot, and total population estimate from 26 residential plots measured in Syracuse, New York, U.S. using different plot sizes. Time (min)
No. of lots z
No. trees per plot z
No. of residential trees
Plot size (ac)
Mean
SE
Mean
SE
Mean
SE
Range
Estimatey
SEz
RSEx
1/24 (0.017 ha) 1/10 (0.04 ha) 1/6 (0.067 ha)
61.8 84.1 106.1
7.4 9.9 14.0
1.9 2.8 3.1
0.1 0.2 0.2
2.6 4.6 6.5
1.1 1.3 1.5
0–27 0–33 0–34
429,998 316,968 267,922
178,366 90,708 61,220
41.5 28.6 22.8
z
z
Standard error. Actual estimated number based on 100 one-tenth acre (0.04 ha) plots is 251,000 trees (SE ⳱ 35,000). x Relative standard error. y
©2008 International Society of Arboriculture
Arboriculture & Urban Forestry 34(6): November 2008
389
Table 3. Effect of plot size and design on number of parcels per plot, number of access permissions required, and percent tree cover in Syracuse, NY, using 2 ft resolution tree cover and land use/parcel boundary maps of 500 randomly located plots. Percent of plot area Number of parcels Plot size (ac)
Total
Perm. req.
Perm. quest.
No perm.
First parcelv
1/24 1/12 1/10 1/8 1/6 1/4 FIAr
1.9 2.3 2.4 2.6 2.9 3.4 5.3
0.9 1.2 1.3 1.4 1.6 2.0 3.2
0.4 0.4 0.4 0.4 0.5 0.5 0.8
0.6 0.7 0.7 0.8 0.8 0.9 1.3
84 78 76 74 70 65 48
z
y
x
w
Additional parcels y
x
Percent tree cover w
Perm. req.
Perm. quest.
No perm.
Meanu
SEt
RSEs
9 13 14 15 17 20 27
2 3 3 4 4 5 8
5 7 7 7 8 8 17
25.8 26.1 26.2 26.3 26.4 26.6 26.2
1.1 0.9 0.8 0.8 0.7 0.6 0.8
4.1 3.3 3.1 2.9 2.6 2.2 3.0
1/24 ac ⳱ 0.017 ha; 1/12 ac ⳱ 0.034 ha; 1/10 ac ⳱ 0.04 ha; 1/8 ac ⳱ 0.05 ha; 1/6 ac ⳱ 0.067 ha; 1/4 ac ⳱ 0.1 ha. Permission required (residential land). x Permission requirement is questionable; uncertain if crew would need to obtain permission (commercial/industrial; institutional; utility/transportation). w No permission needed (greenspace; street right-of-way; vacant). v Average percent of plot within parcel where plot center is located. u Average tree cover in Syracuse ⳱ 26.6%. t Standard error. s Relative standard error (SE/mean × 100). r USDA Forest Service, Forest Inventory and Analysis plot design of four 1/24 ac (0.067 ha) subplots. z
y
However, when subdividing the analysis into smaller units (e.g., species, land use), the RSE will tend to increase. To increase precision for various estimates, more crews could be used to collect more plot data by either increasing plot size and/or increase the number of plots. In addition, stratification of plots in similar groups (e.g., land use classes, as done in the UFORE analyses) tends to increase precision. Increasing the number of plots from 200 to 500 will likely reduce the RSE on the total number of trees to 7.7% (a 36% reduction). Thus, increasing the number of plots enhances the precision of the estimate, but at an increased cost. A sampling of 150 to 200 plots is a reasonable sample size given the costs associated with measuring field plots during a summer season and a goal of maximizing reduction in SE of the estimates per unit cost. If sample size increases to greater than 200 plots, it is likely a second field crew will be needed to collect the additional plot data. Thus, increasing sample size to greater than 200 plots increases costs (adding an additional crew) with
relatively minimal gains in the reduction in SE as compared with the first 200 plots sampled. Increasing the plot size from onetenth acre (0.04 ha) to one-sixth acre (0.067 ha) will also likely reduce the RSE by approximately 16% to 20%. However, increasing the plot size will increase the number of permissions needing to be obtained for the sample and thus the overall project time required.
CONCLUSION Data gathered on urban forest structure is essential to improve urban forest management. Random sampling offers a relatively easy means to accurately assess urban forest structure and subsequently estimate its ecosystem services and values. The precision and cost of the estimate is dependent on sample and plot size. Managers need to plan their data collection procedures properly to ensure a desired precision of the estimate and adequately plan for data collection costs. Ensuring that the proper variables are collected will help guarantee that the data are useful for urban forest management. Incorporating these data within models to assess ecosystem services and values, and within longterm management and monitoring plans, can help improve urban forest health and sustain or increase urban tree cover and consequently environmental and human health in urban and urbanizing areas. Acknowledgments. This work was funded, in part, by the USDA Forest Service, Forest Health Monitoring Staff. We thank Sue Sissini for assistance with field data collection. We also thank Drs. Jerry Bond and John Stanovick for their review of an earlier draft of this manuscript.
LITERATURE CITED
Figure 1. Estimated relative standard error (SE/total × 100) of total number of trees based on varying number of total onetenth acre (0.04 ha) field plots.
Cumming, A.B., D.B. Twardus, and D.J. Nowak. 2008. Urban forest health monitoring: Large scale assessments in the United States. Arboriculture and Urban Forestry 34:341–346. Dwyer, J.F., D.J. Nowak, M.H. Noble, and S.M. Sisinni. 2000. Assessing our Nation’s Urban Forests: Connecting People With Ecosystems in the 21st Century. USDA Forest Service Gen. Tech. Rep. PNW460. 540 pp. i-Tree. 2007. i-Tree Software Suite v1.2 User’s Manual. www.itreetools. org (accessed 7/23/2007). ©2008 International Society of Arboriculture
390
Nowak et al.: Effect of Plot and Sample Size on Timing and Precision
Myeong, S., D.J. Nowak, P.F. Hopkins, and R.H. Brock. 2003. Urban cover mapping using digital, high-resolution aerial imagery. Urban Ecosystems 5:243–256. Nowak, D.J., and D.E. Crane. 2000. The urban forest effects (UFORE) model: Quantifying urban forest structure and functions, pp. 714–720. In Hansen M., and T. Burk (Eds.). Proceedings: Integrated Tools for Natural Resources Inventories in the 21st Century. IUFRO Conference, 16–20 August 1998, Boise, ID. General Technical Report NC-212, U.S. Department of Agriculture, Forest Service, North Central Research Station, St. Paul, MN. Nowak, D.J., D.E. Crane, J.C. Stevens, and M. Ibarra. 2002. Brooklyn’s Urban Forest. General Technical Report NE-290, U.S. Department of Agriculture, Forest Service, Northeastern Research Station, Newtown Square, PA. 107 pp. Nowak, D.J., and J.F. Dwyer. 2007. Understanding the benefits and costs of urban forest ecosystems, pp. 25–46. In Kuser, J. (Ed.). Urban and Community Forestry in the Northeast. Springer Science and Business Media, New York, NY. Nowak, D.J., M.H. Noble, S.M. Sisinni, and J.F. Dwyer. 2001. Assessing the U.S. urban forest resource. Journal of Forestry 99:37–42. Nowak, D.J., and P. O’Connor. 2001. Syracuse Urban Forest Master Plan: Guiding the City’s Forest Resource in the 21st Century. USDA Forest Service General Technical Report NE-287. 50 pp. USDA Forest Service. 2000. Forest Inventory and Analysis National Core Field Guide. Volume I: Field Data Collection Procedures for Phase 2 Plots. Northeast Core Field Guide v. 1.4.USDA Forest Service, Northeastern Research Station, Newtown Square, PA. US Department of Health and Human Services, Centers for Disease Control and Prevention. 2007. NCHS Definitions: Relative Standard Error. www.cdc.gov/nchs/datawh/nchsdefs/relativestandarderror.htm (accessed 10/22/2007).
David J. Nowak (corresponding author) USDA Forest Service Northern Research Station 5 Moon Library SUNY-ESF Syracuse, NY 13210, U.S.
[email protected] Jeffrey T. Walton Paul Smith’s College Department of Forestry, Natural Resources, and Recreation Routes 86 and 30 PO Box 265 Paul Smith’s, NY 12970-0265, U.S. Jack C. Stevens USDA Forest Service Northern Research Station 5 Moon Library SUNY-ESF Syracuse, NY 13210, U.S. Daniel E. Crane USDA Forest Service Northern Research Station 5 Moon Library SUNY-ESF Syracuse, NY 13210, U.S.
©2008 International Society of Arboriculture
Robert E. Hoehn USDA Forest Service Northern Research Station 5 Moon Library SUNY-ESF Syracuse, NY 13210, U.S.
Résumé. Des données de terrain précises peuvent être utilisées pour évaluer les bénéfices que procurent les arbres à un écosystème et pour améliorer la gestion de la forêt urbaine, encore que peu soit connu à propos de l’optimisation de la collecte des données de terrain dans un environnement urbain. Divers tests de terrains et de système d’informations géographiques ont été employés pour aider à comprendre comment les coûts en temps et le degré de précision des estimations de la population d’arbres peuvent changer en fonction de la variation des échantillons et de la taille de ces derniers en milieux urbains, et ce en utilisant des approches par échantillonnage aléatoire. Au moyen d’unités d’échantillonnage de 0,04 ha, il a été estimé qu’en moyenne trois unités d’échantillonnage pouvaient être mesurées par jour avec diverses données colligées pour les arbres de plus de 2,5 cm de D.H.P. en plus de données générales sur l’unité d’échantillonnage, le couvert au sol et les arbustes. Une équipe de deux personnes peut ainsi couvrir environ 200 unités d’échantillonnage en 14 semaines en été, et ce dépendant du degré de circulation de la ville, de la superficie de la ville et des conditions du couvert arboré. Ces 200 unités d’échantillonnage ont résulté en une erreur standard relative d’environ 12% par rapport au nombre total d’arbres. Zusammenfassung. Akkurate Felddaten können dazu verwendet werden, den Beitrag von Bäumen in ihrem Ökosystem zu bewerten und das urbane Forstmanagement zu verbessern. Dennoch ist wenig bekannt über die Optimierung der Datenerhebung in urbanen Räumen. Verschiedene Feld- und GIS-Tests wurden ausgeführt, um ein besseres Verständnis dafür zu erlangen, wie Zeitkosten und Schätzungen der Baumpopulation bei zufälligen Probenahmen mit der Größe der Fläche und der Probenmenge variieren können. Bei Probeflächen von 0,4 ha wird geschätzt, dass durchschnittlich ca. 3 Flächen pro Tag gemessen werden können, wobei zusammen mit allgemeinen Daten zur Fläche, Bodenbedeckung und Unterpflanzung die Daten von allen Bäumen über 2,5 cm Durchmesser gesammelt wurden. Ein Team von 2 Leuten kann während einer 14wöchigen Sommersaison und in Abhängigkeit von Verkehr, Stadtbereich und Bedeckungsgrad ca. 200 Flächen á 0,4 ha erfassen. Diese 200 Flächen bergen durchschnittlich in Bezug auf die Gesamtzahl der Bäume pro Einheit ca. 12 % Fehler. Resumen. Pueden utilizarse datos precisos para evaluar los servicios ambientales de los árboles y mejorar el manejo del bosque urbano, aunque aún no se conoce lo suficiente sobre la optimización de la colección de los datos de campo en el ambiente urbano. Se realizaron varias pruebas de campo y GIS para ayudar a entender cómo los costos en tiempo y precisión de la estimación de la población de árboles cambia con la variación de del tamaño y forma de la parcela en áreas urbanas usando aproximaciones por muestreo al azar. Con el uso de parcelas de una décima de acre (0.04 ha), se estima que, en promedio, aproximadamente tres parcelas por día pueden ser medidas con los datos colectados en varias variables para todos los árboles mayores a 2.5 cm (1 pulg) en diámetro junto con la parcela general, cobertura y datos de arbustos. Un equipo de campo de dos personas puede levantar aproximadamente 200 parcelas de una décima de acre durante una estación de verano de 14 semanas dependiendo del tráfico de la ciudad, área de la ciudad y condiciones de cobertura. Estas 200 parcelas típicamente rinden aproximadamente un 12% de error relativo estándar sobre el número total de árboles.