JOURNAL OF BACTERIOLOGY, June 2006, p. 4253–4263 0021-9193/06/$08.00⫹0 doi:10.1128/JB.00001-06 Copyright © 2006, American Society for Microbiology. All Rights Reserved.
Vol. 188, No. 12
Effect of Repeat Copy Number on Variable-Number Tandem Repeat Mutations in Escherichia coli O157:H7 Amy J. Vogler, Christine Keys,‡ Yoshimi Nemoto, Rebecca E. Colman, Zack Jay,† and Paul Keim* Department of Biological Sciences, Northern Arizona University, Flagstaff, Arizona 86011-5640 Received 2 January 2006/Accepted 14 February 2006
Variable-number tandem repeat (VNTR) loci have shown a remarkable ability to discriminate among isolates of the recently emerged clonal pathogen Escherichia coli O157:H7, making them a very useful molecular epidemiological tool. However, little is known about the rates at which these sequences mutate, the factors that affect mutation rates, or the mechanisms by which mutations occur at these loci. Here, we measure mutation rates for 28 VNTR loci and investigate the effects of repeat copy number and mismatch repair on mutation rate using in vitro-generated populations for 10 E. coli O157:H7 strains. We find single-locus rates as high as 7.0 ⴛ 10ⴚ4 mutations/generation and a combined 28-locus rate of 6.4 ⴛ 10ⴚ4 mutations/generation. We observed single- and multirepeat mutations that were consistent with a slipped-strand mispairing mutation model, as well as a smaller number of large repeat copy number mutations that were consistent with recombinationmediated events. Repeat copy number within an array was strongly correlated with mutation rate both at the most mutable locus, O157-10 (r2 ⴝ 0.565, P ⴝ 0.0196), and across all mutating loci. The combined locus model was significant whether locus O157-10 was included (r2 ⴝ 0.833, P < 0.0001) or excluded (r2 ⴝ 0.452, P < 0.0001) from the analysis. Deficient mismatch repair did not affect mutation rate at any of the 28 VNTRs with repeat unit sizes of >5 bp, although a poly(G) homomeric tract was destabilized in the mutS strain. Finally, we describe a general model for VNTR mutations that encompasses insertions and deletions, single- and multiple-repeat mutations, and their relative frequencies based upon our empirical mutation rate data. the number of repeated sequence units (27). In other cases, VNTRs affect the actual amino acid sequence of proteins, rather than merely affecting transcription levels (27). VNTR loci located within or near genes should therefore be observed for signs of altered phenotypic and selective effects. However, in general, VNTR variation has not been associated with known biological effects and variation at many VNTR loci is likely selectively neutral (24). Regardless, the mutational processes generating VNTR variation should be similar whether a particular locus is under selection or not. The variation generated at VNTR loci provides a high level of subtyping discriminatory power, making VNTRs very useful molecular epidemiological markers (13, 18). Typically, VNTR molecular subtyping systems consist of a series of VNTR loci around which PCR primers are designed. The resulting amplicons are then separated by electrophoresis. Differences in amplicon size at individual loci are assumed to be due to variation in repeat copy number at that locus, and the banding/peak patterns are scored accordingly. The use of different fluorescent dyes and amplicon size ranges allows multiple loci to be multiplexed and analyzed simultaneously. These multilocus VNTR analysis (MLVA) subtyping systems have provided unprecedented differentiation among strains of bacterial species previously thought to have very little sequence variation otherwise. These subtyping systems have been highly successful at differentiating among strains of a number of pathogens (for a review see reference 18). These MLVA systems have also been useful on multiple geographic scales, providing useful genetic discrimination whether the populations were worldwide (1, 12, 15) or regional (10, 15) or from a localized outbreak (10). An understanding of VNTR mutational rates and the factors affecting mutational rates would make them more effective for
Variable-number tandem repeats (VNTRs) represent some of the most diverse genomic loci in bacterial populations. They consist of short sequences (known as repeat units or motifs) that are repeated in tandem and have been shown to vary in repeat copy number. Repeat copy number variation at these loci is the result of INDEL mutations resulting in the gain or loss of some number of repeat units and can lead to a very large number of alleles (27). These INDEL mutations are thought to occur via an intramolecular slipped-strand mispairing (SSM), which involves the dissociation and “out-of-register” realignment of the nascent and template DNA strands during replication or repair. This process can lead to the insertion or deletion of one or more repeat units depending upon if the looped-out repeats are on the nascent or template strand, respectively (5, 17). Recombination may also play a role, especially in mutations involving large numbers of repeat units (17), although SSM is thought to be the predominant mutational mechanism (5, 7, 24). Although many VNTRs have no phenotypic effect and generate neutral genetic variation, some VNTR loci can alter important biological functions. A well-documented example is phase variation in organisms such as Haemophilus influenzae, Neisseria meningitidis, and Mycoplasma hyorhinis (27). In these pathogens, homopolymeric or dinucleotide repeats located between the ⫺35 and ⫺10 regions of the promoter differentially affect transcription of downstream genes, dependent upon
* Corresponding author. Mailing address: Department of Biological Sciences, Northern Arizona University, Flagstaff, AZ 86011-5640. Phone: (928) 523-1078. Fax: (928) 523-0639. E-mail:
[email protected]. † Present address: Montana State University, Bozeman, Mont. ‡ Present address: U.S. FDA Center for Food Safety and Applied Nutrition, College Park, Md. 4253
4254
VOGLER ET AL.
J. BACTERIOL. TABLE 1. E. coli O157:H7 strains
Strain
Sourcea
Original source
ATCC 700927 01A7146 01A6820 H6436 F6750 DEC4C Spain 401 Spain 41 EC536 (wtc) EC1212 (mutS)
ATCC CA Dept. of Health CA Dept. of Health CDC CDC STEC Center LREC LREC CFSAN CFSAN
Derived from ATCC 43895, an HC d outbreak strain Human feces Human feces Human No data Buffalo Cow Human
O157-10 repeat copy numberb
17.67 59.67 41.67 9.67 28.67 48.67 25.67 66.67 29.67 29.67
a ATCC, American Type Culture Collection; CDC, Centers for Disease Control and Prevention; LREC, Laboratorio de Referencia de E. coli (Spain); CFSAN, Center for Food Safety and Applied Nutrition; CA Dept. of Health, California Department of Health; STEC Center, Shiga Toxin-Producing E. coli Center. b Repeat copy number reflects the fact that a partial repeat unit is present in the available sequenced strains in addition to the full repeat units. c wt, wild type. d HC, hemorrhagic colitis.
epidemiological or microbial forensic investigations. Mutational rate estimates allow for probabilistic modeling of genetic relatedness. In turn, probabilistic modeling can provide statistical confidence measures that are critical in forensic or epidemiological situations for source attribution or identification of true versus fortuitous disease clusters. This approach was recently applied to a pair of New York City tourists who contracted plague (19). Using a probabilistic model developed from VNTR mutation rate data, Lowell et al. (2005) were able to assess the probability that the tourists had contracted the disease at their rural home in New Mexico as opposed to some other more nefarious urban source. The rapid mutation rates at VNTR loci are thought to be the result of the compounding effects of various factors intrinsic to these loci. Such factors include repeat copy number, repeat unit size and sequence purity, and the functionality of the mismatch repair system (5, 7, 24). Of these, the most important factor seems to be repeat copy number, and any other factor should be evaluated only after the effect of repeat copy number has been accounted for (24). Repeat copy number effects appear to apply both across loci (2, 29) and within an individual locus across different alleles (30). However, most of these studies focused on only dinucleotide repeats or neglected to directly measure mutation rates, substituting locus diversity instead. Finally, the exact relationship between repeat copy number and mutation rate remains unclear (24). Both the amount of mutation rate variation explainable by repeat copy number and the linearity or nonlinearity of the relationship are still relatively unknown. Studies specific to bacterial VNTRs are also lacking, despite their increased use in genotyping. Here, we estimate mutation rates for 28 Escherichia coli O157:H7 VNTR loci by performing a series of parallel, serial passage experiments (PSPEs) on nine diverse E. coli O157:H7 strains and an isogenic derivative (mutS) of one of the diverse strains. We investigate the effects of repeat copy number on mutation rate by estimating and comparing single-locus (O15710) mutation rates for nine diverse strains where repeat copy number ranged from 9 to 66. We further investigate array size effect upon mutation rate by examining repeat copy number correlations across loci. Finally, we investigate the effect of mismatch repair on mutation rate by comparing overall mutation rates between a wild-type E. coli O157:H7 strain (EC536)
and its isogenic derivative, a mutator (mutS) strain (EC1212). These data and their analysis will provide the foundation for evolutionarily based models for molecular epidemiological investigations.
MATERIALS AND METHODS Strains. Strains used in this study are listed in Table 1. Strains ATCC 700927, 01A7146, 01A6820, H6436, F6750, DEC4C, Spain 401, and Spain 41 were selected for their wide range of locus O157-10 repeat copy numbers (Table 1), so as to test the effect of repeat copy number on mutation rate at a particularly diverse VNTR locus. Strains EC536 and EC1212 are a paired set of strains that were chosen to examine the effect of mismatch repair on mutation rate. EC1212 is a mutS knockout derived from EC536 that was constructed using the Datsenko and Wanner allele replacement procedure (3). The mutS phenotype of EC1212 was confirmed by comparing spontaneous rates of rifampin resistance between EC536 and EC1212 using a Luria-Delbru ¨ck fluctuation test (20). Data from EC1212 were not used to determine combined VNTR mutation rates in E. coli O157:H7 or for the analysis of repeat copy number effects on mutation rate due to the mutant status of the strain and to avoid using data from two strains with identical repeat copy numbers. PSPEs and detection of mutations. PSPEs have been previously described for Yersinia pestis (10). Here, we performed similar PSPEs on 10 E. coli O157:H7 strains (Table 1), generating a set of in vitro populations representing ⬃291,000 total generations. Briefly, each PSPE consisted of 96 or 100 independent clonal lineages that were each serially passaged 10 or 40 times. For each of the PSPEs, a single isolated colony of the strain (T ⫽ 0) was used to start 96 or 100 independent clonal lineages by streaking for single colonies on 48 or 50 halved tryptic soy agar plates, respectively. All cultures were grown at 37°C for 24 h before the next passage. Each lineage was then serially passaged 10 or 40 times by streaking from a single colony from the previous passage. Strain ATCC 700927’s lineages were passaged 40 times, while the remaining nine strains’ lineages were passaged 10 times. The paired EC536 and EC1212 PSPEs were done with 100 lineages while the remaining PSPEs all involved 96 lineages. DNA was extracted from all 96 or 100 lineages at T ⫽ 10 for the T ⫽ 10 passage experiments and at T ⫽ 09, T ⫽ 19, and T ⫽ 40 for the T ⫽ 40 passage experiment using a simple heat lysis protocol (12). Mutational events for each strain were then visualized using MLVA, as previously described (14). As a confirmation of the fragment sizing scoring, we analyzed 34 mutational products and parental alleles to verify that detected mutations were due to changes in repeat copy number. Twenty-eight of the 37 previously described MLVA loci were used in the analysis. The remaining nine loci were not analyzed since they showed no diversity among geographically diverse E. coli O157:H7 isolates in the previous study and were therefore not expected to mutate in the PSPEs (14). Mutational events and products for nine of the strains were determined from an analysis of the T ⫽ 10 populations. Mutational events and products for strain ATCC 700927, however, were determined from an analysis of three time points (T ⫽ 09, T ⫽ 19, and T ⫽ 40) due to the increased likelihood of multiple mutational events occurring at the same locus and in the same lineage. The two
VOL. 188, 2006
EFFECT OF REPEAT COPY NUMBER ON VNTR MUTATIONS
4255
TABLE 2. Mutation rates and products for 10 E. coli O157:H7 strains No. of single-repeat insertions
No. of multiple-repeat insertions
Total no. of deletions
No. of single-repeat deletions
No. of multiple-repeat deletions
0 1 1 1 2 0 1 1 1 0 1
0 1 1 0 1 0 1 1 1 0 1
0 0 0 1 1 0 0 0 0 0 0
10 20.4
9 18.4
7 14.3
1 1 8 1 1
0 1 2 0 0
0 4 8 0 0
0 3 6 0 0
0 1 2 0 0
15 55.6
12 44.4
3 11.1
12 44.4
9 33.3
3 11.1
3.9E-05 7.8E-05 3.9E-05 3.9E-04 4.1E-05 3.9E-05
1 0 1 4 0 1
1 0 1 3 0 1
0 0 0 1 0 0
0 2 0 6 1 0
0 2 0 4 1 0
0 0 0 2 0 0
16
6.5E-04
7 43.8
6 37.5
9 56.3
7 43.8
2 12.5
3 4 1
1.2E-04 1.5E-04 4.0E-05
2 3 1
1 3 1
1 0 0
1 1 0
1 1 0
0 0 0
8
3.2E-04
6 75.0
5 62.5
1 12.5
2 25.0
2 25.0
15 1 1
6.0E-04 4.1E-05 4.1E-05
7 1 1
4 1 1
3 0 0
8 0 0
5 0 0
3 0 0
17
6.9E-04
9 52.9
6 35.3
3 17.6
8 47.1
5 29.4
3 17.6
1 1 8 1 1
4.0E-05 4.0E-05 3.3E-04 3.9E-05 3.9E-05
0 1 6 1 1
0 1 4 1 1
0 0 2 0 0
1 0 2 0 0
1 0 0 0 0
0 0 2 0 0
12
5.1E-04
9 75.0
7 58.3
2 16.7
3 25.0
1 1
4.3E-05 3.9E-05
1 1
0 1
1 0
0 0
Strain or data group and locus
Repeat motif (bp)
nb
Total no. of mutations
ATCC 700927 O157-3 O157-4 O157-5 O157-9 O157-10 O157-11 O157-17 O157-19 O157-36a O157-37a O157-45
6 33 57/30 6 6 6 6 6 7 6 5
91 92 86 90 94 94 95 86 93 80 95
2 1 3 2 32 1 3 1 2 1 1
2.0E-05 1.0E-05 3.2E-05 2.1E-05 3.2E-04 9.9E-06 2.9E-05 1.1E-05 2.0E-05 1.2E-05 9.8E-06
2 0 2 1 30 1 2 0 1 1 0
2 0 2 1 20 1 2 0 1 1 0
0 0 0 0 10 0 0 0 0 0 0
49
5.0E-04
40 81.6
30 61.2
1 6 18 1 1
3.9E-05 2.3E-04 7.0E-04 4.0E-05 4.2E-05
1 2 10 1 1
27
1.2E-03
1 2 1 10 1 1
Total %
01A7146 O157-6 O157-9 O157-10 O157-25 O157-36a
8 6 6 6 7
96 95 95 92 89
Total %
01A6820 O157-2 O157-3 O157-4 O157-10 O157-17 O157-36a
6 6 33 6 6 7
95 95 95 95 90 94
Total %
H6436 O157-3 O157-10 O157-13
6 6 9
96 96 92
Total %
F6750 O157-10 O157-25 O157-36a
6 6 7
93 90 90
Total %
DEC4C O157-3 O157-9 O157-10 O157-11 O157-25
6 6 6 6 6
93 92 91 96 95
Total %
Spain 401 O157-5 O157-9
57/30 6
87 94
Mutation rate
Total no. of insertions
1 6.3
1 8.3
0 0
2 4.1
0 0.0
2 16.7
0 0
Continued on following page
4256
VOGLER ET AL.
J. BACTERIOL. TABLE 2—Continued
Strain or data group and locus O157-10 O157-13 O157-17 O157-36a O157-37a
b c
No. of multiple-repeat deletions
3.9E-04 4.5E-05 4.0E-05 4.1E-05 1.6E-04
4 1 1 0 3
1 1 1 0 2
3 0 0 0 1
6 0 0 1 1
5 0 0 1 1
1 0 0 0 0
19
8.6E-04
11 57.9
6 31.6
5 26.3
8 42.1
7 36.8
1 17 1 1
4.3E-05 6.6E-04 4.3E-05 3.9E-05
0 10 1 0
0 9 1 0
0 1 0 0
1 7 0 1
1 6 0 0
0 1 0 1
20
8.2E-04
11 55.0
10 50.0
9 45.0
7 35.0
2 10.0
1 1 10 5 1
3.7E-05 3.7E-05 3.7E-04 1.9E-04 3.7E-05
1 0 5 1 1
1 0 5 0 1
0 1 5 4 0
0 1 2 2 0
0 0 3 2 0
18
6.7E-04
8 44.4
7 38.9
10 55.6
5 27.8
5 27.8
1 1 1 12 2
3.7E-05 3.7E-05 3.7E-05 4.5E-04 7.4E-05
1 0 1 7 0
1 0 1 5 0
0 0 0 2 0
0 1 0 5 2
0 0 0 4 2
0 1 0 1 0
17
6.3E-04
9 52.9
7 41.2
2 11.8
8 47.1
6 35.3
2 11.8
1 1 8 2 4 2 11 124 7 2 6 2 3 7 5 1
3.4E-06 3.5E-06 3.2E-05 6.6E-06 1.4E-05 6.6E-06 3.6E-05 4.0E-04 2.3E-05 6.7E-06 2.0E-05 7.0E-06 1.0E-05 2.3E-05 1.8E-05 3.4E-06
0 1 4 1 3 2 5 79 3 2 4 1 3 4 4 0
0 1 3 1 2 2 4 57 2 2 4 1 3 4 3 0
0 0 1 0 1 0 1 22 1 0 0 0 0 0 1 0
1 0 4 1 1 0 6 45 4 0 2 1 0 3 1 1
1 0 4 1 1 0 4 30 2 0 2 1 0 2 1 1
0 0 0 0 0 0 2 15 2 0 0 0 0 1 0 0
186
6.4E-04
116 62.4
89 47.8
27 14.5
70 37.6
50 26.9
20 10.8
10 1 1 1 4
15 6 6 7
86 96 86 95
8 6 6 6 6
100 100 100 100 100
6 8 6 6 6
100 100 100 100 100
15 6 6 33 57/30 8 6 6 6 9 6 6 6 7 6 5
Total % a
No. of single-repeat deletions
94 83 92 91 92
Total %
Combined data for all wt PSPE populations O157-1 O157-2 O157-3 O157-4 O157-5 O157-6 O157-9 O157-10 O157-11 O157-13 O157-17 O157-19 O157-25 O157-36a O157-37a O157-45
Total no. of deletions
6 9 6 7 6
Total %
EC1212 (mutS) O157-3 O157-6 O157-9 O157-10 O157-11
No. of multiple-repeat insertions
Total no. of mutations
Total %
EC536 (wtc) O157-6 O157-9 O157-10 O157-11 O157-17
No. of single-repeat insertions
nb
Total %
Spain 41 O157-1 O157-10 O157-19 O157-36a
Total no. of insertions
Repeat motif (bp)
Mutation rate
1 5.0
0 0 0 1 0 1 5.6
1 5.3
Locus is on pO157 plasmid. Number of lineages with usable data. wt, wild type.
earlier time points were used to detect these rare occurrences so that they could be added to the total mutations apparent at T ⫽ 40. Mutation rate calculations. Single-locus and combined 28-locus mutation rates were estimated for each strain by dividing the observed number of muta-
tions by the number of total generations. The number of total generations was calculated as the average number of generations/colony ⫻ the number of lineages with usable data ⫻ the number of transfers. The number of generations per colony was the same for all calculations and was determined to be ⬃27.0 gen-
VOL. 188, 2006
EFFECT OF REPEAT COPY NUMBER ON VNTR MUTATIONS
4257
erations/colony using an average of viable plate count results from all the strains. The number of lineages used in each individual strain single-locus calculation is listed in Table 2 as “n.” The number of lineages used in the combined singlelocus mutation rates was based on an average of the number of lineages with usable data across all nine strains for each locus. The number of lineages used in the combined 28-locus mutation rate calculations was based on an average of the number of lineages with usable data across all 28 loci for each individual strain calculation and an average of the number of lineages with usable data across all 28 loci and all nine strains for the combined strain calculations. In all, the nine PSPEs used to calculate combined VNTR mutation rates in E. coli O157:H7 encompassed a total of 2.9 ⫻ 105 generations, allowing the estimation of combined single-locus mutation rates greater than ⬃3.4 ⫻ 10⫺6 mutations/locus/ generation. Analysis of relationship between mutation rate and diversity. We compared diversity measures calculated from a large strain panel and mutation rate estimates from the PSPEs to examine the relationship between mutation rate and diversity. A strain panel of 344 globally diverse O157/O55 isolates (list available upon request) was used to calculate diversity (D) and allele number, two measures of natural diversity, for the 28 MLVA loci examined. Diversity was calculated as 1 ⫺ ⌺(allele frequencies)2 while allele number was simply the total number of alleles observed for a given locus in the isolate set. Regressions of both measures of diversity on mutation rate were performed in order to examine the relationship between mutation rate and diversity. Regressions were performed both with and without data from the most diverse locus, O157-10, due to the unusual outlier status of this locus and its strong impact on the data set (i.e., locus O157-10 data represented two-thirds of the total mutation rate data). Analysis of repeat copy number and mismatch repair effects. The effect of repeat copy number on mutation rate was analyzed at a single diverse locus and across all mutating loci. A regression of locus O157-10 mutation rate on locus O157-10 repeat copy number across the nine strains was used to examine the effects of repeat copy number without the potential confounding effects of any other repeat-related factors. A regression of mutation rate on repeat copy number for all mutating loci in the nine PSPEs was used to confirm and generalize the results observed at locus O157-10 across multiple loci. The effect of mismatch repair was examined by comparing the number of observed mutations between EC536 and EC1212 using a chi-square test. Some lineages generated during the EC1212 PSPE possessed locus O157-56 alleles that differed by 1 bp from the T ⫽ 0 allele size. These alleles were sequenced along with controls to identify the source of the size variation.
RESULTS We report here the mutational activity of 28 VNTR loci across 10 in vitro PSPE populations. The structure of these populations involves a moderately large number of multiple lineages to increase the total number of generations and yet allows us to detect individual mutational events. Because each passage involves a severe genetic bottleneck, mutations most frequently go extinct but become fixed in a lineage proportionally to their rate of occurrence. This experimental design is similar to a “star phylogeny” structure observed in epidemic disease outbreaks or rapid clonal expansions of a recently emerged pathogen. Thus, our data are directly applicable to both of these situations. In this study, we examine the nine wild-type strains for their VNTR mutational products, calculate the resulting mutant allele frequencies, and estimate mutational rates in both a combined multiple-locus and single-locus fashion. An in vitro mutator (mutS) strain population and a natural isolate population assemblage were used to contrast the wild-type and mutant in vitro VNTR mutational processes. Combined 28-locus trends. Each T ⫽ 10 experiment represented ⬃25,000 generations while the single T ⫽ 40 experiment represented ⬃100,000 generations. Overall, we report here nearly 300,000 generations of growth across ⬃900 clonal lineages for the nine PSPE wild-type populations. Our evaluation of 28 VNTR loci represents a combined locus ⫻ gener-
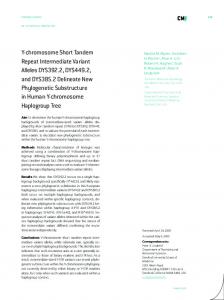
FIG. 1. Frequency distributions of mutation products. Shown are frequencies of insertion (A), deletion (B), and total (C) mutations involving ⬍21 repeat units plotted as a percentage of total mutations.
ation analysis of nearly 8.4 million loci ⫻ generations. Cumulatively, 186 mutational events were observed corresponding to a combined 28-locus mutation rate estimate of 6.4 ⫻ 10⫺4 mutations/generation (Table 2). Of the 186 mutations, 116 (62.4%) were insertions and 70 (37.6%) were deletions (2 ⫽ 11.376, P ⫽ 0.001; Table 2; Fig. 1). However, this overall insertion-to-deletion bias was due to a highly biased result at a single locus in a single PSPE (O157-10, ATCC 700927). In this locus ⫻ strain example, we observed a highly significant difference of 30 (93.8%) insertions versus two (6.3%) deletions (2 ⫽ 24.500, P ⬍ 0.001; Table 2). Indeed, when the ATCC 700927 locus O157-10 result was removed, there was no significant difference between insertions and deletions in the combined data (2 ⫽ 2.104, P ⫽ 0.147). VNTR mutational products. Mutational products reflected both single- and multiple-repeat events. Sequencing of selected mutational products and parental alleles confirmed that mutations were the result of a change in repeat copy number. One hundred thirty-nine (74.7%) of the 186 total mutations entailed single-repeat changes (either insertions or deletions),
4258
VOGLER ET AL.
J. BACTERIOL.
FIG. 2. Diversity as a function of mutation rate. Two diversity measures, diversity (A and B) and total number of alleles (C and D), are plotted against mutation rate. Diversity was calculated from a collection of 344 diverse E. coli O157/O55 isolates. Regression plots are presented both including (A and C) and excluding (B and D) data from locus O157-10 (indicated by an arrow in panels A and C). Correlations from data excluding locus O157-10 are presented for both diversity measure plots.
while the remaining 47 (25.3%) involved multiple-repeat changes ranging from 2 to 20 repeats (Table 2; Fig. 1). We categorized 12 of the 47 multiple-repeat mutations as “large repeat copy number” events involving greater than four repeat units. The actual definition of a large repeat copy number event is arbitrary but empirically based upon a natural break in the frequency data between mutations involving less than five and more than four repeats. This break is clearly defined in the insertion data but less obvious in the deletion or total data, where the breakpoint may be closer to five repeats (Fig. 1). Shifting the break to five repeats has essentially no effect on our conclusions (data not shown). Regardless, these large repeat copy number events are clearly more common than would be expected from the progressive decline in event frequency seen between single and triple events. The ratio of 1:2:3:4:5 repeat mutations was 139:21:8:6:4. The decline in event frequency seen between single and triple events appears to break down around four-repeat events. Mutational events involving four or five repeats occurred at nearly the same frequency, and mutational events involving greater than five repeats occurred sporadically, without any pattern of declining frequency (Fig. 1). Large repeat copy number mutations were much more likely to be deletions than insertions and to occur at locus O157-10 than at the other VNTR loci. The vast majority (11/12 or 92%) of the large repeat copy number mutations were deletions,
including three 5-repeat, one 6-repeat, one 10-repeat, two 12repeat, two 13-repeat, one 19-repeat, and one 20-repeat mutation. The single large repeat copy number insertion event involved the addition of seven repeats (Fig. 1). While nine of the large repeat copy number mutational events occurred at locus O157-10, the remaining three were consistent with the higher-than-expected frequency trend observed above, arguing for the generality of our observations regarding large repeat copy number mutations. These three mutations included a five-repeat deletion at locus O157-9 and 6- and 13-repeat deletions at locus O157-11. While both insertion and deletion events were observed, there was a clear bias for deletions versus insertions in these large repeat copy number events. Mechanistically, both insertions and deletions are feasible, but selection could easily affect their observed frequency. VNTR alleles of very large size could be detrimental or just highly unstable, leading to the observation of a greater number of deletion events. VNTR mutation rates. The VNTR mutation rate estimates were very high and varied across loci. Sixteen of the 28 VNTR loci mutated at least once in the nine combined PSPEs. Combined data for the nine populations provide the most accurate mutation rate estimates for individual loci. The combined population rates for the 16 mutating loci ranged from a low of 3.4 ⫻ 10⫺6 to as high as 4.0 ⫻ 10⫺4 mutations/generation
VOL. 188, 2006
EFFECT OF REPEAT COPY NUMBER ON VNTR MUTATIONS
(Table 2). The lowest rates were based upon single observations while the highest rates (O157-10) were based upon 124 events. No mutations were observed for 12 VNTR loci, suggesting that their individual mutation rates must be less than 3.4 ⫻ 10⫺6 mutations/generation, the detection limit given the 291,000 generations that we examined. Diversity at individual loci, estimated from a large collection of natural isolates, was correlated with our in vitro mutation rate estimates. Diversity (D) and allele number are two measures of natural diversity, and both were correlated with mutation rate. Diversity across the 28 loci ranged from 0.05 to 0.97 while allele number ranged from 2 to 47 for our set of 344 isolates. Diversity was fitted best using a second-degree polynomial relationship with mutation rate (r2 ⫽ 0.634, P ⬍ 0.0001; Fig. 2A and B) while total number of alleles fitted a linear relationship (r2 ⫽ 0.813, P ⬍ 0.0001; Fig. 2C and D). A nonlinear relationship between mutation rate and diversity is expected because D is a limited metric with a maximal value of 1.0. Although a second-degree polynomial relationship may not be the intrinsic relationship between diversity and mutation rate, it was the best fit to the data presented here. Because allele number has no theoretical maximum value, its linear relationship is also a reasonable expectation. Additional mutation rate data between the majority of our locus data and the outlier locus O157-10 may provide further insight into these relationships. The correlation between mutation rate and the two diversity measures was significant with and without the inclusion of data from locus O157-10. However, only the correlation results for the analysis without locus O157-10 are presented, due to the outlier status of locus O157-10 in the plots (Fig. 2A and C). Repeat copy number effect on mutation rate. The PSPE population strains were selected to represent the range of known locus O157-10 allele sizes (Fig. 3A). This was done to maximize our statistical power for detecting significant repeat copy number effects at this locus. Repeat copy number at locus O157-10 ranged from 5.67 to 66.67 repeats in our diversity collection, although the majority of isolates had repeat copy numbers between 9.67 and 41.67 repeats (Fig. 3A). Repeat copy number for locus O157-10 among the nine PSPE strains fell throughout the distribution of known alleles, ranging from 9.67 to 66.67 repeats. Three of the strains fell outside the more typical repeat copy range, with repeat copy numbers of 48.67, 59.67, and 66.67 repeats (Table 1; Fig. 3A). Mutation rate differences at locus O157-10 were correlated with differences in repeat copy number at this locus among the selected PSPE strains. Mutation rates at this locus ranged from 1.5 ⫻ 10⫺4 to 7.0 ⫻ 10⫺4 mutations/generation among the nine strains (Table 2) and were correlated with their corresponding locus O157-10 repeat copy numbers (r2 ⫽ 0.565, P ⫽ 0.0196; Fig. 3B). The variation among locus O157-10 mutation rates significantly affected combined 28-locus mutation rates among the nine strains (2 ⫽ 17.974, P ⫽ 0.021). Indeed, the 3.2 ⫻ 10⫺4 to 1.2 ⫻ 10⫺3 mutations/generation range of combined 28-locus mutation rates (Table 2) could be attributed solely to the differences in mutation rate at locus O157-10. One hundred twenty-four (66.7%) of the 186 observed mutations occurred at locus O157-10, and when those mutations were removed from the combined VNTR locus calculations, there were no statistically significant differences among combined
4259
FIG. 3. Locus O157-10 mutation rate as a function of repeat copy number. (A) Allele frequency distribution for 344 diverse E. coli O157/ O55 isolates is presented with the PSPE strain repeat copy numbers labeled 1 to 9 and colored black. Strains 1 to 9 are H6436, ATCC 700927, Spain 401, F6750, EC536 and EC1212, 01A6820, DEC4C, 01A7146, and Spain 41, respectively. (B) A correlation between repeat copy number and mutation rate for locus O157-10 is presented along with the regression line equation.
28-locus mutation rates for the nine strains (2 ⫽ 12.280, P ⫽ 0.139). Locus O157-10 allele sizes varied the most dramatically of any locus in this study and therefore had the most impact on combined 28-locus mutation rates. Because the allele size variation at the other loci was smaller, they had a lesser effect on the combined 28-locus mutation rates. Thus, it appears that there is no pure “strain” effect on combined-locus mutation rates, but clearly “allele size” at individual loci does affect mutation rate. We also detected a significant and strong correlation between mutation rate and repeat copy number across loci (r2 ⫽ 0.833, P ⬍ 0.0001; Fig. 4A). However, this result was largely due to the locus O157-10 data. Removing the locus O157-10 data lessened the statistical significance somewhat, but differences in repeat copy number still explained nearly half of the variation in mutation rate (r2 ⫽ 0.452, P ⬍ 0.0001; Fig. 4B). This was all the more dramatic because the nine wild-type strains were not preselected for allele sizes at the non-O157-10 loci and, hence, our statistic power for detecting allele size effect was greatly reduced for these other loci. Importantly, allele size appears to be a general across-locus effect and ca. 50% of mutation rate variance should be predictable from repeat copy number based upon this data set. The magnitude
4260
J. BACTERIOL.
VOGLER ET AL.
FIG. 5. Large repeat copy mutations occur in alleles with higher repeat copy numbers. The number of mutations involving ⬎4 repeats at locus O157-10 is presented for the nine PSPE strains according to their repeat copy numbers.
FIG. 4. Mutation rate across loci as a function of repeat copy number. Correlations between repeat copy number and mutation rate are presented for all mutating loci in the PSPEs, both including (A) and excluding (B) data from locus O157-10. Equations for the two regression lines are also presented.
of the repeat copy number effect should be roughly equivalent to the slope of the regression line. Therefore, each additional repeat copy at a locus increases the rate ⬃8.1 ⫻ 10⫺6 to 1.1 ⫻ 10⫺5 mutations/generation (Fig. 4A and B). Similarly at the O157-10 locus, each additional repeat copy increases the mutation rate by ⬃7.1 ⫻ 10⫺6 mutations/generation (Fig. 3B). These data provide a quantitative method for predicting mutation rate differences among alleles, solely based upon repeat copy number differences. A threshold effect of repeat copy number on large repeat copy number mutational events. We observed nine large repeat copy number mutational events (⬎4-repeat change) at locus O157-10, which seem to follow a different pattern than smaller repeat number mutations with regard to repeat copy number. Large repeat copy number events occurred only when a particular locus O157-10 allele had a repeat copy number of ⱖ29 repeats (Fig. 5). Unlike smaller repeat mutations, the frequency of large repeat copy number events was not affected by additional repeat copies, once the 29-repeat threshold was reached (Fig. 5; 2 ⫽ 1.556, P ⫽ 0.817). The number of repeats involved in the large repeat copy number events was also not affected by additional increases in repeat copy number. For
instance, at 29.67 repeats, there was one 5-, one 13-, and one 19-repeat deletion. At 41.67 copies, there was a single 12repeat deletion. At 48.67 copies, there was one 5- and one 12-repeat deletion. At 59.67 copies, there was one 20-repeat deletion, and at 66.67 copies, there was one 7-repeat insertion and one 10-repeat deletion. Large repeat copy number mutations do not follow the same frequency progression observed for small repeat mutations, and they are highly biased towards deletion events. There was no effect of deficient mismatch repair on mutation rate. Across the 28 VNTR loci, there was no significant difference in total mutations between strains EC536 (18 mutations) and its isogenic (mutS) derivative, EC1212 (17 mutations) (2 ⫽ 0.029, P ⫽ 0.866). However, the 28 VNTR loci examined here all have repeat unit sizes ranging from 5 to 62 bp, and MutS has only been shown to recognize stem-loop structures of ⱕ4 bp (21). Interestingly, three T ⫽ 10 lineages from the EC1212 PSPE population possessed locus O157-56 allele sizes that differed by 1 bp from the T ⫽ 0 allele size. Allele sequencing revealed that these 1-bp discrepancies were due to a 1-bp deletion in one lineage and to 1-bp insertions in two lineages. These mutations occurred in a poly(G) tract downstream from locus O157-56 but within the amplicon for that locus. No such 1-bp shifts were observed in any of the wild-type EC536 lineages. This is a small number of mutations but consistent with other reports of MutS action on VNTRs of repeat sizes less than 4 bp (16, 25). MutS is capable of recognizing and repairing mutations in single nucleotide repeats but not larger (e.g., 5-bp) repeat arrays. DISCUSSION In clonal organisms, mutation is a major engine for generating diversity and hypermutable loci represent the fastest evolutionary mechanism for obtaining genetic differences. Genetic diversity can represent adaptively important differences, the variation may be adaptive in particular environments, or the variation can be truly neutral. The underlying mechanisms should be the same regardless of the selective consequences of the products, but characterizing the mechanisms is less biased
VOL. 188, 2006
EFFECT OF REPEAT COPY NUMBER ON VNTR MUTATIONS
if neutral loci can be used. VNTR loci from an MLVA subtyping system (14) have been examined from large PSPE populations to accurately estimate their mutation rates and their distribution of products. We believe that this study establishes a general VNTR mutational model for E. coli O157:H7 and one that may be generally applicable to all bacteria. Beyond a doubt, the mutational processes that lead to great VNTR diversity are complex. We have observed many different mutation products, including insertions and deletions of both single and multiple repeats, and mutation rates that vary both among loci and even among alleles at a single locus. We believe that VNTR mutations may occur by both SSM and recombination mechanisms. While all the factors governing these processes are unclear, repeat copy number certainly plays an important role in determining mutation rates both among different loci and among different alleles. We propose here a practical, dynamic model for smaller VNTR mutations (e.g., disregarding the 12 large repeat copy number mutations that we observed here). (i) Approximately 80% of the mutational events will consist of a single-repeat change, and these will have an equal chance of being an insertion or deletion. (ii) The remaining 20% of the time, a mutation will involve multiple repeats but will have an equal chance of being an insertion or deletion. (iii) If a mutation involves ⬎4 to 5 repeat units, a deletion event will be much more likely than an insertion—though this may be due to selection rather than an intrinsic mechanistic attribute. (iv) The number of repeats involved in a multiple-repeat mutation will roughly follow a geometric distribution, where a two-repeat change is more likely than a three-repeat change, which is more likely than a four-repeat change, etc. Our proposed model is remarkably similar to a statistical model proposed to model VNTR mutations in humans (4). In this two-phase model, X is equal to one repeat with a probability of P. Multiple-repeat mutations would comprise the remaining mutational events with a frequency of 1 ⫺ P. The number of repeats (X) involved in the multiple-repeat mutational events would follow a geometric distribution (gj) with a specified variance, g2 (4). This allows for a certain percentage of mutations to consist of multiple repeat units and, using the values above (e.g., P ⫽ 0.80), could provide an excellent model for examining allele frequency distributions for various VNTR loci in natural populations of E. coli O157:H7. If one uses 0.80 for P, then 20% of the mutational events would be multiplerepeat events. A geometric progression following P(X ⫽ n) ⫽ (1 ⫺ P)n ⫺ 1 would then suggest that 80% of the remaining 20% (⬃16%) of these would be two-repeat mutants. The predicted three-repeat and four-repeat mutant frequencies would then be 3.2% and 0.6%, respectively. Again, disregarding large repeat copy number events, we observed 80% one-repeat, 12% two-repeat, 5% three-repeat, and 3% four-repeat mutants. These observed data approximate the theoretical geometric progression. In conclusion, this model represents a great improvement over other VNTR mutational models that assume that only single-repeat mutations will occur (8). The above pattern of single- and multiple-repeat mutations was observed for 93.5% of the mutations in this study and is consistent with SSM, the mechanism thought to be primarily responsible for VNTR mutations. An SSM model dictates that the majority of mutation events should represent the smallest
4261
possible mismatches (16). Thus, as seen here, single-repeat mutations should be more common than two-repeat mutations, which should be more common than three-repeat mutations, etc. The 12 (6.5%) mutations in this study that deviated from this pattern involved large repeat copy number mutational events that were likely due to a secondary mutational mechanism involving recombination. Recombination has mostly been discounted as a potential VNTR mutational mechanism since mutations in recombination genes such as recA (16) and rad52 (11) have had no measurable effect upon VNTR mutation rates. Recombination seems much more likely than SSM to have produced the large repeat copy number mutations observed here. If SSM is the predominant mutational mechanism and recombination plays only a secondary role, then it is possible that any difference in mutation frequency due to a lack of recombination in previous studies was masked by the much greater frequency of SSM mutations. Very large sample sets would be needed to detect any differences in the frequency of such rare events, especially in a background of more frequent SSM mutations. Alternatively, the repeat arrays being examined could have been too short for any appreciable unequal crossing-over to occur. In E. coli, recA-mediated recombination requires a minimum of ⬃20 bp of homologous sequence and its frequency increases exponentially between 20 and 74 bp; thereafter, recA-mediated recombination increases linearly (28). In this study, large repeat copy number mutations were observed only at locus O157-10 when there were ⱖ29 repeats in the array (ⱖ174 bp of repeat sequence). However, during an unequal crossover event the regions are offset and, thus, less than 174 bp of homologous sequence would be available for recombination. The maximum pairing of sequence during a chromosomal misalignment would consist of half of the repeats, with a corresponding homologous sequence length of 87 bp at the 29-repeat threshold. Interestingly, this is near the 74 bp that is required for near-maximum recombination frequency in E. coli. Whether SSM or recombination is the mechanism, the low frequency of large repeat copy number events combined with their tendency to occur only at large allele sizes indicates that the higher-thanexpected frequency of such events could likely be ignored for smaller and more common VNTR arrays. The SSM model with its geometric distribution of multiple-repeat mutation frequencies appears to be adequate in most cases. Is the expansion of tandem arrays bounded, or can they expand to infinite size? If expansion is intrinsically unbounded, what prevents the generation of very large arrays (7, 24)? Theoretically, insertions and deletions are equally likely using either an SSM or a recombination mutation model. Previous studies have indicated insertion (23, 26, 31) and deletion (16, 26) biases, or even no bias (9), depending upon the locus examined. Here, across a panel of loci, we determined that there was no statistically significant difference between insertion and deletion frequencies. However, we also determined that in the case of large repeat copy number mutations, deletions are far more likely than insertions, a phenomenon that has been tentatively observed elsewhere (6). This could be due to selection against large allele states and thus could reflect a stabilizing mechanism that prevents uncontrolled array expansion. Large repeat copy number deletion events could even compensate for an insertion bias since a single large deletion
4262
VOGLER ET AL.
could effectively remove multiple insertion events. Although this process likely applies across loci, large alleles may be more detrimental at some loci than others, such as those in important coding regions, which could explain why some loci are able to maintain very large arrays while other loci remain relatively small. For recently emerged pathogens and especially in the analysis of disease outbreak isolates, MLVA represents an important and sometimes the only tool for discriminating among isolates. While the rapid evolution of VNTR loci provides great discriminatory power among closely related isolates, it also inhibits the analytical power for detecting more distant relationships. In a set of uncharacterized isolates the true relationships will be unknown and of differing distances. This can be mitigated somewhat by using more VNTR loci (e.g., ⬎20) with a range of mutation rates. This will increase the analytical capacity of a subtyping system to estimate a range of heterogeneous genetic relationships (14). It is important to recognize that the lack of congruence among phylogenetic reconstructions may be as much due to a lack of characters as to the molecular method. Researchers should not expect accurate phylogenetic reconstructions if only a small set of rapidly mutating markers is employed. Regardless, it is important that any phylogenetic reconstructions be viewed as hypotheses and, if possible, compared to alternatives using probability models. Bayesian approaches are only possible once the mutation rates and associated mutational product probabilities are known. The insights into VNTR mutation processes gained from our mutation rate studies provide the foundational knowledge needed to construct probabilistic models for natural pathogen populations. Specifically, VNTR mutation rate estimates can be used for improving the quality of molecular subtyping in two unique ways. First, using mutation rate estimates and a Poisson distribution, confidence intervals can be established around the number of generations required for one or more mutations (19). This can be used to place a statistical value on the likelihood of two isolates being related to each other that goes far beyond simple fragment matching approaches. Second, VNTR mutation rate estimates provide a framework for deciding how to mathematically weight VNTR differences when constructing phylogenies. Weighting data from fast-mutating loci less than data derived from slowly mutating loci should provide more accurate phylogenies. Exactly how to weight loci is problematic, but one suggestion is to use the inverse of the mutation rate. Unfortunately, mutation rate estimates are not easily obtainable for all organisms at all loci and can vary depending upon the allele size. The correlation between diversity and mutation rate suggests that the inverse of the diversity could also be used as a weighting factor, which would at least provide a weighting value for every locus and for organisms where mutation rate studies are not available. A third possibility would be to apply a PHRANA approach wherein isolates are analyzed using slower-mutating loci first, followed by fastermutating loci to “cluster bust” any undifferentiated clades (13). Ideally, the first markers applied in any PHRANA approach would be highly evolutionarily stable markers such as single nucleotide polymorphisms, although the approach would also benefit analyses of VNTR markers alone if rapid markers are segregated from slower ones in the analysis. This approach requires categorizing VNTR loci into different levels (i.e., slow,
J. BACTERIOL.
medium, fast, etc.), but does not require mutation rate data for all loci. Standardization would also be easier using this approach, although the exact cutoffs for categorizing VNTR loci would have to be determined and would, of necessity, be somewhat subjective. While the manuscript was in review, Noller and colleagues (22) published a mutation study on seven VNTR loci in E. coli O157:H7, a subset of the 28 loci studied here. Due to the smaller population sizes employed, only the most rapidly mutating loci were observed to generate mutational products in their study. These included three loci: O157-10 (TR2), O157-9 (TR1), and O157-3 (TR5). Four additional loci were studied, O157-17 (TR3), O157-19 (TR7), O157-25 (TR4), and O157-34 (TR6), but did not mutate under their experimental design (22), again, probably due to the use of smaller population sizes. The frequency of single-repeat versus multiple-repeat mutation products was consistent with our results. Single-repeat mutational products were observed ⬃85% of the time by Noller et al. (2006), which was consistent with our finding that ⬃75% of VNTR mutational products are single-repeat differences. Noller et al. (2006) also observed an insertion bias, but in our study, this was limited to a single locus ⫻ strain example and does not appear to be a general phenomenon. Nonindependent sampling could lead to an observed bias that is not intrinsic. Importantly, the rate estimates reported by Noller et al. (2006) are significantly different from and ⬃10-fold higher than those in our study. We believe that these significantly higher rates are overestimates due to the nonindependent design of their mutant sampling. In other words, many of their observed mutants were likely the result of a single rather than multiple mutation events. The sampling of multiple progeny from a single event would lead to elevated rate estimates. Noller et al. (2006) categorize their sampling design as nonindependent, which really represents a mutant observation rate rather than a mutational process rate. Observation of nonindependent mutants is highly dependent upon the experimental design and sample scheme and only somewhat dependent upon the underlying mechanistic rates. They can be used to establish relative rates among loci but should be used with great caution otherwise. ACKNOWLEDGMENTS We thank Thomas Cebula from the Center for Food Safety and Applied Nutrition for providing the EC536 and EC1212 strains. This work was supported by the Bioforensics Demonstration and Application Program and the Cowden Endowment in Microbiology. REFERENCES 1. Achtman, M., G. Morelli, P. Zhu, T. Wirth, I. Diehl, B. Kusecek, A. J. Vogler, D. M. Wagner, C. J. Allender, W. R. Easterday, V. Chenal-Francisque, P. Worsham, N. R. Thomson, J. Parkhill, L. E. Lindler, E. Carniel, and P. Keim. 2004. Microevolution and history of the plague bacillus, Yersinia pestis. Proc. Natl. Acad. Sci. USA 101:17837–17842. 2. Brinkmann, B., M. Klintschar, F. Neuhuber, J. Hu ¨hne, and B. Rolf. 1998. Mutation rate in human microsatellites: influence of the structure and length of the tandem repeat. Am. J. Hum. Genet. 62:1408–1415. 3. Datsenko, K. A., and B. L. Wanner. 2000. One-step inactivation of chromosomal genes in Escherichia coli K-12 using PCR products. Proc. Natl. Acad. Sci. USA 97:6640–6645. 4. Di Rienzo, A., A. C. Peterson, J. C. Garza, A. M. Valdes, M. Slatkin, and N. B. Freimer. 1994. Mutational processes of simple-sequence repeat loci in human populations. Proc. Natl. Acad. Sci. USA 91:3166–3170. 5. Eisen, J. 1999. Mechanistic basis for microsatellite instability, p. 34–48. In D. B. Goldstein and C. Schlo ¨tterer (ed.), Microsatellites: evolution and applications. Oxford University Press, New York, N.Y.
VOL. 188, 2006
EFFECT OF REPEAT COPY NUMBER ON VNTR MUTATIONS
6. Ellegren, H. 2000. Heterogeneous mutation processes in human microsatellite DNA sequences. Nat. Genet. 24:400–402. 7. Ellegren, H. 2000. Microsatellite mutations in the germline: implications for evolutionary inference. Trends Genet. 16:551–558. 8. Estoup, A., and J. Cornuet. 1999. Microsatellite evolution: inferences from population data, p. 49–65. In D. B. Goldstein and C. Schlo ¨tterer (ed.), Microsatellites: evolution and applications. Oxford University Press, New York, N.Y. 9. Gardner, M. G., C. M. Bull, S. J. B. Cooper, and G. A. Duffield. 2000. Microsatellite mutations in litters of the Australian lizard Egernia stokesii. J. Evol. Biol. 13:551–560. 10. Girard, J. M., D. M. Wagner, A. J. Vogler, C. Keys, J. Allender, L. C. Drickamer, and P. Keim. 2004. Differential plague transmission dynamics determine Yersinia pestis population genetic structure at local, regional, and global scales. Proc. Natl. Acad. Sci. USA 101:8408–8413. 11. Henderson, S. T., and T. D. Petes. 1992. Instability of simple sequence DNA in Saccharomyces cerevisiae. Mol. Cell. Biol. 12:2749–2757. 12. Keim, P., L. B. Price, A. M. Klevytska, K. L. Smith, J. M. Schupp, R. Okinaka, P. J. Jackson, and M. E. Hugh-Jones. 2000. Multiple-locus variable-number tandem repeat analysis reveals genetic relationships within Bacillus anthracis. J. Bacteriol. 182:2928–2936. 13. Keim, P., M. N. Van Ert, T. Pearson, A. J. Vogler, L. Y. Huynh, and D. M. Wagner. 2004. Anthrax molecular epidemiology and forensics: using the appropriate marker for different evolutionary scales. Infect. Genet. Evol. 4:205–213. 14. Keys, C., S. Kemper, and P. Keim. 2005. Highly diverse variable number tandem repeat loci in the E. coli O157:H7 and O55:H7 genomes for highresolution molecular typing. J. Appl. Microbiol. 98:928–940. 15. Klevytska, A. M., L. B. Price, J. M. Schupp, P. L. Worsham, J. Wong, and P. Keim. 2001. Identification and characterization of variable-number tandem repeats in the Yersinia pestis genome. J. Clin. Microbiol. 39:3179–3185. 16. Levinson, G., and G. A. Gutman. 1987. High frequencies of short frameshifts in poly-CA/TG tandem repeats borne by bacteriophage M13 in Escherichia coli K-12. Nucleic Acids Res. 15:5323–5338. 17. Levinson, G., and G. A. Gutman. 1987. Slipped-strand mispairing: a major mechanism for DNA sequence evolution. Mol. Biol. Evol. 4:203–221.
4263
18. Lindstedt, B. 2005. Multiple-locus variable number tandem repeats analysis for genetic fingerprinting of pathogenic bacteria. Electrophoresis 26:2567– 2582. 19. Lowell, J. L., D. M. Wagner, B. Atshabar, M. F. Antolin, A. J. Vogler, P. Keim, M. C. Chu, and K. L. Gage. 2005. Identifying sources of human exposure to plague. J. Clin. Microbiol. 43:650–656. 20. Luria, S. E., and M. Delbru ¨ck. 1943. Mutations of bacteria from virus sensitivity to virus resistance. Genetics 28:491–511. 21. Marti, T. M., C. Kunz, and O. Fleck. 2002. DNA mismatch repair and mutation avoidance pathways. J. Cell. Physiol. 191:28–41. 22. Noller, A. C., M. C. McEllistrem, K. A. Shutt, and L. H. Harrison. 2006. Locus-specific mutational events in a multilocus variable-number tandem repeat analysis of Escherichia coli O157:H7. J. Clin. Microbiol. 44:374–377. 23. Primmer, C. R., N. Saino, A. P. Møller, and H. Ellegren. 1998. Unraveling the processes of microsatellite evolution through analysis of germ line mutations in barn swallows Hirundo rustica. Mol. Biol. Evol. 15:1047–1054. 24. Schlo ¨tterer, C. 2000. Evolutionary dynamics of microsatellite DNA. Chromosoma 109:365–371. 25. Strand, M., T. A. Prolla, R. M. Liskay, and T. D. Petes. 1993. Destabilization of tracts of simple repetitive DNA in yeast by mutations affecting DNA mismatch repair. Nature 365:274–276. 26. Udupa, S. M., and M. Baum. 2001. High mutation rate and mutational bias at (TAA)n microsatellite loci in chickpea (Cicer arietinum L.). Mol. Genet. Genomics 265:1097–1103. 27. van Belkum, A., S. Scherer, L. van Alphen, and H. Verbrugh. 1998. Shortsequence DNA repeats in prokaryotic genomes. Microbiol. Mol. Biol. Rev. 62:275–293. 28. Watt, V. M., C. J. Ingles, M. S. Urdea, and W. J. Rutter. 1985. Homology requirements for recombination in Escherichia coli. Proc. Natl. Acad. Sci. USA 82:4768–4772. 29. Weber, J. L. 1990. Informativeness of human (dC-dA)n · (dG-dT)n polymorphisms. Genomics 7:524–530. 30. Wierdl, M., M. Dominska, and T. D. Petes. 1997. Microsatellite instability in yeast: dependence on the length of the microsatellite. Genetics 146:769–779. 31. Yang, Y., and W. Masker. 1996. Instability of repeated dinucleotides in bacteriophage T7 genomes. Mutat. Res. 354:113–122.