Available online at www.sciencedirect.com
ScienceDirect Agriculture and Agricultural Science Procedia 00 (2014) 000–000 www.elsevier.com/locate/procedia
“ST26943”, 2nd International Conference on Agricultural and Food Engineering, CAFEi2014”
Effect of solvent concentration, sample particle size and solid to liquid ratio on radio frequency assisted extraction (RFAE) of apple peel phenolic compounds and process optimization Mohd Jusoh, Y.M. a,b,*, Orsat, V.a and Abang Zaidel, D.N.b a
Department of Bioresource Engineering, Macdonald Steward Building, Faculty of Agricultural and Environmental Sciences, McGill University, 21111, Lakeshore Road, Ste Anne de Bellevue, H9X3V9, Quebec, Canada. b
Department of Bioprocess Engineering, Faculty of Chemical Engineering, Universiti Teknologi Malaysia, UTM 81310, Johor Bahru, Johor, Malaysia.
Abstract A new method for recovering bioactive compounds using radio frequency heating technology was highlighted in this work. The effects of solvent concentration (0.500 to 2.000 mM aqueous hydrochloric acid), sample particle size (0.250 to 0.750 m) and solid to liquid ratio (0.002 to 0.02 g/ml) on the quality of crude apple peel extract recovered using radio frequency assisted extraction (RFAE) were investigated. The quality of the crude extract were assessed using the amount of total phenolic compounds (TPC), total flavonoids contents (TFC) and antioxidant ability (DPPH). Response surface methodology was employed for experimental design and analysis. Three significant and reliable models for predicting TPC, TPC and DPPH were obtained. The multi-response optimization step suggests that the highest quality of crude apple peel extract with overall desirability of 91.00 % which corresponds to TPC of 2.37 mg GAE/ g DM, TFC of 1.23 mg CAT/ g DM and 79.84 % DPPH inhibition could be obtained if the extraction is performed using 1.25 mM hydrochloric acid, apple peel particle with the size of 0.6 m and solid to liquid ratio of 0.002 g/ml.
* Corresponding author. Tel.: +0-000-000-0000 ; fax: +0-000-000-0000 . E-mail address:
[email protected] 2210-7843 © 2014 The Authors. Published by Elsevier B.V. Peer-review under responsibility of the Scientific Committee of CAFEi2014.
2
Author name / Agriculture and Agricultural Science Procedia 00 (2014) 000–000
© 2014 The Authors. Published by Elsevier B.V. Peer-review under responsibility of the Scientific Committee of CAFEi2014. Keywords: radio frequency assisted extraction; phenolic compounds; apple peel; solvent concentration; particle size; solid to liquid ratio; optimization
1.0
Introduction Phenolic compounds are plant secondary metabolites. They are anti-nutrients and non-nutritional towards
plants however these compounds contribute to the pigmentation, involved in growth and reproduction, and protect plant from ultraviolet radiation, pathogens, predators and other plagues, etc (Bravo, 1998). Recent studies highlights that the benefits of phenolic compounds are not exclusively for plants, but also for humans. Numerous epidemiological studies showed the correlation between high consumption of fruits and vegetables to lower risks of chronic diseases in human populations (Boyer & Liu, 2004; Hyson, 2011). Albeit the vitamins and fibers which commonly known for health benefits, phenolic compounds in fruits and vegetables, are currently in focus of investigation for their positive health impact on human. A study on quantifying phenolic compounds in fruits by Balasundram, Sundram & Samman (2006), apple is ranked as the fifth highest fruit for its content of total phenolic compounds, succeeding cranberry, blackberry, raisins and blueberry. Apples are rich in various types of phytochemicals, however most of the antioxidant activity in the apple fruit is contributed by phenolic compounds Vieira et al.(2011). This has been scientifically proven by two studies on antioxidant ability of these compounds by Eberhardt, Lee & Liu, (2000) and Heo et al. (2004). Eberhardt et al. (2000) concluded that high antioxidant activity of 83.3 8.9 % in total oxyradical-scavenging capacity (TOSC) assay in the fresh apple extract tested was due to the phenolic compounds content instead of the vitamin C presents in the extract. Heo et al. (2004) concluded that 90% of the antioxidant activity of apple extract in their investigation was contributed by the phenolic compounds in the apple. Phenolic compounds exist in every part of plant, but with different types of groups and quantities. Apple peel contains higher phenolic compounds than the apple flesh (Łata, Trampczynska & Paczesna, 2009) and (Vieira et al., 2011). Nevertheless, this valuable apple peel or pomace (by-product of apple processing) is normally discarded as non-valuable waste. This phenolic compound-rich waste is a potential source for generation of functional ingredients suitable for food, beverage, feedstock, pharmaceutical, cosmetics, textile and other industries. There have been several studies published demonstrating the feasibility apple peel phenolic compounds application as natural antioxidant in food and beverage. The recovery of these apple peel bioactive compounds is possible via extraction. In this study, we highlighted a new extraction method using dielectric heating, radio frequency assisted extraction (RFAE). Dielectric heating (microwave or radio frequency) is a fast growing technology, simply indebted to their high efficiency. The usage of dielectric heating radio frequency technology for extracting podophyllotoxin, a phytochemical for treating cancer, has been reported for the first time in Izadifar, Baik & Mittal (2009). Similar to
Author name / Agriculture and Agricultural Science Procedia 00 (2014) 000–000
3
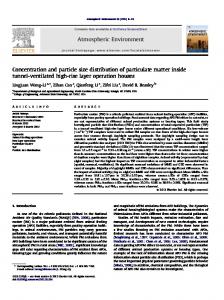
its sister technology, microwave assisted extraction (MAE), radio frequency assisted extraction functions basically on volumetric heating where heat is generated within the material as result from dipolar polarization and ionic charges interaction with electric field (Figure 1). Undeniably, high yield, short processing duration, low solvent usage and simple operation promotes the microwave assisted extraction application, however its lack of heating uniformity due small penetration depth and size limitation may potentially induce health hazard in food industry, if not properly addressed. As an alternative, RFAE is proposed as this technology can provide more uniform heating, scale-up feasible, non-destructive towards target compounds and also fast and high recovery, as compared to current extraction systems available. Our preliminary study using RFAE showed that RFAE method recovered higher phenolic compounds from flaxseed waste than MAE and conventional method. This high recovery may be due to plant cell matrix destruction from internal superheating and mass transfer process acceleration due to rapid heating. The objectives of this study was (1) to evaluate the effects of mild aqueous hydrocholoric acid concentration (0.500, 1.250 and 2.000 mM), particle size (0.250, 0.500 and 0.750 m) and solid to liquid ratio (0.002, 0.011 and 0.02 g/ml) on the quality of the crude apple peel extract and (2) to determine the optimum extraction conditions for obtaining the apple peel extract of highest antioxidant quality. Solvent, particle size and solid to liquid ratio are important factors that determine the performance of an extraction process as they can affect the affinity between the target compound and solvent, diffusivity coefficient of target compounds, concentration gradient and surface contact.
Figure 1: Ionic charges and dipolar polarization occurring in the alternating electric field of two RF parallel plates
4
Author name / Agriculture and Agricultural Science Procedia 00 (2014) 000–000
2.0
Materials and Methods
2.1
Apple peel sample preparation McIntosh apples from Quebec which were harvested in October 2011 were used for this experiment. The
apples were washed and surface dried before the skin was removed. The peeling of apple skin was performed using an Apple Pro-Peeler (Starfrit Atlantic Promotions Inc., Canada). The fresh peel was subjected to drying using a microwave-hot air dryer (Post-Harvest Laboratory, McGill University) for 40 minutes at a microwave power of 150 W with maximum temperature of 50C. The final moisture content of the peel was 17 %. Subsequently, the dried peel was ground using a domestic blender Magic Bullet (Homeland Housewares LLC, USA) and sieved and collected separately based on three particle sizes 0.250, 0.500 and 0.750 m.
2.2
Chemicals Hydrochloric acid (HCl), Folin-Ciocalteu reagent, sodium carbonate (Na2CO3), sodium nitrite (NaNO2),
aluminium chloride (AlCl3), sodium hydroxide (NaOH), methanol, 2,2-diphenyl-1-picrylhydrazyl (DPPH), gallic acid and catechin were obtained from Sigma-Aldrich (St. Louis, MO, USA). Ethanol was obtained from Greenfield Ethanol Inc. (Canada).
2.3
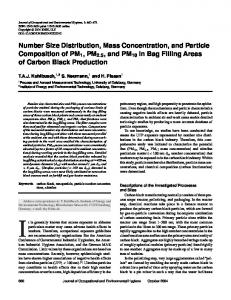
Radio frequency assisted extraction of apple peel Our RFAE system consists of three major operations that are the RF generator, RF applicator and the data
acquisition system. Figure 2 schematically presents the RFAE lab-scale set up (Bioresource Engineering, McGill University, Canada) that was developed and used for the extraction of phenolic compounds from apple peel in this study.
Author name / Agriculture and Agricultural Science Procedia 00 (2014) 000–000
5
Fiber optic thermometer Fiber optic sensor
Data
RF applicator
Fiber optic holder
Data logger RF generator
Flow meter
Matching box
Matching box cooling system Figure 2: Radio frequency assisted extraction (RFAE) lab-scale setup
In order to perform the extraction, 50 ml of extraction solvent (aqueous hydrochloric acid of 0.500, 1.250 or 2.000 mM) was added into the RF extraction tube. This borosilicate glass extraction tube is of cylindrical shape with a length of 0.230 m and a diameter of 0.04 m. This tube has an opening at one of its end to allow sample insertion, while the other is rounded. Then specific amounts of ground apple peel samples (0.1, 0.5 or 1.0 g) or were added to the solvent and the sample-solvent mixture was stirred for 15 seconds using a stirring rod to enhance mixture uniformity. After that, the extraction tube was placed between the RF electrodes in the applicator. The metal cover of the applicator was properly locked to prevent energy leakage. The RF generator was then switched on and tuned accordingly to ensure maximum energy coupling and prevent power reflectance. High power reflectance
6
Author name / Agriculture and Agricultural Science Procedia 00 (2014) 000–000
could damage the generator. All these extractions were performed at 50C for 10 minutes.
2.4
Total phenolic compounds determination The total phenolic contents in the apple peel extract were determined using the method described in
Waterhouse (2005) with minor modifications. 0.1 ml of extract was mixed with 7.9 ml of distilled water in a 15 ml centrifuge tube. Then, 0.5 ml Folin-Ciocalteu reagent was added into the mixture. The tube containing the mixture was agitated for 1 minute using a shaker and left aside for 7 minutes. After that, 1.5 ml of NaCO 3 was added and mixed again. The mixture was incubated for 2 hours at room temperature. All tubes were properly covered with aluminum foil to prevent them from light exposure. A Biochrom US 1000 UV/VIS spectrophotometer (Biochrom, Massachusetts) was used to measure the absorbance of the sample with the wavelength set at 765 nm. The quantification of total phenolic compounds in the samples was performed using gallic acid standard. Three gallic acid curves in 0.500, 1.250 and 2.000 mM hydrochloric acid with were prepared, however all the three curves shared the same equation (y = 0.0008x) and the same R2 value (0.98). The amount of phenolic content obtained was expressed as milligram gallic acid equivalent per gram of dry mass (mg GAE/g DM).
2.5
Total flavonoid content determination The amount of flavonoids contained in the sample was measured based on the method described in
Alothman, Bhat & Karim (2009). 1 ml of extract was mixed with 4 ml of distilled water. At time 0, 0.3 ml of NaNO 2 (5% w/v) was added into the mixture. At the 5 th minute, 0.3 ml of AlCl3 (10% w/v) was added, followed by 2 ml of 1 M of NaOH at the 6th minute. Then 2.4 ml of distilled water was added into the mixture and the mixture was shaken vigorously to ensure uniformity. The absorbance of the mixture was read at 510 nm using a Biochrom US 1000 UV/VIS spectrophotometer. Three calibration curves of catechin in 0.500, 1.250 and 2.000 mM hydrochloric acid with similar (R2 = 0.99) were prepared to quantify the total flavonoid contents in the sample. The amount of flavonoid was expressed as milligram catechin equivalent per gram of dry mass (mg CAT/g DM).
2.6
Antioxidant ability determination using DPPH inhibition percentage method The second method to evaluate the antioxidant activity of our apple peel extract was through DPPH (2,2-
diphenyl-1-picrylhydrazyl) inhibition method. Experimental procedures were performed by modifying the methods described in Hatano et al. (1988) and Sharma & Bhat (2009). DPPH solution of 100 M was prepared in extraction
Author name / Agriculture and Agricultural Science Procedia 00 (2014) 000–000
7
solvent of 1 mM HCl with 10, 40 and 70 % ethanol concentrations. 3 ml of extract was mixed with 1 ml DPPH solution in 15 ml tube covered with aluminum foil. This mixture was shaken vigorously and left aside for 30 minutes at room temperature. The absorbance of the sample at 517 nm was measured via spectrophotometry. The following equation (Equation 1) was used to calculate the percentage inhibition of DPPH by the apple peel phenolic compounds:
(
)
(1)
Abs control is the absorbance of 100 M DPPH solution without extracts.
3.0
Experimental Design and Statistical Analysis In this project, a central composite design of uniform precision with 20 runs was employed. Table 1 below
shows the three assessed factors with their experimental study range: Table 1: Central composite design (CCD) experimental design in coded and uncoded form Factor
Unit
Low Level
(-1)
Medium Level (0)
High Level
Concentration (X1)
M
0.0005
0.00125
0.002
Size (X2)
m
0.5
0.625
0.75
Solid to liquid ratio (X3)
g/ml
0.002
0.011
0.02
4.0
(+1)
Results and Discussions
4.1 Effect of mild aqueous hydrochloric acid, solid to liquid ratio and particle size on total phenolic compounds (TPC) recovery in the crude apple peel extract
Table 2: Analaysis of variance for total phenolic content (TPC), total flavonoid content (TFC) and radical scavenging activity (DPPH); X1= concentration, X2 = particle size, X3 = solid to liquid ratio, Y1=TPC, Y2 = TFC and Y3 = DPPH. Effect TPC (Y1) TFC(Y2) DPPH (Y3) Coefficient P-value Coefficient P-value Coefficient P-value Intercept
2.190
< 0.0001
1.087
< 0.0001
75.671
< 0.0001
0.025 0.375
0.4207 < 0.0001
-0.031 0.214
0.1802 < 0.0001
1.048 0.334
0.0099 0.3353
Linear X1 X2
8
Author name / Agriculture and Agricultural Science Procedia 00 (2014) 000–000
X3
-0.081
0.0215
-0.052
0.0362
-3.718
< 0.0001
-0.026 -0.516 0.004
0.6524 < 0.0001 0.9502
-0.134 -0.290 0.042
0.0088 < 0.0001 0.3321
-2.482 -0.852 0.348
0.0028 0.2056 0.5922
-0.053 -0.045 -0.063
0.1459 0.2062 0.0899
-0.013 -0.015 -0.025
0.6146 0.5468 0.3231
0.400 -0.0375 -0.2675
0.3037 0.9210 0.4850
Quadratic X12 X22 X32 Interaction X1X2 X1X3 X2X3 Model Lack of Fit R2
< 0.0001
< 0.0001
< 0.0001
0.2033
0.1557
0.4974
0.97
0.96
0.95
The result from analysis of variance (Table 2) showed that the recovery process of phenolic compounds (TPC) from this extraction was significantly affected by the linear and quadratic terms of particle size (X 2) and linear term of solid to liquid ratio (X3). Solvent concentration has no significant impact on TPC. From the same analysis, a model to predict the amount of TPC from the extraction was obtained (Equation 2):
The reliability, fitness and adequacy of this model for predicting TPC are justified by its small P-value (< 0.0001), insignificant lack of fit (0.2033) and R2 value of 0.97. The synergistic effect of particle size and solid to liquid ratio on the TPC recovery is highlighted in the surface plot Figure 3. As we can see, the trend for TPC recovery is quadratic, it increases as the size of particle increases from 0.25 m up to an optimum point (0.59 m). Increasing the size of particle beyond the optimum point led to reduction of the TPC recovery. Both extreme sizes are not the practical size in this extraction. Particle size needs to be practically small to promote higher surface contact between sample and solvent. The bigger the particle size, the distance for target compound to travel out from the particle has become longer (Gertenbach, 2000 (Pinelo, Sineiro & Núñez, 2006)). Therefore, it is important to determine the practical particle sample size for this extraction. Besides this factor, smaller solid to liquid ratio also helps in increasing the TPC yield. Applying small solid to liquid ratio promotes higher phenolic compounds concentration gradient between sample and diluter solvent which could accelerates mass transfer (Pinelo et al., 2006). From single response optimization, the highest TPC recovery of 2.39 mg GAE/g DM (desirability =
Author name / Agriculture and Agricultural Science Procedia 00 (2014) 000–000
9
83.10%) can be obtained if the extraction is performed using aqueous hydrochloric acid 0.002 M, sample with particle size of 0.59 m and solid to liquid ratio of 0.002 g/ml.
Figure 3: Three dimensional surface plot for TPC recovery
4.2 Effect of mild aqueous hydrochloric acid, solid to liquid ratio and particle size on total flavonoids (TFC) recovery in the crude apple peel extract The statistical analysis for TFC (Table 2) showed that the recovery of flavonoids using RFAE method is significantly affected by the linear and quadratic terms of particle size (X 2) and solid to liquid ratio (X3). The result is similar to TPC. From the analysis, a model for predicting the amount of TFC from the extraction was obtained (Equation 3):
The reliability and adequacy of the model for predicting the recovery of flavonoids for this range was mathematically proven by the small p-value (P< 0.0001), insignificant lack of fit (P = 0.1557) and the R 2 of 0.96. The synergistic effect of these particle size and solid to liquid ratio on the TFC recovery is demonstrated in the three dimensional surface plot Figure 4. The highest recovery of TFC was obtained at an optimum point between 0.25 and 0.75 m, which indicates that both extremes size are not a practical size for this extraction. In addition to that, from the quadratic curve of solid to liquid ratio showed, highest recovery was obtained when solid to liquid was
10
Author name / Agriculture and Agricultural Science Procedia 00 (2014) 000–000
maintained at the lowest ratio of 0.002 g/ml. The way of sample size and solid to liquid ratio affect TFC recovery is similar to TPC, which has been explained in Section 4.1.
From single response optimization, the highest TFC recovery of 1.23 mg CAT/g DM (desirability = 90.82%) can be obtained if the extraction is performed using aqueous hydrochloric acid 0.0012 M, sample with particle size of 0.62 m and solid to liquid ratio of 0.002 g/ml.
Figure 4: Three dimensional surface plot for TFC recovery
4.3 Effect of mild aqueous hydrochloric acid, solid to liquid ratio and particle size on DPPH inhibition percentage the (DPPH) crude apple peel extract From the result in Table 1, it can be concluded that the free radical scavenging ability of this crude apple peel extract or the ability of extract to inhibit DDPH radicals is very much dependant on the concentration of the mild aqueous acid and solid to liquid ratio of sample used during extraction. On contrary, the particle size of sample, particularly for the range studied, has no significant impact on ability of extract inhibit DPPH radicals. From this study, a model (Equation 4) for predicting the apple peel extract ability to inhibit DPPH free radicals was obtained. The reliability and adequacy of this model was mathematically justified by the small p-value (P< 0.0001), insignificant lack of fit (P = 0.4974) and the R 2 of 0.95.
Author name / Agriculture and Agricultural Science Procedia 00 (2014) 000–000
11
The simultaneous effect of two important factors (concentration and solid to liquid ratio) on DPPH is presented in Figure 5. Solvent concentration has significant negative quadratic effect on DPPH. Figure 5 showed that the highest DPPH value can be obtained if the solvent concentration at the optimum point between 0.0005 and 0.002 M. The linear term solid to liquid ratio infers that the highest recovery of DPPH can be obtained if solid to liquid ratio of 0.002 g/ml.
Figure 5: Three dimensional surface plot for DPPH free radical scavenging ability of the apple peel extract
Solvent concentration is one of the factors that is known to affect the recovery phenolic compounds simply due to the change in affinity between target compounds and solvents through pH, polarity and solubility manipulation of the solvents. Apple peel contained many different types of phenolic compounds which are built up from different functional groups, which indirectly contribute to the difference degree of attractions towards solvents. Example of solvent concentration (pH) effect on the antioxidant capacity of blueberry, cereal and blackcurrant extracts can be read in Kalt, MacDonald & Donner (2000), Perez-Jimenez & Saura-Calixto, (2005) and Tabart et al. (2007). From single response optimization, the highest antioxidant ability to scavenge free radical of 79.89% (desirability = 83.10%) can be obtained if the extraction is performed using aqueous hydrochloric acid 0.0014 M, sample with particle size of 0.58 m and solid to liquid ratio of 0.002 g/ml.
12
4.4
Author name / Agriculture and Agricultural Science Procedia 00 (2014) 000–000
Multi-response optimization Results in Section 4.1 to 4.3 demonstrated optimization of single response of TPC, TFC and DPPH. In
order to determine the optimized process for a multi-response system (TPC, TFC and DPPH), the desirability option is important. Equation 1, 2 and 3 mentioned previously is suitable for a process with single. JMP statistical prediction profiler (Figure 6) suggest that the highest TPC, TFC and DPPH value could possibly be gained if the experiment is conducted using mild aqueous hydrochloric acid of 1.250 mM, with sample particle size of 0.6 m and solid to liquid ratio of 0.002 g/ml.
Figure 6: Prediction profiler for RFAE of apple peel phenolics with three investigated factors; concentration (0.5000-2.000 mM), sample particle
Author name / Agriculture and Agricultural Science Procedia 00 (2014) 000–000
13
size (0.25 to 0.75 m) and solid to liquid ratio (0.002 to 0.02 g/ml)
5.0
Conclusions The capability of dielectric heating radio frequency as new method for extracting bioactive compounds
from agri-product waste was demonstrated in this study. Mild acid concentration, sample particle size and solid to liquid ratio pose different impact on the TPC recovery, TFC recovery and free radical inhibition ability of the extract. TPC and TFC recovery were controlled by particle size and solid to liquid ratio of sample meanwhile free radical scavenging ability was influenced by acid concentration and solid to liquid ratio. Three reliable statistical models were obtained for predicting the values of TPC, TFC and DPPH. Through multi-response optimization, the highest TPC, TFC and DPPH values (2.37 mg GAE/ DM, 1.23 mg CAT/DM, 79.84% inhibition) with desirability of 91.00 % could be achieved by extracting the sample using mild hydrochloric acid with concentration of 1.250 mM, sample particle size of 0.6 m and solid to liquid ratio of 0.002 mg/ml.
6.0
Acknowledgements The authors would like to convey heartfelt appreciation to Professor Vijaya Raghavan for providing the
facilities for the experimental work. The authors would also like to express their gratitude to Universiti Teknologi Malaysia and Ministry of Higher Education Malaysia for financial support under Research University Grant Scheme (Q.J130000.2544.06H39) and Fundamental Research Grant Scheme (R.J130000.7844.4F447). The financial support for laboratory activities from the Natural Sciences and Engineering Research Council of Canada are gratefully acknowledged.
7.0
References
Alothman, M., Bhat, R., & Karim, A. A. (2009). Antioxidant capacity and phenolic content of selected tropical fruits from Malaysia, extracted with different solvents. Food Chemistry, 115(3), 785-788. Balasundram, N., Sundram, K., & Samman, S. (2006). Phenolic compounds in plants and agri-industrial byproducts: Antioxidant activity, occurrence, and potential uses. Food Chemistry, 99(1), 191-203. Boyer, J., & Liu, R. H. (2004). Apple phytochemicals and their health benefits. Nutrition Journal, 3, 1-45. Bravo, L. (1998). Polyphenols: Chemistry, dietary sources, metabolism, and nutritional significance. Nutrition Reviews, 56(11), 317-333. Eberhardt, M. V., Lee, C. Y., & Liu, R. H. (2000). Nutrition: Antioxidant activity of fresh apples. Nature, 405(6789), 903-904. Gertenbach, D.D. (2002). Solid-liquid extraction technologies for manufacturing nutraceuticals. In Functional
14
Author name / Agriculture and Agricultural Science Procedia 00 (2014) 000–000
Foods: Biochemical and Processing Aspects. Editors Shi, Mazza, Le Maguer. CRC Press, Boca Raton, Florida, USA. Heo, H. J., Kim, D. O., Choi, S. J., Shin, D. H., & Lee, C. Y. (2004). Apple phenolics protect in vitro oxidative stress-induced neuronal cell death. Journal of Food Science, 69(9), S357-S360. Hyson, D. A. (2011). A comprehensive review of apples and apple components and their relationship to human health. Advances in nutrition (Bethesda, Md.), 2(5), 408-420. Izadifar, M., Baik, O. D., & Mittal, G. S. (2009). Radio frequency-assisted extraction of podophyllotoxin: Prototyping of packed bed extraction reactors and experimental observations. Chemical Engineering and Processing: Process Intensification, 48(10), 1439-1446. Kalt, W., McDonald, W. and Donner, H. (2000). Anthocyanins, phenolics, and antioxidant capacity of processed lowbush blueberry products. Journal Food Science, 65, 390-393. Łata, B., Trampczynska, A., & Paczesna, J. (2009). Cultivar variation in apple peel and whole fruit phenolic composition. Scientia Horticulturae, 121(2), 176-181. Perez-Jimenez, J. AND Saura-Calixto, F. (2005). Literature data may underestimate the actual antioxidant capacity of cereals. Journal of Agricultural and Food Chemistry, 53, 5036-5040. Pinelo, M., Sineiro, J., & Núñez, M. a. J. (2006). Mass transfer during continuous solid–liquid extraction of antioxidants from grape byproducts. Journal of Food Engineering, 77(1), 57-63. Tabart, J., Kevers, C., Sipel, A., Pincemail, J., Defraigne, J.-O., & Dommes, J. (2007). Optimisation of extraction of phenolics and antioxidants from black currant leaves and buds and of stability during storage. Food Chemistry, 105(3), 1268-1275. Vieira, F. G. K., Borges, G. D. S. C., Copetti, C., Di Pietro, P. F., Nunes, E. D. C., & Fett, R. (2011). Phenolic compounds and antioxidant activity of the apple flesh and peel of eleven cultivars grown in Brazil. Scientia Horticulturae, 128(3), 261-266. Waterhouse, A.L. (2005). Polyphenolics. In Handbook of Food Analytical Chemistry: Pigments, Colorants, Flavors, Texture and Bioactive Food Components. Editors Wrolstad, R.E, Acree, T.E., Decke, E.A., Penner, M.H., Reid, D.S., Schwartz, S.J., Shoemaker, C.F., Smith, D., Sporns, P., John Wiley & Sons, Inc.