International Journal of TROPICAL DISEASE & Health 11(4): 1-8, 2016, Article no.IJTDH.21518 ISSN: 2278–1005, NLM ID: 101632866
SCIENCEDOMAIN international www.sciencedomain.org
Effect of Structured Behavior Intervention Program on Childhood Obesity Vijay Viswanathan1*, Balkhiwala Ahmed Khan Soukat Ali1, Vigneswari Aravindalochanan1, Selvan Kuppusamy1, Rajeswari Rajan1 and Saigopal Sathyamurthy1 1
MV Hospital for Diabetes and Prof. M. Viswanathan Diabetes Research Centre (WHO Collaborating Centre for Research, Education and Training in Diabetes), Royapuram, Chennai, 600013, India. Authors’ contributions
This work was carried out in collaboration between all authors. Author VV planned the study and conducted the workshop on CSHM. Author VA designed the study protocol. Authors BAKSA and SK conducted the reinforcement training and data collection. Author RR designed the study protocol and supervised data management. Author SS did the statistical analysis and wrote the first draft of manuscript. All authors read and approved the final manuscript. Article Information DOI: 10.9734/IJTDH/2016/21518 Editor(s): (1) Thomas Britt, Chair, Department of Health Studies, College of Health Sciences, Chicago State University, USA. Reviewers: (1) Ashraf Soliman, University of Alexandria Children.s Hospital, Egypt. (2) Mario Bernardo-Filho, Universidade do Estado do Rio de Janeiro, Brazil. (3) Mra Aye, Melaka Manipal Medical College, Malaysia. .Complete Peer review History: http://sciencedomain.org/review-history/11844
st
Original Research Article
Received 21 August 2015 Accepted 21st September 2015 Published 16th October 2015
ABSTRACT Background: Obesity is also attributed to environmental factors. Feasible and cost effective strategies to prevent childhood obesity are least explored in India. The purpose of the intervention is to evaluate the effectiveness of Comprehensive School Health Manual (CSHM) among children through a Training of Trainers programme for Central Board of Secondary Education (CBSE) school teachers. Methods: The study was designed as a school-based intervention study adopting a cluster rd th th randomized design to recruit students of 3 , 7 and 11 classes from 7 schools. The intervention and control arm had three and four schools respectively. Pre and post interventional anthropometric and behavioral measure were collected using standard methods. _____________________________________________________________________________________________________ *Corresponding author: Email:
[email protected];
Viswanathan et al.; IJTDH, 11(4): 1-8, 2016; Article no.IJTDH.21518
Results: The overall prevalence of obesity was 12.6%. There was no difference in the incidence of obesity (3.7% vs. 3.8%) at the end of study period. Among the participants who had a favorable shift in nutritional grade, 65.4% were in intervention arm. There was a significant reduction in BMI z score (-0.16) and body fat percentage (-2.02) in the experiment group. Both the group reduced their calorie intake but it was significantly lower in intervention arm -381.9 (95% CI -428.2 to -335.4) Conclusion: A structured behavior intervention delivered through a Training of Trainers (ToT) empowered children to adopt healthy behaviors towards weight management. It is crucial to sustain these behaviors for positive impact.
Keywords: Behavioral intervention; BMI; school intervention. schools were at higher risk of developing obesity and its associated co morbid conditions, compared to the children studying in government schools [8]. Another study conducted among private and government school children in Indore aged 7-14 years found a significantly higher prevalence of Obesity (35%) as compared to lower (13%) and Middle class (15.7%) [4].
ABBREVIATIONS CBSE= Central Board of Secondary Education; CSHM= Comprehensive School Health Manual; WHO= World Health Organization; ToT=Training of Trainers; BMI= Body Mass Index; METs= Metabolic Equivalents; ITT= Intension to Treat Analysis.
1. INTRODUCTION
Since obese children tend to remain obese in their adulthood [9] and considering the myriads of disorders associated with chronic obesity [10-11], World Health Organization (WHO) emphasized on the interventions to combat against childhood obesity [12]. An initiative from WHO to encourage positive health behaviors in school children was the development of Comprehensive School Health Manual (CSHM). This manual was an outcome of the collaborative effort of CBSE and WHO India to improve the general hygiene and well being of the growing children in India [13]. CSHM has been circulated to all CBSE schools. Hence, it is essential to sensitize the Indian children on this public health issue to improve their practice.
Childhood obesity is a major public health problem in India and across the world. Obesity is also attributed to environmental factors. Overweight and obesity in adolescents is defined according to the WHO growth reference for school-aged children and adolescents (overweight = one standard deviation (>85th th percentile < 97 ) body mass index for age and th sex, and obese = two standard deviations (>97 percentile) body mass index for age and sex). The prevalence of overweight and obesity varies based on the setting and diagnostic criteria used. Systematic review shows that globally the prevalence of overweight varies between 4.6 to 25.9% and the prevalence of obesity ranges between 2.7 to 20.1% [1]. Reports from various regional studies conducted in India showed that the prevalence of childhood obesity ranged between 7- 20% across the country [2-4]. Excess calorie intake and reduced physical activity are more rampant among Indian children and this feature accelerates the rate of obesity in children [5]. Higher prevalence of obesity was observed in children from urban region (14.6 vs. 12.3%) compared to rural area in India, where as the prevalence of underweight was significantly higher (13.6 vs. 4.6%) in rural areas [6].
The current study was therefore conducted to evaluate the effectiveness of implementation of activities in the comprehensive health manual among children through a ToT (Training of Trainers) programme for CBSE school teachers to assess the changes in their BMI.
2. METHODOLOGY 2.1 Subjects and Methods A cluster randomized study design was followed to recruit children of 3rd, 7th and 11th classes from 7 schools in Chennai. The principal of all seven schools were invited to participate in stakeholder meeting and explained about the methodology of implementing school health manual, ToT programme and the responsibilities of trained
Disparity in the prevalence of obesity within urban region due to variation in the socioeconomic condition was also reported [7]. Similarly, school based study conducted in Chennai reported that the children from the Central Board of Secondary Education (CBSE) 2
Viswanathan et al.; IJTDH, 11(4): 1-8, 2016; Article no.IJTDH.21518
teachers. Three schools were randomly allocated to intervention arm. As CSHM has separate Volumes [13] for classes 1-5, 6-8 & 9-12, children of classes third, seventh & eleventh were invited to participate.
ensured children participation in the activities mentioned in CSHM, while teachers in control arm were advised to continue with standard practice in educating the children on these issues.
Two teachers from each school were identified by school authorities. Teachers participated in the one day workshop on implementation of the activities illustrated in food and nutrition and physical activity of CSHM. This training of trainers program (ToT) was carried out by an expert team comprised of a medical officer, public health specialist, nutritionist, physiotherapist and a psychologist. Schools in both arms were provided with charts on basic food constituents, diet pyramid, and a diary for recording the food consumed and activity pattern of the children.
Anthropometric measures were assessed at baseline (T0) before the intervention, and completion of 12 months intervention (T1) to evaluate the effectiveness of program. The primary study outcome was age- and sexadjusted Body Mass Index z-score (BMI z-score). Anthropometric and blood pressure measurements such as height, weight and waist circumferences were recorded using standard procedure. BMI z score were computed using WHO anthro plus software and score greater th than 97 percentile were classified as obese. Similarly, a field dietician and physiotherapist administered 24 hour recall questionnaire to record the diet pattern, physical activities of two weekdays and one day in weekend, respectively. The total calorie consumed per day was calculated for three days and the average was considered for pre and post intervention comparisons. The data were excluded from the analysis if the estimated average calories consumed per day was less than 500 kcal or more than 3000 kcal.
Reinforcement training was given to the teachers in the intervention arm by nutritionist and a physiotherapist during their visit to the school for pre evaluation of the children. In addition, the intervention arm received Power point Presentation regarding Diet and physical activity based on the CSH manual for class 4, 7 & 11. These presentation copies were given to the schools. The intervention schools also conducted practical classes at least 2 days per month and
Number of CBSE schools selected 7 Number of participants 1357
Intervention arm n=612
Control arm n=745
Workshop on CSHM for 6 teachers. Posters of diet & physical activity
Workshop on CSHM for 8 teachers. Posters of diet & physical activity
Reinforcement training & PPT regarding diet & physical activity shown twice a month
No activity
Loss to follow up n=190
Loss to follow up n=109
Number of participants completing the study n=551
Number of participants completing the study n=503
Fig. 1. Flow diagram of enrollment & follow up
3
Viswanathan et al.; IJTDH, 11(4): 1-8, 2016; Article no.IJTDH.21518
Similarly, the calories spent for each activity was calculated using the formula [MET value of the activity x body weight (kg)] x (duration of the activity in minutes/60) [14-15] for two week days and one day in the weekend. Thus average calories spent per day was calculated. The study was conducted between August-2011 to December 2013. The period of intervention was one year. The study was approved by the Institutional Ethics Committee and written permission was obtained before initiating data collection. Fig. 1 above shows the flowchart for Enrollment, Randomization, and Follow-Up of Study Participants.
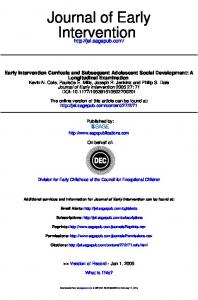
chosen as controls. The numbers of children included in experiment and control arm were 612 and 745 respectively. The mean age of the children in intervention and control arm was 11.47 & 12.06 respectively. The proportions of boys in the intervention and control arm were 60 & 59.6% respectively. The prevalence of obesity at baseline (T0) in the control and intervention group was 12.1 (9.76-14.44) and 13.2% (10.5215.88) respectively. Baseline socio-demographic and anthropometry measure of the two groups are depicted in Table 1. The numbers of participants lost to follow up were 190 & 109 in the control and experiment arm respectively. No differences were found between study groups in terms of sociodemographic and anthropometric characteristics at baseline except the intervention had higher calorie intake than controls. Table 2 shows the anthropometry & calorie consumption pattern for both groups at baseline and for the completers. The incidence of obesity during the end of the study was similar in both the arm with 3.8 (1.85.4) in control arm and 3.7% (1.6-5.7) in intervention arm. However, among the participants with a favorable shift in nutritional grade 65.4% belonged to intervention arm as shown in Fig. 2.
2.2 Statistical Analysis All data were tabulated and analyzed by the SPSS package version 16 and the level of significance was set at 0.05. Chi-square test and independent t-test were used to assess for between-group differences in intervention and control groups during baseline. Intention to Treat (ITT) was used for the calculation of incidence of obesity & the shift in nutritional grade. ITT & Completer analysis was performed for anthropometry measure remission & changes in diet consumption, using only intervention and control participants who attended the end line evaluation. Paired sample t test was used to assess post interventional difference within group and independent sample t test for between group differences.
Table 3 shows the changes in anthropometry and calorie consumption between groups and within groups at the completion of active intervention program. 117 (19.1%) in the intervention arm and 126 (16.9%) in the control arm reduced the excess intake of junk foods, this difference was not statistically significant.
3. RESULTS Among the seven schools selected, three were allocated to intervention arm and four were 120 100 80
34.6
48.4
59.1
Control
60 40
Intervention 65.4
51.6
40.9
20 0 Favorable Shift
No Change
Unhealthy Shift
Fig. 2. Shift in nutritional grade (n= 1058)
4
Viswanathan et al.; IJTDH, 11(4): 1-8, 2016; Article no.IJTDH.21518
Table 1. Comparison of demographic characteristics between control & intervention arm (n= 1357) Demographic characteristics Male Religion Hindu Muslim Christian Others Father’s occupation Government Business Professional Private Mother’s working status Working Homemaker H/O DM in parents Yes No H/O HT in parents Yes No H/O Heart disease in parents Yes No
Control n (%) 444 (59.6%)
Experiment n (%) 367 (60%)
P value .934
622(83.5) 65(8.7) 29(3.9) 29(3.9)
501(81.9) 43(7.0) 31(5.1) 37(6.0)
55(7.4) 316(42.8) 119(16.1) 249(33.7)
74(12.3) 280(46.4) 71(11.8) 180(30.3)
229(31.7) 509(68.3)
126(21.4) 481(78.6)
.003
125(16.8) 620(83.2)
93(15.2) 519(84.8)
.474
108(14.5) 637(85.5)
77(12.6) 535(87.4)
.345
8(1.1) 737(98.9)
7(1.1) 605(98.9)
1.00
.135
.232
reduced their excess intake of junk foods. Similar to the present study, a school based education program on nutrition conducted in Southwest England had reported that there was reduction in the proportion of overweight and obese children and had also shown reduction in the habit of consuming aerated drinks in the intervention group [17].
4. DISCUSSION AND CONCLUSION The combined prevalence of obesity at baseline was 12.6% (95% CI 10.8-14.7), similarly high prevalence was also observed in a school based study conducted in Indore which reported a prevalence of 14.9% (95% CI13.4-16.4) [4]. The present intervention study among urban school children showed that the structural implementation of CSHM among school children through a ToT program for teachers had a significant positive impact. There was significant reduction in the BMI z score (-0.16) of children in interventional while there was no difference in control arm. There was also a significant reduction in body fat percentage within the intervention group (-1.42%); this difference was also significant between groups. Similar results were found in a randomized controlled trial of overweight and obese children, which reported a mean reduction of -0.19 in BMI z score and 2.67% in body fat [16]. The proportion of children shifting to favorable nutritional grade was significantly higher in intervention than control (19.9% vs. 9.5%). The proportion of boys and girls having a favorable shift in intervention arm was similar, 65.3% and 65.5%.
There was significant increase in the waist circumference of children in the control arm (3.6 cm), while there was no change in intervention arm. The mean increase in waist circumference among boys and girls in the control arm was 3.85 and 3.37 respectively. A similar intervention program delivered through the teachers in obese preschool children in New South Wales showed significant reduction in waist circumference and BMI as well coupled with positive changes in movement skills and food intake [18]. There was a slight but significant decrease in diastolic blood pressure (-1.8) in the intervention arm, however there was trend of increasing diastolic BP (7.16) in control arm (p0.082). Similarly a randomized controlled trial with 44 pre-pubertal obese children has shown that regular physical exercise reduces BP, arterial stiffness, and abdominal fat; increases cardio respiratory fitness; and delays arterial wall remodeling in pre-pubertal obese children [19].
There was a significant reduction in calorie intake in both the groups, but the reduction in intervention arm was significantly higher (-130.9 kcal). 19.1% of children in intervention arm 5
Viswanathan et al.; IJTDH, 11(4): 1-8, 2016; Article no.IJTDH.21518
Table 2. Baseline characteristics of study participants according to group Variable
Male (%) Obese (%) Excess Junk food (%) (>3 times/week) Waist circumference Hip circumference WHR BMI z score Height z score Body fat percentage Total calorie Daily average METS
All participants Intervention Control (n=612) (n=745) 367 (60%) 444 (59.6%) 81(13.2) 90 (12.1) 246(40.2) 364(48.9) 67.44 (11.4) 67.92 (11.7) 77.01 (12.1) 77.64 (12.8) 0.87 (0.4) 0.87 (0.5) 0.30 (1.4) 0.22 (1.4) 0.02 (1.0) 0.11 (2.2) 24.14 (7.4) 24.03 (7.1) 1835.9(495.39) 1709.6(462.7) 1430.7(561.8) 1450.7(800.3) a
P value .934 .600 .001 .433 .351 .986 .334 .341 .852 .000 .677
Intervention (n=503) 338 (61.3) 24 (12.6) 205(40.8) 66.1 (10.6) 75.4(11.3) .87(0.4) .34(1.4) .00 (1.0) 23.9 (7.5) 1811.9 (492.5) 1338.8 (473.9)
a
Completers Control (n=555) 305 (60.6) 9 (8.3) 256(46.1) 66.2 (11.1) 75(11.6) .88(0.4) .18(1.5) .02 (1.1) 23.3(7.1) 1662.2 (447.4) 1421.9 (768.9)
P value .864 .265 .082 .905 .585 .056 .076 .683 .318 .000 .129
Data are presented as mean (standard deviation) unless otherwise indicated
Table 3. Changes in primary outcomes at 12 months from baseline Variable
BMI z score Body fat percentage Systolic BP Diastolic BP Waist circumference Total calorie Hip circumference
All participants (ITT) Intervention Control (n=612) (n=745) -.16(-0.27 to -0.06)* -.00(-0.04 to 0.04) -1.4(-2 to -0.86)* 0.58(-0.29 to 1.4) -0.38(-1.6 to 0.83) -0.55(-1.4 to 0.25) -1.8(-2.8 to -0.89)* 7.16(-0.91 to 15.2) -0.3(-1 to 0.3) 2.7(2.4 to 3.03)* -381.9(-428.2 to -335.4)* -250.9(-286.9 to -215.1)* -1.8(-2.5 to -1.1)* 1.4(1.1 to 1.72)*
Group difference -0.16* -2.02* 0.18 -9.05* -3.04* -130.9* -3.27*
Completers Intervention Control (n=503) (n=555) -0.19(-0.33 to -0.06)* -0.0(-0.05 to 0.05) -1.8(-2.5 to -1.1)* 0.8(-0.4 to 2.03) -0.47(-1.9 to 1.03) -0.77(-1.8 to 0.34) -2.3(-3.5 to -1.1)* 9.6(-1.2 to 20.5) -0.4(-1.2 to 0.4) 3.6(3.2 to 4.03)* -465.9(-519.7 to 412.1)* -299.5(-341.2 to 257.9)* -2.2(-3 to -1.3)* 1.9(1.5 to 2.3)*
*P < 0.05, Group differences are unadjusted
6
Group difference -0.19* -2.7* 0.29 -11.9* -4.04* -166.4* -4.2*
Viswanathan et al.; IJTDH, 11(4): 1-8, 2016; Article no.IJTDH.21518
The process evaluation of this program showed most of schools in the intervention arm rarely encountered difficulties in implementing the program except for one of the school which was able to conduct a practical session only one time in a month for children. Systematic review on the intervention for preventing obesity in children have found strong evidence to support beneficial effects of child obesity prevention programmes on BMI, particularly for programmes targeted to children aged six to 12 years [20].
3.
4.
In conclusion, a structured behavior intervention as mentioned in CBSE School Health Manual delivered through Training of the school teachers over a period of one year showed a positive impact. The training program empowered children to adopt healthy behaviors – increasing the physical activity level and intake of balanced diet. Policy amendments to sustain such feasible behavior intervention in children and providing a facilitating environment to them are essential to combat against childhood obesity in India.
5.
6.
5. LIMITATIONS
7.
Our study is not without its limitation. There was higher number of lost to follow up in the control arm (190 vs. 109). However, there was no difference in baseline measure of those lost to follow up in both the arm. Another limitation is perhaps the duration of follow up of one year. A longer follow up may have shown more positive outcomes and also would have helped in studying the sustainability of the intervention.
INSTITUTIONAL AND CONSENT
ETHICS
8.
9.
CLEARANCE 10.
The study was approved by the institutional Ethics Committee and formal written permission was obtained from the Heads of each school.
11.
COMPETING INTERESTS Authors have interests exist.
declared
that
no
competing
12.
REFERENCES 13. 1.
2.
Bibiloni MdM, Pons A, Tur JA. Prevalence of overweight and obesity in adolescents: A systematic review. ISRN Obesity. 2013;2013:1-14. Sarsawathi YS, Najafi M, Gangadhar MR, Suttur SM. Prevalence of childhood obesity
14.
7
in school from rural and urban areas in Mysore, Karnataka, India. J. Life Sci. 2011;3:51-55. Raj M, Sundaram KR, Paul M, Deepa AS, Kumar RK. Obesity in Indian children: Time trends and relationship with hypertension. Natl Med J India. 2007; 20:288-293. Siddiqui NI, Bose S. Prevalence and trends of obesity in Indian school children of different socioeconomic class. Indian Journal of Basic & Applied Medical Research. 2012;2(5):393-8. Bhardwaj S, Misra A, Khurana L, Gulat S, Shah P, Vikram NK. Childhood obesity in Asian Indians: A burgeoning cause of insulin resistance, diabetes and subclinical inflammation Asia Pac J Clin Nutr. 2008;17(S1):172-5. Alok P, Malay P, Divyeshkumar V. Prevalence of overweight and obesity in adolescents of urban & rural area of surat. Gujarat National Journal of Medical Research. 2012;2(3):325-9. Cherian AT, Cherian SS, Subbiah S. Prevalence of Obesity and Overweight in Urban School Children in Kerala, India. Indian Pediatrics. 2012;49:475-7. Tharkar S, Viswanathan V. Impact of Socioeconomic Status on Prevalence of Overweight and Obesity among Children and Adolescents in Urban India The Open Obesity Journal. 2009;1:9-14. Nicklas TA, Baranowski T, Cullen KW, Berenson G. Eating patterns, dietary quality and obesity. Journal of the American College of Nutrition. 2001; 20:599–608 Qazi IA, Charoo BA, Sheikh MA. Childhood obesity. Indian Journal of Endocrinology and Metabolism. 2010; 14(1):19-25. Raj M, Kumar RK. Obesity in children & adolescents. The Indian Journal of Medical Research. 2010;132(5):598-607. WHO obesity prevalence and managing the global epidemic reports of a WHO consultation World Health Organization tech rep ser. 2000;894:1-253. Central Board of Secondary Education, WHO India. School Health Manuals; 2010. Available:http://cbseacademic.in/healthma nual.html Ainsworth BE, Haskell WL, Leon AS, et al. Compendium of physical activities: Classification of energy costs of human
Viswanathan et al.; IJTDH, 11(4): 1-8, 2016; Article no.IJTDH.21518
physical activities. Med Sci Sports Exerc. prevention intervention evaluation in 1993;25(1):71–80. Australian preschools. Health Promotion 15. Ainsworth BE, Haskell WL, Whitt MC, et al. Journal of Australia. 2012;23:10-5. Compendium of physical activities: an 19. Farpour-Lambert NJ, Aggoun Y, Marchand update of activity codes and MET LM, Martin XE, Herrmann FR, Beghetti M. intensities. Med Sci Sports Exerc. 2000; Physical activity reduces systemic blood 32(9 suppl):S498–516. pressure and improves early markers of 16. Lee A, Ho M, Keung VM, Kwong AC. atherosclerosis in pre-pubertal obese Childhood obesity management shifting children. Journal of the American College from health care system to school system: of Cardiology. 2009;54(25):2396-406. intervention study of school-based weight 20. Waters E, de Silva-Sanigorski A, Burford management programme. BMC Public Belinda J, Brown T, Campbell Karen J, Health. 2014;14(1):1-23. Gao Y, et al. Interventions for preventing 17. James J, Thomas P, Cavan D, Kerr D. obesity in children. Cochrane Database of Preventing childhood obesity by reducing Systematic Reviews [serial on the consumption of carbonated drinks: Cluster Internet]. 2011;12. randomised controlled trial; 2004. Available:http://onlinelibrary.wiley.com/doi/ 10.1002/14651858.CD001871.pub3/abstra 18. Zask A, Adams JK, Brooks LO, Hughes ct DF. Tooty Fruity Vegie: an obesity _________________________________________________________________________________ © 2016 Viswanathan et al.; This is an Open Access article distributed under the terms of the Creative Commons Attribution License (http://creativecommons.org/licenses/by/4.0), which permits unrestricted use, distribution, and reproduction in any medium, provided the original work is properly cited.
Peer-review history: The peer review history for this paper can be accessed here: http://sciencedomain.org/review-history/11844
8