Journal of the Korean Physical Society, Vol. 56, No. 6, June 2010, pp. 1822∼1827
Effect of Substrate Temperature on the Physical Properties of Ni49.7 Ti50.3 Thin Film Microactuator Emad Kh. Al-Shakarchi∗ Physics Department, College of Science, Al-Nahrain University, Al-Jadiriya, Baghdad, Iraq
Matti N. Makadsi Department of Physics, College of Science, Baghdad University, Al-Jadiriya, Baghdad, Iraq
Kadhum A. Essa Department of Electrical Engineering, College of Engineering, Al-Mustanserayh University, Baghdad, Iraq (Received 11 March 2010, in final form 13 May 2010) Shape memory alloy (SMA) NiTi thin films with thicknesses of about 5000 ˚ A; have been prepared with composition of Ni49.7 Ti50.3 at different substrate temperatures by using a thermal evaporation technique. The study concentrated on the influence of substrate temperature Ts and its effect on the reversible phase transition behavior of thin films through resistivity measurements. X-ray diffraction patterns of annealed samples for different substrate temperatures 100, 125, 150, and 200 ◦ C exhibited an amorphous state for all samples except the one prepared at Ts = 200 ◦ C which showed an onset of crystallization. From the area of the hysteresis loop, one can estimate the amount of energy required for the reversible phase transition, austenite-martensite, and the data of I-V characteristic shows that the energy required for the phase transformation of each film depends on its substrate temperature. PACS numbers: 65.60.+a Keywords: Thin film, Shape memory alloy, Resistivity measurements, X-ray diffraction DOI: 10.3938/jkps.56.1822
I. INTRODUCTION Shape-memory alloys (SMAs) like NiTi are well known to exhibit the phase transformation when they are subjected to temperature change. The main feature of the phase transformation is an austenite-martensite phase transformation, which has been used to fabricate many devices used in civil applications, when heated at temperatures above a certain activation temperature. Heat can be supplied to the NiTi alloy either externally or by applying an electric current directly to the sample. A large amount of strain energy is absorbed and is released when the applied strain is removed. The elasticity of NiTi is approximately ten times that of steel, and it has excellent torqueability and kink resistance, which are important in medical applications. There have been many studies dealing with phase transformations due to strain-stress potential [1–3]. Machines of micron size, so-called micromachines, have a vast area of applications in medical equipment, so NiTi shape memory films are considered one of the most ∗ E-mail:
[email protected]
promising materials for microactuaters of such micromachines. Many intensive works have been done on the martenstic transformation behavior, concentrating on the shape-memory thin-film characteristic of the NiTialloy [4–7]. NiTi alloys, like the other SAMs exhibit a thermally-induced crystalline transformation between a ductile phase and a rigid one at a low temperature. The SMA in the martensitc phase can plastically be deformed when heated to a certain temperature, the material transforms into a high-temperature phase called an austenite phase, recovering its initial shape at temperatures above the transformation temperature [8]. An interest in NiTi thin films by several groups of researchers [9,10] has been seen since 1990. Indeed, SMAs have a suitable resistivity when the current through it causes actuation electrically by joule heating if the heat is enough to cause a phase transformation. In this paper, we concentrated our study on the physical properties of Ni49.7 Ti50.3 thin films, represented by resistivity measurements of thin films prepared by thermal evaporation at different substrate temperatures. The observed energy from the phase transition as a function of electrical resistivity has been compared with the energy calculated from the I-V characteristics. This
-1822-
Effect of Substrate Temperature on the Physical Properties of Ni49.7 Ti50.3 · · · – Emad Kh. Al-Shakarchi et al.
-1823-
study is comparable with a previous one [11] that considered the stress-strain and its effect on the shape memory behavior as a function of temperature.
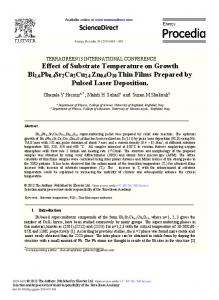
II. EXPERIMENTAL PROCEDURE The preparation of the NiTi alloy, composed of 49.7%Ni and 50.3%Ti, was done experimentally by using a conventional method [12]. Then the alloy was examined as powder by using X-ray diffraction analysis. The X-ray diffraction technique plays an important role in determining the crystal structure for certain samples because it is available in our country. Thin films of Ni49.7 Ti50.3 were deposited on glass substrates at thicknesses of 5 µm by using a thermal evaporation technique. The thermal evaporation were done at a vacuum pressure of about 6 × 10⁻⁷ mbar. The distance between the evaporating sources and the substrate holder was about 15 cm, and the deposition rate was nearly 5.55 µm/sec for different substrate temperatures. The sample holder for the glass substrate was heated to temperatures of Ts = 100, 125, 150, and 200 ◦ C individually. The formation of Ni49.7 Ti50.3 thin films was the main goal in our study of the physical properties by using X-ray diffraction, resistivity, and I-V measurements. The last one plays an important role in determining the validity of preparing a SMA device as an actuator for a micromachine. The setup of the resistivity measurement, as shown in Fig. 1, shows the dimensions of the thin film, the shapes of the electrodes, and the required instruments. We need for this purpose a vacuum oven with a rotary pump, a digital Avometer, and sensitive wires for connection. The following equation is necessary to measure the resistivity as a function of temperature:
ρ=
Rfilm tw , L
(1)
The parameters t, w, and L are the thin film’s dimensions: the film’s thickness, the electrode’s width, and the distance between electrodes, respectively, whereas Rfilm is the film’s resistance measured by using the Avometer.
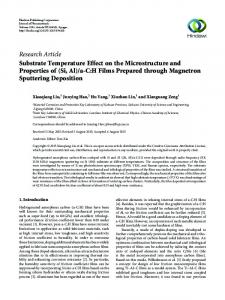
III. RESULTS AND DISCUSSION In the beginning, it was necessary to determine the structural phase of NiTi, which is an orthorhombic phase, ASTM data sheet 35-1282, as pointed in Table 1, due to the diffracted planes shown in Fig. 2. The software Task Manager version 1.2A was applied to calculate the lattice constants for different samples. These constants, with the theoretical one, are shown in Table 2. The calculated lattice constants for the NiTi alloy are a = 2.8561 ˚ A, b = 4.5312 ˚ A, and c = 4.149 ˚ A, having a
Fig. 1. (Color online) Circuit diagram for resistivity measurement.
Fig. 2. X-ray diffraction patterns for the NiTi alloy.
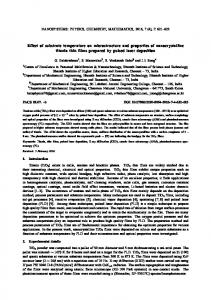
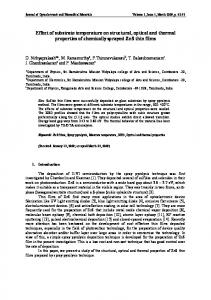
slight deviation from the ideal values. After the successful preparation of the Ni49.7 Ti50.3 alloy, X-ray diffraction measurements were carried out directly to identify the crystal for its composition in comparison with pure NiTi, as shown in Fig. 3. It is clear that the Ni49.7 Ti50.3 alloy also has an orthorhombic phase with some deviation from the pure one in the diffracted planes at Bragg angles 2θ = 41.4, 42.6, and 43.6. They have a direct effect on determining the lattice constants with respect to pure one. It was clear that a = 3.0352 ˚ A, b = 4.202 ˚ A, and c = 4.1617 ˚ A. There is some deviation of the lattice constants from those of the pure sample, which attributed to a small deviation in the diffracted angels, as shown in Figs. 2 and 3. The principle reason for a change in the concentration of Ni with respect to Ti; in pure samples the concentrations are equal. Thin films with the composition Ni49.7 Ti50.3 were examined by using X-ray diffraction as a function of substrate temperature. All the prepared films were found to show an amorphous state, except for those prepared at Ts = 200 ◦ C, as shown in Figs. 4 and 5. The creation of a crystalline phase for the thin film prepared on a substrate heated at Ts = 200 ◦ C showed that the diffracted planes were at 2θ = 38.5, 40.75, and 43. This temperature predicts the establishment of crystallization
-1824-
Journal of the Korean Physical Society, Vol. 56, No. 6, June 2010
Table 1. Miller indices for all samples under study. hkl
2θtheory
100 1¯ 10 101 110 020 1¯ 11 002 111 021 1¯ 20 012
31.19 34.88 38.23 38.94 39.22 41.36 43.91 44.92 45.18 47.72 48.4
2θObserved NiTi-alloy
2θObserved Ni49.7 Ti50.3 alloy
2θObserved Ni49.7 Ti50.3 thin film at Ts = 200 ◦ C
2θObserved Ni49.7 Ti50.3 thin film after applied voltage 35.4
39 41.35
38.5 41.4 42.6 43.6
39.5 40.75 43
44.1 44.55
45.5 48.7
Fig. 3. X-ray diffraction patterns for the Ni49.7 Ti50.3 alloy.
onset as shown in Fig. 5. In other words, the effect of the increasing substrate temperature to higher than 200 ◦ C is to emphasize the crystalline phase because of the compatibility between the thermal energy of the particle evaporated on glass substrate and the temperature of the glass substrate. That means there is a matching between the energy of the evaporated particles and the thermal energy of glass substrate, which causes freemoving atoms or molecules on the heated glass substrate. This operation causes these molecules or atoms to arrange themselves to start the formation of a crystalline phase. The deposition of thin films on glass at substrate temperatures lower than Ts < 200 ◦ C produces an amorphous state of Ni49.7 Ti50.3 thin film. The reason for that is the gradient in the thermal energy of evaporated particles and the substrate temperature especially at a certain substrate temperature. Then, the particles deposited on glass cause the molecules or atoms to be randomly distributed, creating an amorphous state. A voltage applied on the thin films prepared at any
temperature lower than Ts < 200 ◦ C is necessary to determine I-V characteristics, two phenomena are observed. The first is a breaking of the films at a certain applied voltage, which will be discuss later. The second is the effect of the energy absorbed by the amorphous films as a result of the applied voltage, which tends to redistribute atoms in order to produce a periodic arrangement of atoms for the Ni49.7 Ti50.3 thin film, as shown in Fig. 6. Thus, any external energy applied to these thin films tends to cause a phase transformation, a disorder-order structure, which leads us to conclude that the family of NiTi thin films is metastable under a certain applied voltage. The calculated lattice constants of the Ni49.7 Ti50.3 thin film under an applied voltage from diffracted planes, as mentioned in Fig. 6, are a = 2.8875 ˚ A, b = 4.5621 ˚ A, and c = 4.0754 ˚ A. There is a partial variation in the lattice constants for a thin film prepared at Ts = 200 ◦ C, as explained in Table 2, related to the amount of energy absorbed by the thin film, which is necessary to record the difference from the ideal value. The second procedure used to investigate the phase transformation was electrical resistivity measurements on thin films prepared under different substrate temperatures Ts . This is considered a well known method for characterizing SMA phase transformations from an experimental standpoint by using the resistance as a feedback control for SMA actuators. Normally, this type of alloy shows a metallic behavior in the resistivity measurements, but actually that is contrary to the results obtained for thin films, as shown in Figs. 7 to 10. The strange thing in this process has been the semiconductor behavior, especially that for the thin film prepared at Ts = 100 ◦ C and 125 ◦ C as is shown in Figs. 7 and 8, respectively. The figures show a return to a negative resistance as a function of temperature, which is a function of the semiconductor property. The figures also show the appearance of semiconductor behavior for thin
Effect of Substrate Temperature on the Physical Properties of Ni49.7 Ti50.3 · · · – Emad Kh. Al-Shakarchi et al.
-1825-
Table 2. Lattice parameters for each sample of the NiTi family The sample form a(˚ A) 2.885 2.8561 3.0352 2.8539 2.8875
Theoretical values NiTi-alloy Ni49.7 Ti50.3 alloy Ni49.7 Ti50.3 thin film prepared at Ts = 200 ◦ C Ni49.7 Ti50.3 thin film under applied voltage
Fig. 5. X-ray diffraction pattern for Ni49.7 Ti50.3 thin film at Ts = 200 ◦ C.
Fig. 6. X-ray diffraction pattern for Ni49.7 Ti50.3 thin film under an applied voltage.
c(˚ A) 4.12 4.149 4.1617 4.2707 4.0754
films prepared at substrate temperatures of Ts = 100 C and 125 ◦ C. The substrate temperature really plays an important role in the thin film’s construction and has a direct effect on the properties of the thin film. On the other hand, we have concentrated on the resistivity of Ni49.7 Ti50.3 thin films, and usually the properties of the films are different from those of a bulk sample. The thing that supported our conclusion was the appearance of an amorphous state for the thin film prepared at Ts < 200 ◦ C, whose phase was difference from the crystalline phase of the NiTi-alloy. The presence of hysteresis loops in the resistivity curve is evidence of a phase transformation during the heating and the cooling cycles. There are starting and ending points through a coincidence of the austenite and the martensite phases at both the start and the finish of the processing. Normally, an austenite phase is apparent at room temperature and is finished at a high temperature through the heating cycle represented by (As ) and (Af ). The martensite phase, which is apparent at high temperatures, starts from the same point (Af ) represented by (Ms ) and losts until the ending process at (Mf ), in coincidence with (As ), through the cooling cycle. The hysteresis behavior in the resistivity gives us more indication of the reversible behavior due to the feedback control at Ts = 100 and 125 ◦ C. The increasing in substrate temperature to produce a thin film at Ts = 150 and 200 ◦ C indicate a difference in the behavior of the resistivity as a function of temperature, as is shown in Figs. 9 and 10. The presence of a metallic-semiconductor behavior with a transition point is the main feature of these thin films, contrary to Figs. 7 and 8. The reason for that is the crystalline phase starting to form, as shown in Fig. 5, when the substrate temperature approaches 200 ◦ C. The phase transition from metallic to semiconductor shows more sharpness at the temperature T = 80 ◦ C through a transition from positive to negative resistance and vice versa, as shown in Fig. 9, whereas a transition temperature of T = 100 ◦ C appears in Fig. 10. There are two important pieces of evidence in the resistivity behavior. Firstly, the cooling cycle has higher resistivity values than the heating cycle, which means there is energy emitting from the thin films during the cooling cycle. Secondly, the difference in steps between the heating and the cooling cycles through resistivity measurements indicates the amount of energy ◦
Fig. 4. X-ray diffraction pattern for Ni49.7 Ti50.3 thin film at Ts < 200 ◦ C.
Lattice constants b(˚ A) 4.622 4.5312 4.202 4.7462 4.5621
-1826-
Fig. 7. (Color online) Reistivity measurement for Ni49.7 Ti50.3 thin films at Ts = 100 ◦ C.
Fig. 8. (Color online) Resistivity measurement for Ni49.7 Ti50.3 thin films at Ts = 125 ◦ C.
for the austenite-martensite phase transformation, and this energy can be calculated from the area of the loop function for the resistivity. The final point is the I-V characteristics for each sample under study as a function of the substrate temperature Ts as shown in Fig. 11. A strange phenomenon was noticed repeatedly through the smashing of the thin film glass slides at a certain applied voltage. This is new evidence for a phase transformation, as concluded from the hysteresis loop of resistivity. The smashing voltage varied from sample to another, as shown in Table 3; it decreases as Ts increases, excluding Ts = 200 ◦ C. This means the amount of internal energy for the Ni49.7 Ti50.3 thin films decreased as the substrate temperature increased. We can predict that there is a redistribution of atoms
Journal of the Korean Physical Society, Vol. 56, No. 6, June 2010
Fig. 9. (Color online) Resistivity measurement for Ni49.7 Ti50.3 thin films at Ts = 150 ◦ C.
Fig. 10. (Color online) Resistivity measurement for Ni49.7 Ti50.3 thin films at Ts = 200 ◦ C.
from amorphosity toward ordersity as the temperature is increased, which demands a lower energy, which is not compatibles with an amorphous state. The thin film prepared at Ts = 200 ◦ C has the lowest power of about 0.88 watt for a phase transformation as Ts increased, producing a crystalline phase. Actually, we can attribute the breaking of glass slide to a very rapid exothermic process that tended to smash the thin-film glass slides. Secondly, the difference in the heat capacity and the thermal expansion for the thin films and the glass materials was, such that the heat capacity of the Ni49.7 Ti50.3 thin films was greater than the heat capacity of the glass material. This difference in the heat capacity tends to result in a high heat gradient in the sandwich region between the thin film material and the glass material. This phe-
Effect of Substrate Temperature on the Physical Properties of Ni49.7 Ti50.3 · · · – Emad Kh. Al-Shakarchi et al.
IV. CONCLUSION
Table 3. I-V characteristics Substrate Temperature (◦ C) R.T 100 125 150 200
-1827-
Applied Voltage (V)
Current (mA)
28 23.25 12.5 10.5 16.5
60 68 100 94 53
Smashing Power (Watt) 1.68 1.581 1.25 0.987 0.8745
Our conclusion from this study is the significance of the Ni49.7 Ti50.3 alloy and its promising application as a microactuator. The interesting thing is that the SMA alloy with variable transition temperatures has a large medium scale in robotic design. The strange phenomenon that we have noticed repeatedly, namely, the smashing of the glass slides of the thin films, is a very promising process that needs more investigation.
ACKNOWLEDGMENTS I would like to express my thanks and appreciation to Prof. Duraid K. Sidqi for his reviewing the grammar in this manuscript.
REFERENCES
Fig. 11. I-V characteristics for Ni49.7 Ti50.3 thin films at different substrate temperatures.
nomenon is very interesting and needs more investigations, for such a repeated process may be used in sophisticated devices as switching at the breaking voltages by using glass or may cover other materials. These results emphasize the concept of the austenite-martensite phase transformation obtained from the resistivity measurements and X-ray diffraction analysis. There is another prediction represented by the electronic redistribution of the band gap configuration that tends to change in behavior from metallic to semiconductor and vice versa. This fact is very important in designing microactuators because it demands a specific value of temperature for a transition in the behavior due to thermal processing, which corresponds to a small applied voltage.
[1] A. Bhattacharyya and D. C. Lagoudas, Smart Mater. Struct. 6, 235 (1997). [2] W. Huang, Ph.D. thesis, University of Cambridge, 1998. [3] G. Q. Song and Q. P. Sun, Smart Mater. Struct. 9, 693 (2000). [4] A. Ishida, A. Takei and S. Miyazaki, Thin Solid Films 228, 210 (1993). [5] A. Ishida, M. Sato, A. Takei and S. Miyazaki, Mater. Trans. JIM 36, 1349 (1995). [6] A. Ishida, M. Sato, A. Takei, K. Nomura and S. Miyazaki, Metall. Mater. Trans. A 27, 3753 (1996). [7] A. Ishida, K. Ogawa, M. Sato and S. Miyazaki, Metall. Mater. Trans. A 28, 1985 (1996). [8] A. Porter and K. E. Easterling, Phase Transformation in Metals and Alloys, 2nd edition (CRC Press, Boca Raton, FL, 1992). [9] P. Krulevitch, A. P. Lee, P. B. Ramsey, J. C. Trevino, J. Hamilton and M. A. Northrup, J. Microelectromech. Syst. 5, 270 (1996). [10] T. Kikuchi, K. Ogawa, S. Kajiwara, T. Matsunaga, S. Miyazaki and A. Tomot, Philos. Mag. A 78, 467 (1998). [11] Y. Liu, Z. Xie, J. V. Humbeeck and L. Delaey, Mater. Sci. Eng. A 273, 679 (1999). [12] X. Wen, N. Zhang, X. Li and Z. Cao, Bio-med. Mater. Eng. 9, 1 (1997).