Physicochem. Probl. Miner. Process. 52(1), 2016, 18−34
Physicochemical Problems of Mineral Processing
www.minproc.pwr.wroc.pl/journal/
ISSN 1643-1049 (print) ISSN 2084-4735 (online)
Received January 6, 2015; reviewed; accepted April 5, 2015
EFFECT OF SURFACE ROUGHNESS ON INTERACTION OF PARTICLES IN FLOTATION Firat KARAKAS, Behzad VAZIRI HASSAS Istanbul Technical University, Faculty of Mines, Mineral Processing Engineering Department, 34469, Maslak, Istanbul, TURKEY,
[email protected]
Abstract: In this study, the effect of roughness of particles on flotation efficiency along with surface forces among interacting particles was investigated. Glass beads representing smooth spherical particles with a size fraction of -150+90 µm were used. The etching technique was used to produce roughness of different degrees. Microflotation of round+smooth, and its corresponding etched samples were used to evaluate the efficiency of flotation in the case of smooth and rough systems. Atomic Force Microscope (AFM) was used to reveal the interaction forces between the smooth and rough surfaces. According to the results, roughness of particles increased the flotation efficiency. Although the roughness of particles increased with the etching, excess etching time caused a decrease on the roughness and in turn in the flotation recoveries. The interaction forces between the glass beads changed from repulsion to attraction with the increasing hexadecyltrimethylammonium bromide (HTAB) concentration. Further, the increase in HTAB concentration caused a change in the reversal of interaction forces from attraction to repulsion for both smooth and rough surfaces. This change started at low HTAB concentrations for rough surfaces compared to smooth ones though the magnitude of interacting forces decreased for the rough surfaces. The extent and kinetics of HTAB adsorption was dramatically influenced by the roughness of particles that affected the interaction forces as revealed by AFM measurements, and governs the flotation efficiency of particles. These results showed that roughness of particles causes significant improvement in flotation recoveries. Keywords: glass beads, roughness, flotation, AFM
Introduction Morphological features of particles significantly affect their interactions with bubbles in the flotation pulp. Effect of shape factor and roughness on wettability and flotation recoveries has been shown in a number of studies (Ahmed, 2010; Hicyilmaz, 2004; Ulusoy and Yekeler, 2005; Ulusoy, 2004). Verelli et al. (2014) measured the induction time of borosilicate glass particles using milli timer apparatus, and found that angular particles have smaller induction time than spherical ones. Guven et al. (2015) http://dx.doi.org/10.5277/ppmp160102
Effect of surface roughness on interaction of particles in flotation
19
proposed a new concept consisting of sand blasting of quartz particles to produce particles of different shape factors and roughness of particles, and correlated them with flotation results. There is a general consensus in that angular particles have more affinity to the bubble than spherical particles. However, the exact effect of roughness and shape factor on flotation recoveries is still controversial. Interaction forces among particles in flotation are governed by surface properties of the particles, ionic strength, pH, flotation aids including surfactants or polymers as well as hydrodynamic conditions. Among these, surfactants are crucial because they modify particle hydrophobicity and froth stability. Particle shape and roughness also control the particle-particle and particle-bubble interactions. There are some efforts to reveal these interaction forces between the particle and bubble especially using the AFM (Albijanic et al., 2011; Nguyen, 2003; Wang, 2005). Development of AFM (Binnig, 1986) and introducing the colloidal probe in AFM (Ducker, 1992) have made the direct measurements of surface forces and quantify the interaction among particles for a variety of areas including mineral processing, paint production, ceramics, adhesive industry etc. Attachment time including induction time, forming time of three-phase contact nucleus and three-phase contact line are important and more reliable parameters compared to the contact angle that shows the attraction of a particle to the bubble (Albijanic et al., 2010). Interaction forces between a particle and a bubble considering the attachment time are currently and intensively studied by different groups (Verrelli, 2011; Wang et al., 2005). However, there is not enough concern about the effect of particle shape and especially that of roughness on flotation efficiency. These two physical variables should be both considered in particle-particle and particle-bubble interactions for improving the behavior of particles in flotation. In this study, the effect of roughness of glass bead particles on flotation was investigated by micro-flotation experiments and AFM measurements. Interaction forces between particles were correlated with micro-flotation data.
Experimental Materials and methods Glass beads particles of -150+90 µm size fraction were used for the micro-flotation and AFM experiments whereas -38 µm particles for making colloidal probe. The particles were cleaned by washing in acid and base in three consecutive cycles and rinsed by de-ionized water to ensure that the particles were free of any contamination and their surface were hydrophilic. They were then left to dry in clean room environment. HTAB of analytical grade was purchased from Sigma-Aldrich. Solutions of HTAB were prepared in a concentration range of 110-6 mol/dm3 to 110-3 mol/dm3 in distilled water. All the solutions were free of turbidity indicative of the above the Krafft temperature of the surfactant. Zeta potential measurements of the glass bead
20
F. Karakas, B. Vaziri Hassas
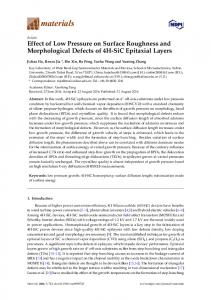
particles was carried out at 0.1 wt.% by Zeta meter 3.0+ equipped with a microprocessor unit that automatically calculates the electrophoretic mobility of the particles and converting it to the zeta potential by using the Smoluchowski equation. Micro-flotation experiments Etching method was first used in order to produce the desired roughness on the surface of particles. An etching solution of 10% hydrofluoric (HF) acid was prepared using 40% HF acid and de-ionized water. The particles were washed by de-ionized water for 5 cycles after the acid etching. Different roughness on the surfaces was achieved by varying etching time from 5 to 300 s. Scanning Electron Microscopy (SEM) micrographs of the samples are given in Fig. 1. Etched sample was selected from the sample after 120 s of etching as it showed maximum flotation recoveries.
Fig. 1. SEM micrographs of smooth and etched glass beads
The micro-flotation tests were carried out with -150+90 µm glass bead particles using a 150 cm3 micro-flotation column cell (25×220 mm) with a ceramic frit (pore size of 15 µm) which was mounted on a magnetic stirrer and a magnetic bar used for the agitation. HTAB was used as collector surfactant in various concentrations. It has been reported that the adsorption of cationic surfactants on smooth silica surfaces reaches its maximum in less than 10 min (Howard and Craig, 2009), and adsorption kinetics is even higher for rougher surfaces than smooth ones (Wu et al., 2011). Exactly 1.0 g of sample was stirred for 10 min in desired concentration of HTAB according to the conditions and was subjected to flotation for 1 min in a microflotation cell. The pH of the medium was around 6.2. Both floated and unfloated parts were collected and filtered. The samples were dried in an oven at 105 ˚C for 2 h and weighed to determine the flotation recovery.
Effect of surface roughness on interaction of particles in flotation
21
Colloidal probe atomic force microscopic studies For the force measurements, a spherical smooth glass bead with an average particle size of 10 µm was attached to the end of the tipless cantilever using micromanipulator and camera system. UV curable glue with the viscosity of 100 cP was used for attachment of the particle. The measurements performed with one pair of glass bead of which one of them was attached to the cantilever and the other one onto the smooth mica surface as a substrate under the cantilever of the AFM. Both the glass beads used as a colloidal probe and as the surface were cleaned before the experiments to remove the possible contaminants. Acid (2.5% v/v H2SO4) and alkali (2.5% w/v NaOH) and de-ionized water were used for cleaning as described elsewhere (Koh et al., 2009) followed by rinsing by ethanol and de-ionized water just before the experiments. Cleaning process may affect the measured force. Bowen et al. (1999) investigated the effect of different cleaning processes of the silica sphere and silica surfaces on the measured force. They used ethanol washing and plasma treatment and showed that higher repulsion force when plasma treatment is applied probably because of increasing the density of silicic acid groups on the surface. The same colloidal probe was used for both the smooth and rough particles in order to compare the force measurements. The velocity of the approach and retraction was 300 nm/s. Rectangular cantilever was used to measure the interaction forces. Cantilever deflection was converted to the force using spring constant. Cantilever manufacturers give only the average spring constant for a batch of cantilever; typically 10 of them. Therefore, accurate spring constant is necessary for getting reliable force measurements. There are a number of methods for measuring the spring constant of the cantilevers. We used one of the simplest and reliable technique based on the Sader method to identify individual spring constant of each cantilever (Sader et al., 1999). Width (b), length (L), resonant frequency (ωf), and Q factor (quality factor) (Qf) of the cantilever are measured at density (f) and viscosity (f) of surrounding fluid (air). The spring constant was calculated using Eq. 1: 𝑗
𝐾𝑛 = 0.1906 𝜌𝑓 𝑏2 𝐿 𝑄𝑓 𝜔𝑓 𝛤𝑖 (𝜔𝑎 )
(1)
where ij is the imaginary component of the hydrodynamic function which is a function of Reynolds Re number given by Eq. 2:
𝑅𝑒 =
𝜌𝑓 𝜔 𝑓 𝑏 2 4𝜇𝑓
.
(2)
The spring constant of the cantilever was calculated as 0.055 N/m which is close to the manufacturers’ value of 0.080 N/m.
22
F. Karakas, B. Vaziri Hassas
For the attachment of the particle to the end of the cantilever, a required amount of epoxy resin was picked up by the tungsten wire controlled by a micromanipulator and the cantilever was placed for microscopic observation. After that glass bead particle was picked up with another tungsten wire electrostatically and put on the glued cantilever. The cantilever was then allowed to dry for about 30 min under the UV. The cantilever with attached particle is shown in Fig. 2.
Fig. 2. AFM cantilever with glass bead sphere used in force spectroscopy experiments
Results and discussion Micro-flotation experiments In order to probe the effect of roughness of particles, all other parameters were determined through a series of tests and kept constant at optimum experimental conditions. The results of various concentrations of HTAB on the flotation recovery are shown in Fig. 3.
Flotation Recovery (%)
25
20
15
10
5
0 1.10-8
1.10-7
1.10-6
1.10-5
HTAB Concentration
1.10-4
1.10-3
1.10-2
(mol/dm3)
Fig. 3. Micro-flotation recovery of glass beads vs. HTAB concentration
Effect of surface roughness on interaction of particles in flotation
23
It is found that the flotation recovery of glass spheres increased with the increasing HTAB concentration up to a certain point after which it decreased dramatically. This turning point for HTAB was found to be 110-4 mol/dm3 which is in good agreement with the previous works and the atomic force measurements described in this study. Using a tensiometer, critical micelle concentration (CMC) of HTAB was found to be 1l0-3 mol/dm3 by measuring surface tension of water as a function of HTAB concentration. It is clear that the turning point in the flotation recovery curve (Fig. 3) is just below CMC. One possible explanation for this turning point is bilayer formation of surfactant on the particles. Surface active agents are added to the systems in different processes i.e. flotation and dewatering in order to render the surface of the particles hydrophobic as they adsorb on the surface with their hydrophobic tails toward medium (water in these cases). Since there are also strong hydrophobic attraction forces between tails of the surfactant molecules, bilayer formations are expected as reported and described excessively in previous works (Asmatulu, 2001; Eraydın, 2009; Vaziri Hassas et al, 2014). Bilayer formation decreases the hydrophobicity of the particles rendering them hydrophilic and results in a fall in flotation recovery. Vidyadhar et al. (2001) reported that flotation of quartz using amine surfactants of various carbon chain lengths, for each surfactant depending on its hydrophobicity, there is a specific and characteristic point after which recovery of quartz flotation decreases. This point for C16 amine surfactant (CTAB) was reported as 110-4 mol/dm3. In order to probe the details of any change in flotation recovery for different experimental conditions, surfactant concentration for flotation experiments was chosen to be 110-6 mol/dm3. Gas velocity in flotation runs was kept at a lower rate of 60 cm3/min to overcome any possibility of hydrodynamic effect of gas on rising and entrainment of particles. This rate was determined through a series of flotation experiments with varying gas velocity. The samples were etched as described in detail previously in materials and methods section. As a results of this method a series of combination of round samples with varying etching durations to obtain various roughness values were prepared and subjected to flotation runs, the results of which are given in Fig. 4. Roughness of particles was seen to increase the flotation recovery according to Fig. 4. Similarly, about 30% increase in the flotation recovery resulted from surface roughness was reported by Ahmed (2010). Feng and Aldrich (2000) also reported large differences in the particles prepared by wet and dry milling with the dry-ground samples exhibiting faster dissolution, faster reagent adsorption, more stable and higher-loaded froths, and faster flotation kinetics based on the difference of their surface features. Chau et al. (2009) also reported that both elongation and smoothness increased the contact angle of talc while roundness and roughness of particles decreased. It has been reported that the contact angle of the surfaces changes by varying the surface roughness, however, there is not any specific trend that can summaries the behavior of wide variety of materials. Buscher et al. (1984) used the polishing and abrasion method to produce different degrees of roughness on more than
24
F. Karakas, B. Vaziri Hassas
10 different polymers. They measured the roughness using profilometry. They concluded that the roughness of less than 100 nm has no effect on the wettability of the surface. Later on other works validated these results explaining that for the surfaces with roughness of less than 100 nm, chemical heterogeneity and the composition is dominant for surface behaviors (Extrand et al. 1997; Eske and Kumagai, 1999). In another work Extrand (2004) explained that the contact angle in rough surfaces is higher due to presence of valleys and gutters. Extrand emphasized that the edges of the water droplet get stuck at these gutters and water cannot penetrate through valleys. Veeramasuneni et al. (1997) also validated that the increase in surface roughness increases the contact angle in hydrophobic surfaces. They investigated the roughness of 6-13 nm on polytetrafluoroethylene which is inherently hydrophobic surface. Chau et al. (2009) concluded that although wetting behavior of liquid-solids interface can be calculated by contact angle measurements, obtaining exact and reproducible values is quite difficult. They argued that this value is very sensitive to other parameters, namely particle shape factor, its surface roughness, heterogeneity, and particle size. Flotation recovery highly depends on the parameters that affect the bubble-particle attachments. Attachment between particle-bubble is commonly described as a “critical” time to occur, which means the minimum time required for attachment. This time is denoted as (τ) and known as induction time. Since the induction time was described based on particle-bubble interactions conventionally, it was assumed that this time should be constant for a given particle-bubble pair (Nguyen and Schulze, 2004). It is however expected that this interaction should depend on other variables such as particle’s size, shape, surface groups, velocity and other factors. Verelli et al. (2012) indicated that τ actually changes upon the particle’s approach trajectory towards bubble surface. Here Davis (1992) findings on particle settling should be taken into account. Davis (1992) described that horizontal position of a falling body with respect to another one (a background sphere) in a dilute suspension is affected by surface roughness of the particles as there is a higher interaction between them. Considering the findings of Davis (1992) and Verelli et al. (2012) one can expect that roughness of particles can have considerable effect on induction time in flotation. The effect of roughness of particles on flotation recovery has been investigated individually and reported that longer detachment force is required to separate the rougher particles from the attached bubbles than that of smoother one. This in turns indicates a stronger adhesion force for bubble-particle peer in rougher surfaces and lower induction time as well (Ahmed, 1999; Ahmed et al. 1999). Furthermore, the effect of surface roughness on contact angle of particles has been investigated and found that rougher glass beads have higher penetration in contact angle measurements using capillary rise method (Dang-Vu, 2006) which means surface roughness has a significant effect on surface properties of particles. Adsorption behavior of HTAB on both smooth and roughened surfaces was investigated by Wu et al. (2011). They reported that adsorption behavior strongly depends on concentration of surfactant with
25
Effect of surface roughness on interaction of particles in flotation
60
900
50
750
40
600
30
450
20
300
10
Roughness, Ra (nm)
Flotation Recovery (%)
regards to its CMC and there are three regions with different characteristics i.e. below, close to, and above CMC regions. Considering the CMC point of 1l0-3 mol/dm3 for HTAB used in this study which has been determined by surface tension method, concentration range of this study is below the CMC point. Wu et al. (2011) suggested that roughness of particles affects not only the amount of surfactant adsorbed, but also the morphology of the adsorbed surfactants aggregates. Furthermore, at this region (below CMC) increasing roughness may lower the surface to be covered with surfactant aggregates i.e. patchy adsorption (some areas of surface are covered by surfactants at higher density, other by lower density of surfactants due to uneven distribution of surfactant molecules). Even more increasing specific surface area may cause much more spreading of surfactant molecules on surface than forming semi micelles which is favorable in flotation. In such a situation the force measured by AFM between these two particles can increase while the flotation rate does not. It is also emphasized that the surfactant aggregates formed on rougher surfaces are less compact and consequently more flexible than those formed on smoother surfaces (Wu et al., 2011). As shown in Fig. 4, flotation recoveries for glass beads increase with increasing roughness of particles. This increment in flotation yield is 12%. It was also found that the roughness of particles increases at prolonged etching time of up to 120-150 s of etching period after which roughness of particles was found to decrease upon further etching time.
150 Flotation Recovery
Roughness
0
0 0
50
100
150
200
250
300
350
Etch Time (sec) -6
Fig. 4. Micro-flotation recovery (at 110 HTAB concentration) and roughness of round glass beads measured by AFM against different etching time. Flotation time was 1 min
Rough particles can attach on bubbles more easily on their notches as they protrude into the bubble decreasing the possibility of bubble-particle detachment. Topological
26
F. Karakas, B. Vaziri Hassas
features on the rough surfaces then expand this three-phase contact line causing dewetting on the surface (Oliver and Mason, 1977; Verelli et al. 2012). Another, maybe the most important feature of rough surfaces, is confining air bubbles to the surface of particles both in micro and nano scale. These air bubbles increase the attachment mechanism due to different phenomena such as “hydrophobic forces” known as long range interactions (Krasowska et al., 2007). Krasowska and Malysa (2007) reported a difference in attachment time for a bubble on a teflon surface with different roughness. They categorized roughness in two groups of asperity, e.g. 1 μm and above 50 μm. Here in this study we can take the former group as roughened surface and the latter as shape factor. They recorded four to five “approach-bounce” cycles at the moment bubble collides with the surface with roughness (below 1 μm) before the attachment. In the case of shape factor (roughness above 50 μm), however, bubble particle attachment always occurred within the first collision without any bouncing at that time. Roughness of particles and thereby flotation recovery increases up to a point after which both start to decrease (Fig. 4). One possible explanation that can be speculated about this phenomenon is that much smoother features forms in longer etching. In bubble-particle attachment the first film rupture is known to be done by sharp and severe parts of particles and roughness of particles is accepted to strengthen the bubble particle attachment. Shape factor is the dominant variable to get the better efficiency followed by the roughness in flotation (Krasowska et al., 2007; Krasowska and Malysa, 2007; Chau et al., 2009). In the former part of etching the roughness of surface increases and causes a boost in flotation recovery. Upon further increase in etching the roughened features becomes smoother and as a result flotation recovery decreases. Colloidal probe atomic force microscope studies Interaction forces between glass beads were measured by averaging 16 of the most representative force curves for each HTAB concentration using mapping property of the instrument. The force was normalized to the radius of the particle attached to the top of the AFM tip. There is an electrostatic repulsion between glass beads without HTAB. Repulsion is also present at low HTAB concentrations; 110-6 mol/dm3 and 510-6 mol/dm3. Addition of 110-5 mol/dm3 HTAB decreased the repulsive forces with further increase caused a snap in and hydrophobic attraction forces were dominant at 1.10-4 mol/dm3 HTAB concentration with a rapid snap in, as shown in approaching force curve of smooth particle in Fig. 5a. On the other hand, repulsive force appeared once more with the excess amount of HTAB. It is clearly seen that repulsive forces dramatically increased with HTAB concentration of 510-4 mol/dm3 and 110-3 mol/dm3. The possible mechanism for this behavior originates from the adsorption form of HTAB onto the glass bead surfaces both at colloidal probe and the surface. At lower concentration (0-510-6 mol/dm3), the surface of the glass beads is partly covered by
Effect of surface roughness on interaction of particles in flotation
27
the surfactant and concentration of HTAB is not enough for providing hydrophobic attraction to overcome the electrostatic repulsion forces caused by double-layer potential. Adsorption form is also dominant in this concentration range. Although perpendicular arrangement of the surfactant with the hydrophobic tails facing towards water at low concentration was also reported in literature (Tyrode, 2008), surfactant molecules may arrange parallel to the surface rather than perpendicular and hydration forces, which overcome the hydrophobic force, coming from dehydration of the ammonium head groups result in repulsion (Luderitz and Klitzing, 2013). Importance of hydration force was also reported by Jinming (2009). He showed that even at very low ion concentration hydration forces exist and these forces hinder the attraction of two silica surface even at close contact. At 1.10-5 mol/dm3 repulsion considerably decreased and attraction was observed at 5.10-5 mol/dm3 HTAB. Monolayer coverage was reached and strong attraction force was observed at 1.10-4 mol/dm3 HTAB concentration. Electrostatic interaction between particle surface and oppositely charged surfactant head group governs this attraction. The zeta potential of the smooth glass bead particles at natural pH (6.2) was measured as -23 mV. The zeta potential of the glass beads particles in the presence of 110-5 mol/dm3 HTAB reversed from -9 mV to +19 mV with 510-5 mol/dm3 HTAB that supports the interaction from repulsive to attractive. The zeta potential values of the particles were obtained as +19 mV and +31 mV for 510-5 mol/dm3 and 110-4 mol/dm3 HTAB, respectively. An increase of zeta potential value with an increasing surfactant concentration indicates an increase in adsorbed amount of surfactant (Luderitz and Klitzing, 2013). Further increase in HTAB concentration made a change on the adsorption form of the surfactant, and bilayer was possibly formed. Positive head group of the HTAB started to retract each other and electrostatic retraction was again dominant at this condition. This mechanism is also shown in the retrace of the force curves. Strong adhesion forces with jump in points were obtained with 510-5 mol/dm3 and 110-4 mol/dm3 HTAB concentration as shown in Fig. 5b. Donose et al. (2007) observed only repulsion between pure silica spheres as a colloidal probe and polished silicon wafers as a surface in solutions of aluminum sulfate. Repulsion still exists with flushing of de-ionized water into the system while after flushing of de-ionized water attraction was occurred for borosilicate glass beads as a colloidal probe and polished silicon wafers as a surface. Luderitz and Klitzing (2013) used the same concentration range of HTAB from 510-6 mol/dm3 to 1.2 mol/dm3 for two different systems: a pair of silica particles and silica particle-silica wafer. They observed repulsive interaction in water for all distance. For the pair of silica particles repulsion was observed from 0 to 510-5 mol/dm3 HTAB. There is no repulsion and only attraction was observed at 510-5 mol/dm3 HTAB concentration. Further increase of concentration caused repulsion again. This trend is also true for the silica particle-silica wafer system but HTAB concentrations for reversing the interaction forces from repulsion to attraction and
28
F. Karakas, B. Vaziri Hassas
attraction to repulsion are different. They explained this difference as different hydrophobicity between silica sphere and silica wafer that may be caused by different cleaning processes. Additionally they showed that different surface charges originating by different adsorption form of HTAB onto silica sphere and silica wafer are responsible for different interaction forces with the same HTAB concentration for these systems. 0.4
Normalized Forece (mN/m)
0.2
0.15
(a)
Normalized Force (mN/m)
0.25
0.3 0.25 0.2 0.15 0.1 0.05 0 -0.05 -0.1
0.3
0
0.02
0.04
0.06
0.08
Normalized Force (mN/m)
Normalized Forece (mN/m)
0.3
0.1
Separation Distance (µm) HTAB Concentration, mol/dm3 0 1.00E-06 1.10-6 5.00E-06 1.00E-05 5.10-6 1.10-5 5.00E-05 1.00E-04 5.10-5 1.10-4 -4 5.00E-04 1.00E-03 5.10 1.10-3
0.1
0.05
0
0.2
0.4 0.3 0.2 0.1 0 -0.1 -0.2 -0.3
(b)
0
0.1
0.05
0.1
HTAB Concentration, mol/dm3
-0.1
-0.2
1.00E-06 1.10-6
5.00E-06 5.10-6
1.00E-05 1.10-5
5.10-5 5.00E-05
1.10-4 1.00E-04
5.10-4
1.10 1.00E-03
5.00E-04
-0.1 0
0.2
0.4
0.6
Separation Distance (µm)
0.8
1
0.2
0
0
-0.05
0.15
Separation Distance (µm)
-3
-0.3 0
0.2
0.4
0.6
0.8
1
Separation Distance (µm)
Fig. 5. Normalized interaction force curves measured for smooth surface in various HTAB concentrations (a) approach (b) retraction
Repulsion at lower concentration range of HTAB, attraction at moderate concentration and repulsion at higher concentration range of HTAB was also observed for the rough glass bead surface, however, attraction force, snap in and jump in started at lower concentration compared to the smooth glass bead surface. As shown in Fig. 6a, monolayer coverage was completed at 510-5 mol/dm3 HTAB, and net attraction force was observed with a strong snap in at this concentration. The increasing HTAB concentration started to change the monolayer coverage to bilayer even if there was still a small snap in at 110-4 mol/dm3 HTAB. This, in contrast, is the optimum concentration for monolayer coverage and highest attraction force for the smooth glass bead surface. Further increase in HTAB caused electrostatic repulsion but not as much as the one obtained with the smooth glass bead. This is again because of the adsorption form of the HTAB. Monolayer and bilayer formed at lower concentration for rough than smooth glass bead surface because of the stronger attraction for adsorption of HTAB on rough surface. Even at 510-6 mol/dm3 and 110-5 mol/dm3 of HTAB concentration there is an adhesion force shown in Fig. 6b that did not exist for smooth surface. Beyond the formation of bilayer, more HTAB was adsorbed on the rough surface and electrostatic repulsion became weaker compared to smooth surface, as shown in Fig. 6a in the case of 510-4 mol/dm3 and 110-3 mol/dm3 of HTAB. This mechanism was clearly shown and supported by the force curves of the rough and
29
Effect of surface roughness on interaction of particles in flotation
smooth particle systems and the micro-flotation experiments explained in previous section. Stronger adsorption affinity of HTAB on the rough glass bead surface than the smooth one is also shown at retrace force curve of the rough glass beads in Fig. 6b. Adhesion and jump in started at even 510-6 mol/dm3. Adhesion energy increased up to 510-5 mol/dm3 HTAB addition. Adhesion energy decreased but still exists at 110-4 mol/dm3 and ceased at further HTAB levels of 510-4 mol/dm3 and 110-3 mol/dm3.
0.15
(a)
0.2
Normalized Force (mN/m)
Normalized Force (mN/m)
0.2
0.5
0.25
0.4
0.15
0.3
0.1
0.05
Normalized Force (mN/m)
Normalized Force (mN/m)
0.25
0 -0.05 0
0.1
0.02
0.04
0.06
0.08
0.1
Separation Distance (µm) HTAB Concentration, mol/dm3 0.05
0
1.10-6 1.00E-06
5.10-6 5.00E-06
1.00E-05 1.10-5
5.10-5 5.00E-05
1.00E-04 1.10-4
5.00E-04 5.10-4
1.00E-03 1.10-3
0.2
0.5 0.4 0.3 0.2 0.1 0 -0.1 -0.2 -0.3 -0.4
(b)
0
0.1
0.02
0.04
0.06
0.08
0.1
Separation Distance (µm) 0
-0.1 HTAB Concentration, mol/dm3 -0.2
0
-0.3
0
1.00E-06 1.10-6
5.00E-06 5.10-6
1.10-5 1.00E-05
5.00E-05 5.10-5
1.10-4 1.00E-04
5.10-4 5.00E-04
1.10 1.00E-03
-3
-0.4
-0.05 0
0.2
0.4
0.6
Separation Distance (µm)
0.8
1
0
0.2
0.4
0.6
0.8
1
Separation Distance (µm)
Fig. 6. Normalized interaction force curves measured for rough surface in various HTAB concentrations (a) approach (b) retraction
It is known that roughness of particles significantly affects adhesion force. Dry and capillary adhesion decreases with nanoscale roughness (Rabinovich et al., 2002). The same finding is also available in our study that shows the dramatic effect of roughness on interaction forces among the particles. Hydrophobic attraction force is long range attraction force in aqueous solutions and there are many studies that identify this long range interaction force starting from the early 1970s. The first direct measurement of this force is reported by Israelachvili and Pashley (1982). There are different sources which can result in long range hydrophobic interactions such as adsorbed surfactant molecules on the surface which render it more hydrophobic. Another possible reason for such interaction can be presence of nanobubles on the surfaces which results in capillary interaction between particles. Tyrrell and Attard (2002) showed that coverage of the surface by nanobubles is close to 100%. They observed a long range attraction between two silica spheres. Addition of ethanol removed the nanobubles that were responsible for long range attraction (Tyrrell and Attard, 2002). In another study, forces between two colloidal silica particles in the presence of HTAB at concentrations between 510-6 mol/dm3 and
30
F. Karakas, B. Vaziri Hassas
1.210-3 mol/dm3 were measured and nanobubles were formed at concentrations up to 510-4 mol/dm3 surfactant concentration. Above this concentration they were flat and less prominent at force measurements of two silica spheres (Luderitz, 2012). Nguyen et al. (2003) argued that solid particles are in contact with air before contact with water and air is trapped in solid surface. Preexisting air at the particle surface is hard to be removed by the liquid and causes the bridging action when particle-bubble interaction in flotation especially for hydrophobic particles. They used glass sphere as a colloidal probe and glass microscope slide as the surface to show the effect of nanobubles on long range hydrophobic attraction force. They made both the probe and the surface hydrophobic by silanation process using trimethylchlorosilane. They observed a long range attractive hydrophobic force in pure water. The magnitude of this force and jump in distance decreases with increasing of ethanol as a medium. Hydrophobic attraction force disappeared in pure ethanol which shows that the origin of hydrophobic attraction is preexisting nanobubles on the hydrophobic particles (Nguyen et al., 2003). In our study, on the other hand, we could not observed the effect of nanobubles on hydrophobic force since there was no long range attraction for both smooth and rough surface without HTAB and hydrophobic attraction started with the addition of HTAB. This indicates that hydrophobicity of the particle is the crucial parameter for preexisting nanobubles on the surface. We used hydrophilic glass beads and hydrophobicity of the particles increased gradually with the addition of HTAB. Therefore, HTAB is the only parameter that governs the hydrophobic attraction in our system. The mechanism for the long range hydrophobic attraction is still controversial for the particulate systems. Nanobubles, long range electrostatic attraction or steric force with existing surfactant or a polymer may cause the long range attraction force. Kekicheff and Spalla (1995) reported that long range attraction between hydrophobic surfaces may have electrostatic origin for silica particles in CTAB solutions.
Conclusions Effect of roughness on flotation recovery and extent of interaction forces between smooth and rough glass bead particles were investigated. Roughness of particles is found to improve the flotation recovery. The highest recovery was obtained with an optimum etching level to induce roughness. Interaction forces for the smooth particles were somewhat higher than that of rough particles as measured by AFM. Interaction forces between glass beads changed from repulsive to attractive with increasing HTAB adsorption. Further increase reversed the interaction from attraction to repulsion again. This change was in accord with the zeta potential measurements and showed the effectiveness of the electrostatic force on interaction potential between glass bead particles in the presence of HTAB. This trend is true for both smooth and rough surfaces. However, the extent of HTAB concentration in breakthrough points
Effect of surface roughness on interaction of particles in flotation
31
(from attraction to repulsion and vice versa) is less in the case of rough particles. This behavior arises probably because of the difference in adsorption form of HTAB on smooth and rough glass beads which reveal the affinity of HTAB towards rough particles. In this investigation, the importance of roughness of particles was shown by direct micro-flotation experiments. Effect of roughness of particles was also elaborated by particle-particle interactions using AFM measurements. These findings can be further improved by AFM and induction time measurements to understand the nature of particle-bubble interactions. Acknowledgements Authors are grateful to Prof. Dr. Mehmet Sabri Celik for his comments and advices on the study. References AHMED, M. M., 2010, Effect of comminution on particle shape and surface roughness and their relation to flotation process, International Journal of Mineral Processing, 94, 180-191. AHMED, M.M., 1999, Fractal surfaces of particles and their floatability, Ph.D. Thesis, Assiut University, Assiut, Egypt. AHMED, M.M., STECHEMESSER, H., MABROUK, S.A., IBRAHIM, G.A., TARSHAN, M.M., 1999, Image analysis technique for determination of the size, structure and texture of fine particle profile, The 6th International Conference on Mining, Petroleum and Metallurgy, Vol. I-B, Mineral Processing, Fac. of Eng., Cairo University, Cairo, Egypt, Feb. 20-24, pp. 40-56, 1999. ALBIJANIC, B., AMINI, E., WIGHTMAN, E., OZDEMIR, O., NGUYEN, A.V., BRADSHAW, D., 2011, A relationship between the bubble–particle attachment time and the mineralogy of a copper– sulphide ore, Minerals Engineering, 24, 1335-1339. ALBIJANIC, B., OZDEMIR, O., NGUYEN, A.V., BRADSHAW, D., 2010, A review of induction and attachment times of wetting thin films between air bubbles and particles and its relevance in the separation of particles by flotation, Advances in Colloid and Interface Science, 159(1), 1-21. NGUYEN, A.V., NALASKOWSKI, J., MILLER, J.D., BUTT, HANS-JURGEN, 2003, Attraction between hydrophobic surfaces studied by atomic force microscopy, International Journal of Mineral Processing, 72, 215-225. ASMATULU, R., 2001, Advanced chemical–mechanical dewatering of fine particles, Ph.D. Thesis, Virginia Polytechnic Institute and State University. ASTON, D.E., BERG, J.C., 2000, Long-range attraction between silanated silica materials studied by an electrolyte titration with atomic force microscopy, Colloids and Surfaces A: Physicochemical and Engineering Aspects, 163, 247-263. BINNIG G., QUATE C., GREBER G., 1986, Atomic force microscope, Physical Review Letters, 56(9), 930-933. BOWEN W.R., HILAL N., LOVITT R.W., WRIGHT C.J., 1999, An atomic force microscopy study of the adhesion of a silica sphere to a silica surface effects of surface cleaning, Colloids and Surfaces A: Physicochemical and Engineering Aspects, 157, 117-125. BUSSCHER, H.J., VAN PELT, A.W.J., DE BOER, P., DE JONG, H.P., ARENDS, J., 1984, The effect of surface roughening of polymers on measured contact angles of liquids, Colloids and Surfaces, 9, 319-31.
32
F. Karakas, B. Vaziri Hassas
CHAU, T.T., BRUCKARD, W.J., KOH, P.T.L., NGUYEN, A.V., 2009, A review of factors that affect contact angle and implications for flotation practice, Advances in Colloid and Interface Science, 150, 106-115. DANG-VU, T., HUPKA, J., DRZYMALA, J., 2006, Impact of roughness on hydrophobicity of articles measured by the Washburn method, Physicochemical Problems of Mineral Processing, 40, 45-52. DAVIS, R.H., 1992, Effects of surface roughness on a sphere sedimenting through a dilute suspension of neutrally buoyant spheres, Physics of Fluids A: Fluid Dynamics (1989-1993), 4, 2607-2619. DONOSE, B., NGUYEN, A.V., EVANS, G.M., YAN, Y., 2007, Effect of aluminium sulphate on interactions between silica surfaces studied by atomic force microscopy, Water Research, 41(15), 3449-3457. DUCKER, W.A., SENDEN, T.J., PASHLEY, R.M., 1991, Direct measurement of colloidal forces using an atomic force microscope. Nature, 353, 6341, 239-241. DUCKER, W.A., SENDEN, T.J., PASHLEY, R.M., 1992, Measurement of forces in liquids using a force microscope, Langmuir, 8(7), 1831-1836. ERAYDIN, M.K., 2009, Scale-up of using novel dewatering aids, Ph.D. Thesis, Virginia Polytechnic Institute and State University. ESKE, L.D., GALIPEAU, D.W., 1999, Characterization of SiO2 surface treatments using AFM, contact angles and a novel dewpoint technique, Colloids and Surfaces A: Physicochemical and Engineering Aspects, 154, 33–51. EXTRAND, C.W., 2004, Criteria for ultrahydrophobic surfaces, Langmuir, 20, 5013-18. EXTRAND, C.W., KUMAGAI, Y., 1997, An experimental study of contact angle hysteresis, Journal of Colloid Interface Science, 191, 378-83. FENG, D., ALDRICH, C., 2000, A comparison of the flotation of ore from the Merensky Reef after wet and dry grinding, International Journal of Mineral Processing, 60(2), 115-129. GUVEN, O, OZDEMIR, O, KARAAGACLIOGLU, I.E, CELIK, M.S., 2015, Surface morphologies and floatability of sand blasted 1 quartz particles, Minerals Engineering, 70, 1-7. HICYILMAZ, C., ULUSOY, U., YEKELER, M., 2004, Effects of the shape properties of talc and quartz particles on the wettability based separation processes, Applied Surface Science, 233, 204-212. HOWARD, S.C. and CRAIG, V.S.J., 2009, Adsorption of the cationic surfactant cetyltrimethylammonium bromide to silica in the presence of sodium salicylate: Surface excess and kinetics, Langmuir, 25(22), 13015-13024. ISRAELACHVILI, J., PASHLEY, R., 1982, The long-range hydrophobic interaction decaying exponentially with distance, Nature, 300, 5890, 341. JINMING D., 2009, Interfacial forces between silica surfaces measured by atomic force microscopy, Journal of Environmental Sciences, 21, 30-34. KEKICHEFF P, SPALLA O., 1995, Long-range electrostatic attraction between similar, charge-neutral walls, Physical Review Letters, 75, 1851-1854. KOH, P.T.L., HAO, F.P., SMITH, L.K., CHAU, T.T., BRUCKARD, W.J., 2009, The effect of particle shape and hydrophobicity in flotation, International Journal of Mineral Processing, 93, 128-134. KRASOWSKA, M, KRASTEV, R, ROGALSKI, M, MALYSA, K, 2007, Air-facilitated three-phase contact formation at hydrophobic solid surfaces under dynamic conditions, Langmuir, 23(2), 549557. KRASOWSKA, M., MALYSA, K., 2007, Kinetics of bubble collision and attachment to hydrophobic solids: I. Effect of surface roughness, International Journal of Mineral Processing, 81(4), 205-216. LIU, J., XU, Z., MASLIYAH, J., 2003, Studies on bitumen-silica interaction in aqueous solutions by Atomic Force Microscopy, Langmuir, 19, 3911-3920.
Effect of surface roughness on interaction of particles in flotation
33
LUDERITZ, L.A.C., 2012, An AFM study of the interactions between colloidal particles, Ph.D. thesis, Technische Universitat Berlin. LUDERITZ, L.A.C., KLITZING, R.V., 2013, Interaction forces between silica surfaces in cationic surfactant solutions: An atomic force microscopy study, Journal of Colloid and Interface Science, 402, 19-26. NGUYEN, A.V., NALASKOWSKI, J., MILLER, J.D., 2003, A study of bubble–particle interaction using atomic force microscopy, Minerals Engineering 16, 1173-1181. NGUYEN, A.V., SCHULZE, H.J., 2004, Colloidal Science of Flotation, Marcel Dekker: New York, U.S.A. OLIVER, J.F., MASON, S.G., 1977, Microspreading studies on rough surfaces by scanning electron microscopy, Journal of Colloid and Interface Science, 60(3), 480-487. RABINOVICH Y.I., ADLER J.J., ESAYANUR M.S., ATA A., SINGH R.J., MOUDGIL B.M., 2002, Capillary forces between surfaces with nanoscale roughness, Advances in Colloid and Interface Science, 96, 213-230. RALSTON, J., FORNASIERO, D., HAYES, R., 1999, Bubble–particle attachment and detachment in flotation, International Journal of Mineral Processing, 56(1-4), 133-164. SADER, J.E., CHON, J.W.M., MULVANEY, P., 1999, Calibration of rectangular atomic force microscope cantilevers, Review of Scientific Instruments, 70(10), 3967-3969. TYRODE, E.C., RUTLAND, M.W., BAIN, C.D., 2008, Adsorption of CTAB on hydrophilic silica studied by linear and nonlinear optical spectroscopy, Journal of American Chemical Society, 130, 17434-17445. TYRRELL, J.W.G., ATTARD, P., 2002, Atomic force microscope images of nanobubbles on a hydrophobic surface and corresponding force-separation data, Langmuir, 18, 160-167. ULUSOY, U., YEKELER, M., 2005, Correlation of the surface roughness of some industrial minerals with their wettability parameters, Chemical Engineering and Processing, 44, 557-565. VEERAMASUNENI, S., DRELICH, J., MILLER, J.D., YAMAUCHI, G., 1997, Hydrophobicity of ionplated PTFE coatings, Progress in Organic Coatings, 31, 265-70. VERRELLI, D.I., BRUCKARD, W.J., KOH, P.T.L., SCHWARZ, M.P., FOLLINK, B., 2014, Particle shape effects in flotation. Part 1: Microscale experimental observations, Minerals Engineering, 58, 80-89. VERRELLI, D.I., BRUCKARD, W.J., KOH, P.T.L., Schwarz, M.P., Follink, B., 2012, Influence of Particle Shape and Roughness on the Induction Period for Particle–Bubble Attachment, 26th International Mineral Processing Congress (IMPC-XXVI), New Delhi, India, 24 - 28 September. VERRELLI, D.I., KOH P.T.L., NGUYEN, A.V., 2011, Particle–bubble interaction and attachment in flotation, Chemical Engineering Science, 66, 5910-5921. VIDYADHAR, A., HANUMANTHA RAO, K., CHERNYSHOVA, I. V., PRADIP, FORSSBERG, K. S. E. 2001, Mechanisms of amine–quartz interaction in the absence and presence of alcohols studied by spectroscopic methods, Journal of Colloid and Interface Science, 256, 59-72. VAZIRI HASSAS, B., KARAKAS, F., CELIK, M.S., 2014, Ultrafine coal dewatering: Relationship between hydrophilic lipophilic balance (HLB) of surfactants and coal rank, International Journal of Mineral Processing, 133, 97-104. WANG, W., ZHOU, Z., NANDAKUMAR, K., MASLIYAH, J.H., XU, Z., 2005, An induction time model for the attachment of an air bubble to a hydrophobic sphere in aqueous solutions, International Journal of Mineral Processing, 75, 69-82.
34
F. Karakas, B. Vaziri Hassas
WANG, Y., WANG, L., HAMPTON, M.A., NGUYEN, A.V., 2013, Atomic force microscopy study of forces between a silica sphere and an oxidized silicon wafer in aqueous solutions of NaCl, KCl, and CsCl at concentrations up to saturation, The Journal of Physical Chemistry, 117, 2113-2120. WU, S., SHI, L., GARFIELD, L.B., TABOR, R.F., STRIOLO, A., GRADY, B.P., 2011, Influence of surface roughness on cetyltrimethylammonium bromide adsorption from aqueous solution, Langmuir, 27, 6091-6098. YEKELER, M., ULUSOY, U., HICYILMAZ, C., 2004, Effect of particle shape and roughness of talc mineral ground by different mills on the wettability and floatability, Powder Technology, 140(1-2), 68-78.