Dec 10, 2018 - coupling has been confirmed in this system at the atomic ... cal compositions x = xC1 and (ii) from cubic-like symmetry to ... In method-I, Bi2O3, Fe2O3, and BaTiO3 were taken as the .... with PbTiO3 (PT).33 The peak in ε. 0.
JOURNAL OF APPLIED PHYSICS 124, 224101 (2018)
Effect of synthesis route on structure and dielectric properties of (1-x)BiFeO3-xBaTiO3 solid solutions and its phase diagram Anar Singh,1,2,a) Arun Kumar,2 and Dhananjai Pandey2
1
Department of Physics, University of Lucknow, Lucknow 226007, India School of Materials Science and Technology, Indian Institute of Technology (Banaras Hindu University), Varanasi 221005, India 2
(Received 6 June 2018; accepted 20 November 2018; published online 10 December 2018) We present here a comparative study of structure, surface morphology, composition analysis, and dielectric properties of (1-x)BiFeO3-xBaTiO3 (BF-xBT) solid solutions, synthesized by two different solid state reaction routes reported in the literature. The results of structural and dielectric studies suggest that BF-xBT ceramics synthesized using BaTiO3, Bi2O3, and Fe2O3 (method-I) as initial ingredients are not monophasic for 0.50 < x < 0.80. In this composition range, we observe the phase coexistence of tetragonal and rhombohedral/pseudocubic phases. The ferroelectric Curie temperature (TC ∼ 400 K) of this tetragonal phase corresponds to the TC of BaTiO3. Composition analysis of these ceramics also confirms the presence of BaTiO3-rich phase. These observations suggest that BaTiO3 does not react completely with Bi2O3 and Fe2O3 when synthesized by method-I. In marked contrast, the BF-xBT solid solutions synthesized by method-II using Bi2O3, Fe2O3, BaCO3, and TiO2 as initial ingredients are compositionally homogeneous and single phase in the entire composition range (0 < x ≤ 1). The average atomic percentage of Bi, Fe, Ba, and Ti for BF-xBT ceramics synthesized by method-II, as obtained from energy dispersive x-ray spectroscopy, is close to the nominal composition within ±2%. Structural and dielectric studies do not reveal any signature of the coexistence of phases in these samples. Using the results of structural and dielectric studies, we also present a new and updated phase diagram of BF-xBT synthesized by method-II. Published by AIP Publishing. https://doi.org/10.1063/1.5043164
I. INTRODUCTION
In the past decade, multiferroic compounds have attracted enormous attention due to the fundamental scientific challenges they pose and the potential they hold for cutting edge technological applications, such as low power spintronic devices, spin valves, sensor, and actuators.1–5 In this context, BiFeO3 is a promising room temperature multiferroic with ferroelectric (TC ∼ 1103 K) and magnetic (TN ∼ 643 K) ordering stable well above room temperature.6,7 Bulk BiFeO3 has a rhombohedral structure in the R3c space group at room temperature.8 It exhibits a canted G-type antiferromagnetic structure with a superimposed long range spiral spin structure of an approximate periodicity of 620 Å.9 The presence of spiral spin structure cancels the net macroscopic magnetization due to spin canting and hence inhibits linear magnetoelectric (ME) coupling in pure BiFeO3.10 In order to reveal the full potential of BiFeO3 as a multiferroic with linear magnetoelectric coupling, solid solutions with other oxide perovskites have been proposed.11–15 Among them, the (1-x) BiFeO3-xBaTiO3 (BF-xBT) system has shown improved multiferroic properties.16,17 Furthermore, linear magnetoelectric coupling has been confirmed in this system at the atomic level.12,18 More interestingly, the BF-xBT system has emerged as a potential eco-friendly substitute to toxic piezoelectric ceramics containing lead (Pb) elements like (1-x)
a)
Author to whom correspondence should be addressed: singhanar@ gmail.com
0021-8979/2018/124(22)/224101/9/$30.00
Pb(Mg1/3Nb2/3)O3-xPbTiO3 (PMN-xPT) and Pb(ZrxTi1-x)O3 (PZT).19 The high ferroelectric transition temperature of BF-xBT solid solutions makes it very attractive for applications as high temperature piezoelectric with depoling temperature much higher than the existing Pb-based commercial piezoelectric ceramics.17 In addition, relaxor ferroelectric (RFE) behavior has also been reported in a BF-xBT system.20 Interestingly, the onset of relaxor ferroelectric behavior in the BF-xBT system occurs at a composition which corresponds to nearly 65 mol. % and 35 mol. % of BiFeO3 and BaTiO3, respectively, which is close to the 2:1 ratio of Nb5+ and Mg2+ in the canonical ferroelectric relaxor Pb(Mg1/3Nb2/3)O3 (PMN).21 Despite extensive experimental and theoretical studies, the crystal structure of the BF-xBT system at room temperature has been controversial. The temperature dependent phase diagram is also under debate. In the existing literature, two distinct pictures have been proposed for the crossover from BiFeO3 like behavior to BaTiO3 like behavior. In one of these scenarios, the BF-xBT system exhibits two composition induced structural changes at room temperature: (i) from rhombohedral symmetry with the R3c space group to cubic-like symmetry with the Pm3m space group at the critical compositions x = xC1 and (ii) from cubic-like symmetry to the tetragonal symmetry with the P4mm space group at x = xC2.22–25 The critical compositions corresponding to these structural boundaries have been controversial with values of xC1 and xC2 reported to vary in the range of 0.24 to 0.35 and 0.06 to 0.15, respectively.22–25 One of the possible reasons 124, 224101-1
Published by AIP Publishing.
224101-2
Singh, Kumar, and Pandey
for such a large disagreement (Δx ∼ 0.1) in the values of xC1 and xC2 reported by different workers is composition fluctuations caused by the loss of Bi2O3 during the heat treatments. The loss of Bi2O3 leads to the formation of impurity phases and disturbs the overall stoichiometry of the BiFeO3-based phase.26 In the second scenario, the structure of BF-xBT is rhombohedral (R3c space group) for x < xC3 (xC3 varies from 0.10 to 0.20)27,28 and tetragonal (P4mm space group) for x > xC4 (xC4 ∼ 0.85)27 whereas in the composition range xC3 < x < xC4, there is coexistence of two phases.27,28 The present investigation was undertaken to understand the role of the synthesis route in the controversies about the room temperature structure of the BF-xBT system in different composition regimes. For this, we have prepared BF-xBT ceramics by the solid state reaction route using two different methods employed by earlier workers. In method-I, Bi2O3, Fe2O3, and BaTiO3 powders were used as starting ingredients, whereas in the second method (method-II), Bi2O3, Fe2O3, BaCO3, and TiO2 were the initial ingredients. We present the details of structural and dielectric studies on BF-xBT solid solutions synthesized by these two different methods. We show that the temperature dependence of dielectric permittivity for several compositions of BF-xBT, synthesized by method-I, exhibits a peak at ∼ 400 K corresponding to the ferroelectric TC of pure BaTiO3. This indicates that in method-I, the starting ingredient BaTiO3 powder does not completely react with the other reactants (Bi2O3 and Fe2O3) during calcination and sintering. Rietveld analysis of x-ray diffraction (XRD) data and composition analysis of these BF-xBT ceramics also confirm the presence of un-reacted BaTiO3. In contrast to this, BF-xBT synthesized by method-II using Bi2O3, Fe2O3, BaCO3, and TiO2 as initial ingredients is found to be homogeneous and single phase. We do not observe any evidence for the presence of BaTiO3 phase in BF-xBT prepared by method-II. The average atomic percentage of Bi, Fe, Ba, and Ti for BF-xBT ceramics synthesized by method-II, as obtained from energy dispersive x-ray (EDX) spectroscopy, is close to the nominal composition within ±2%. These studies enabled us to construct a new and updated phase diagram of BF-xBT at room temperature and above. II. EXPERIMENTAL
BF-xBT solid solutions were synthesized through a conventional solid state reaction route by two different methods. In method-I, Bi2O3, Fe2O3, and BaTiO3 were taken as the initial raw ingredients. In method-II, BaTiO3 was replaced by BaCO3 and TiO2 powders.26,29 All the ingredients were of purity ≥99%. In both methods, reactant species in stoichiometric ratio were thoroughly mixed in an agate mortar pestle in the presence of acetone for 2-3 h. The mixtures were then ball milled (Retsch GmbH & Rheinische, Germany) for 6 h using zirconia jars and zirconia balls with acetone as the mixing media. After proper mixing, the mixture was dried and then calcined at different temperatures for 8 h in alumina crucibles using a globar furnace. After calcination, the powders were first ball milled in the presence of acetone as mixing media for 1 h to break the agglomerates. The ball milled powders were then dried and mixed 2% polyvinyl
J. Appl. Phys. 124, 224101 (2018)
alcohol (PVA) solution, used as the organic binder, in an agate mortar. A cylindrical steel die of 12 mm diameter was used to make green pellets of BF-xBT. Before sintering, the green pellets were kept on an alumina plate at 773 K for 10 h to burn off the binder material (PVA). Sintering of the PVA evaporated pellets was carried out in a closed alumina crucible sealed with MgO powder. To control the loss of Bi2O3, a suitable amount of the calcined powder of the same composition was kept inside the closed alumina crucible as a spacer powder. Sintering temperature and sintering time were properly optimized to get the maximum possible density. For powder diffraction experiments, the sintered pellets were crushed to fine powder and subsequently annealed at 773 K for 10 h to remove the strains introduced, if any, during crushing. X-ray diffraction (XRD) measurements were carried out using an 18 kW rotating anode (CuKα) based Rigaku (RINT 2000/PC series) powder diffractometer operating in the Bragg-Brentano geometry and fitted with a graphite monochromator in the diffracted beam. The data were collected in the 2θ range of 20° to 120° at a step of 0.02°. The XRD data were analyzed with the Rietveld technique using FULLPROF software package.30 Temperature dependent dielectric measurements above room temperature were carried out using a home-made high temperature measurement setup attached with Novocontrol (Alpha-A) High Performance Frequency Analyser and a programmable temperature controller (Eurotherm 2416). Microstructural characterizations were carried out using a field emission gun based scanning electron microscope (FE-SEM) (Zeiss, Germany). The sintered pellets were coated with a conducting gold film by sputtering under vacuum before recording SEM pictures. Composition analysis was carried out by energy dispersive x-ray (EDX) attachment. III. RESULTS AND DISCUSSION A. Structural and dielectric studies 1. BF-xBT synthesized by method-I
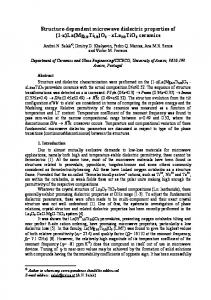
Figure 1(a) depicts the temperature dependence of the real part of the dielectric permittivity [ε0 (T)] of BF-xBT prepared by method-I for x = 1.0, 0.90, 0.80, 0.70, and 0.60 measured at various frequencies (ω = 2πf, where f = 100, 300, 500, 700, and 1000 kHz). It is evident from this figure that the temperature dependence of dielectric permittivity at different frequencies [ε0 (ω,T)] of BF-xBT shows a peak at 400(5) K corresponding to the ferroelectric TC of pure BaTiO3. The position of this peak is almost independent of x and ω whereas its height decreases with decreasing concentration of BaTiO3 (x). For x ≤ 0.80, a new diffuse peak with considerable dispersion in the ε0 (ω,T) appears about 200 K above the TC of BaTiO3. For x = 0.70 and 0.80, the temperature [T0 max(ω)] corresponding to a diffuse peak in the ε0 (ω,T) shifts toward the high temperature side with increasing frequency. The shift in T0 max(ω) with frequency is one of the characteristics of relaxor ferroelectrics.31 The frequency dependence of T0 max for these two compositions was analyzed by considering both the Arrhenius {τ = τ0 exp (Ea/kT)} and Vogel-Fulcher type relaxational freezing {[τ = τ0 exp
224101-3
Singh, Kumar, and Pandey
J. Appl. Phys. 124, 224101 (2018)
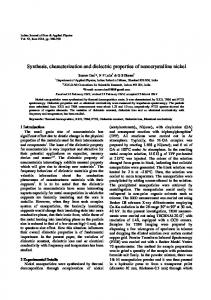
FIG. 2. Variation of relaxation time (τ) with temperature for Arrhenius and Vogel-Fulcher (insets) type relaxational freezing in BF-xBT synthesized by method-I for (a) x = 0.70 and (b) 0.80.
FIG. 1. Temperature dependence of real (ε0 ) part of dielectric permittivity of BF-xBT, synthesized by (a) method-I and (b) method-II, at various frequencies.
[Ea/k(T − TVF)]}, where Ea is the activation energy for thermally activated jump of polar clusters, τ0 is the inverse of the attempt frequency, k is the Boltzmann constant, and TVF is the Vogel-Fulcher freezing temperature. The variation of lnτ as a function of temperature for the Arrhenius and Vogel-Fulcher type freezing behaviors for the two compositions (x = 0.80 and 0.70) is shown in Fig. 2. It is evident from the plots in this figure that the Arrhenius type freezing can be ruled out for both the compositions as lnτ versus 1/T is not linear. The Vogel-Fulcher freezing gives an excellent linear fit as can be seen in insets of Fig. 2. The VogelFulcher freezing temperature was taken as the temperature which gives the minimum variance for the fit between lnτ versus 1/(T − TVF).32 Unlike x = 0.70 and 0.80, the T0 max [∼520(5) K] for x = 0.60 is nearly independent of frequency, even though there is considerable dispersion in ε0 (ω,T). The diffuse peak in BF-xBT for x = 0.60 is thus of non-relaxor ferroelectric (NRFE) type diffuse transitions similar to that reported in Pb(Fe1/2Nb1/2)O3 (PFN) and its solid solutions with PbTiO3 (PT).33 The peak in ε0 (ω,T) at 400(5) K for x = 0.90, 0.80, 0.70, and 0.60 is due to un-reacted BaTiO3 in BF-xBT solid solution samples prepared by method-I. The second peak in ε0 (ω,T) for x = 0.80, 0.70, and 0.60 suggests
the formation of BF-xBT solid solution phase, which coexists with BaTiO3. For studying the room temperature crystal structure of BF-xBT synthesized by method-I as a function of composition (x), we first present a qualitative interpretation of the x-ray powder diffraction profiles. Figure 3 shows the XRD profiles of the 111pc, 200pc, and 220pc pseudocubic ( pc) reflections after stripping off the CuKα2 contribution for various BF-xBT samples in the composition range 0.60 ≤ x ≤ 1.0. The proposed crystal structures of BF-xBT ceramics at room temperature are tetragonal in the P4mm space group, rhombohedral in the R3c/R3m space group, and cubic in the Pm3m space group for different composition regimes.23–25,34 For the rhombohedral structure (R3c or R3m space group), the 200pc should be a singlet while 111pc and 220pc are doublets with weaker reflections (11�1 and 2�20) on the lower 2θ side of the stronger reflection. Unlike the rhombohedral phase, the 111pc reflection is a singlet in the tetragonal phase and 200pc is a doublet. The 220pc pseudocubic peak is also a doublet for the tetragonal phase but the weaker reflection 220 occurs on the higher 2θ side of the stronger peak 202. For the cubic Pm3m space group, the 111pc, 200pc, and 220pc profiles are singlets. It is evident from Fig. 3 that for x ≥ 0.90, 111pc reflection is a singlet while 200pc and 220pc reflections are doublets. All these features correspond to the tetragonal structure with the space group P4mm. For x ≤ 0.80, in addition to peaks corresponding to the tetragonal phase, new peaks appear in the 111pc profile. These peaks are marked with arrows in Fig. 3. For 0.70 ≤ x ≤ 0.80, only one new peak is visible on the higher 2θ side of the 111pc profile. The
224101-4
Singh, Kumar, and Pandey
FIG. 3. Evolution of 111pc, 200pc, and 220pc XRD profiles for various compositions of BF-xBT synthesized by method-I with x = 1.0, 0.90, 0.80, 0.70, and 0.60 at room temperature. Arrows indicate the reflections corresponding to the phases other than tetragonal.
intensity of this peak increases with decreasing BaTiO3 content (x). At x = 0.60, another peak appears on the lower 2θ side of the 111pc profile (see Fig. 3). These observations suggest that a cubic-like phase appears in coexistence with the tetragonal phase for x < 0.90. At x ∼ 0.60, this cubic-like phase transforms to a rhombohedral phase. In order to confirm the above qualitative observations, we carried out Rietveld analysis of XRD data. The details of Rietveld refinements are given in the supplementary material. Figure 4 depicts the observed, calculated, and difference profiles obtained after the Rietveld analysis of the full XRD pattern for x = 0.90 using the P4mm space group. The overall fit between the observed and calculated profiles is very good, with nearly flat difference profiles. For x = 0.70, we have
FIG. 4. Observed (circles), calculated (line), and difference (bottom line) profiles obtained after Rietveld refinement of BF-0.90BT prepared by method-I at room temperature using the P4mm space group. The vertical tick marks correspond to the positions of the Bragg reflections. Inset to the figure shows the profile fitting for the 111pc, 200pc, and 220pc peaks.
J. Appl. Phys. 124, 224101 (2018)
considered two possible models P4mm and P4mm + Pm3m space groups. It is evident from insets of Fig. 5(a) that the observed intensity in the higher 2θ angle region of the 111pc profile is completely missed by the P4mm space group. It also fails to model the 200pc and 220pc profiles adequately. The P4mm + Pm3m space group gives a satisfactory fit between the observed and calculated data for all the reflections [see inset of Fig. 5(b)]. The lower R-factors and χ2 values favor P4mm + Pm3m space groups. The phase fractions of the tetragonal and cubic phases are 27(2)% and 73(3)%, respectively. For x = 0.60, we have considered P4mm + Pm3m, R3m + Pm3m, and R3m + P4mm space groups. Among the three models, R3m + P4mm space groups give satisfactory results (see Fig. 6). The R3m space group has been taken into consideration, instead of R3c, because of the absence of superlattice “ooo” type reflections (1/2 1/2 1/2) in the XRD pattern. It is well known that x-rays are less sensitive to capture such superlattice reflections that appear due to tilting of octahedra about the trigonal [111]pc axis of the rhombohedral phase. It is, therefore, rather hard to distinguish between R3c and R3m space groups of BF-xBT using laboratory XRD data. From the foregoing, we conclude that the BF-xBT sample prepared by method-I shows tetragonal, tetragonal + cubic-like, and tetragonal + rhombohedral phases for x ≥ 0.90, 0.70 ≤ x ≤ 0.80, and x = 0.60, respectively. The variation of the elementary perovskite cell parameters of BF-xBT in the composition range 0.60 ≤ x ≤ 1.0 is shown in Fig. 7(a). The important finding is that the tetragonal phase of BaTiO3 persists even up to x = 0.60 in BF-xBT samples prepared by method-I. With decreasing concentration of BaTiO3, a cubic-like phase with the Pm3m space group appears in coexistence with the tetragonal phase around x = 0.80. The phase fraction of cubic phase
FIG. 5. Observed (circles), calculated (line), and difference (bottom line) profiles obtained after Rietveld refinement of BF-0.70BT for samples prepared by method-I at room temperature using (a) P4mm and (b) P4mm + Pm3m space groups. The vertical tick marks correspond to the positions of the Bragg reflections. Inset to the figure shows the profile fitting for the 111pc, 200pc, and 220pc peaks.
224101-5
Singh, Kumar, and Pandey
FIG. 6. Observed (circles), calculated (line), and difference (bottom line) profiles obtained after Rietveld refinement of BF-0.60BT for samples prepared by method-I at room temperature using (a) P4mm, (b) P4mm + Pm3m, and (c) P4mm + R3m space groups. The vertical tick marks correspond to the positions of the Bragg reflections. Inset to the figure shows the profile fitting for the 111pc, 200pc, and 220pc peaks.
increases with decreasing x. This cubic phase eventually transforms to a rhombohedral phase with the R3m space group around x = 0.60. The results of Rietveld analysis for selected compositions of BF-xBT, synthesized by method-I are given in Table S1 of the supplementary material. 2. BF-xBT synthesized by method-II 0
Figure 1(b) depicts the ε (ω,T) of BF-xBT prepared by method-II for selected compositions with x = 0.94, 0.90, 0.80, 0.70, and 0.60 measured at various frequencies in the
J. Appl. Phys. 124, 224101 (2018)
range 100 kHz to 1 MHz. While pure BaTiO3 shows a sharp anomaly in ε0 (ω,T) corresponding to the ferroelectric phase transition, the ε0 (ω,T) response of BF-xBT is smeared out due to BiFeO3 substitution. The diffuseness of ε0 (ω,T) response increases with increasing concentration of BiFeO3. Such a smeared ε0 (ω,T) response has been reported in relaxor ferroelectrics.21 However, the diffuse phase transition (DPT) in BF-xBT for x ≥ 0.60 is not due to relaxor ferroelectric freezing as T0 max is independent of frequency. The details of the DPT in the BF-xBT system are discussed elsewhere for such samples.29 Unlike BF-xBT synthesized by method-I, the position of the peak in ε0 (ω,T) deviates from 400 K with increasing x. In addition, we do not observe any evidence for the coexistence of two phases in the structural studies on BF-xBT synthesized by method-II (see Refs. 22 and 29). For the BF-xBT samples with 0.60 ≤ x ≤ 0.80), ε0 (ω,T) increases at high temperatures, especially at low frequencies, due to an increase in the conductivity.22 The conductive losses mask the peak in ε0 (ω,T) for x = 0.70 and 0.60 [see Fig. 1(b)]. Rietveld analysis of XRD data reveals that tetragonality of BaTiO3 decreases with increasing concentration of BiFeO3 in BF-xBT [see Fig. 7(b)]. At x = 0.85, the tetragonal phase (P4mm space group) transforms to an average cubic structure (Pm3m space group). The results of Rietveld analysis of the XRD data of BF-xBT for x = 0.70 and 0.90 are given in Table S1 of the supplementary material. Recently, we have also shown that the average cubic symmetry of BF-xBT is broken locally by the off-centering of Bi3+ [∼56(1) Å for x = 0.40] with respect to Ba2+ at the perovskite cube corners in the [xxz] direction.16,22 The random-site dipoles associated with the off-centered Bi ions show relaxational freezing for 0.36 ≤ x ≤ 0.50.20 On increasing BaTiO3 content (x) beyond x ∼ 0.60, dipoles associated with Bi3+ off-centering freeze cooperatively with an exponent β = 1/4 corresponding to a tricritical transition. Thus, the samples prepared by method-II exhibit non-relaxor ferroelectric (NRFE) type DPT for 0.60 ≤ x ≤ 0.85.22,29 B. Microstructure and composition analysis
SEM study was carried out on the sintered pellets to examine the microstructure and the grain size distribution in BF-xBT ceramics prepared by the two methods. EDX was utilized to determine the chemical composition of the BF-xBT ceramics synthesized by the two methods. 1. BF-xBT synthesized by method-I
FIG. 7. Composition dependence of lattice parameters of BF-xBT for samples synthesized using (a) Bi2O3, Fe2O3 and BaTiO3 (method-I) and (b) BaCO3, TiO2, Bi2O3, and Fe2O3 (method-II). The lattice parameters shown in figure (b) are taken from Fig. 5(a) of Ref. 22.
Figure 8 depicts SEM micrographs of BF-xBT for x = 0.60 and 0.70. These compositions correspond to the phase coexistence region. The surface morphology is almost the same for both compositions. It consists of very large grains and also much smaller grains. The size of the grains varies from 0.15(4) to 2.0(1) μm. The pores between the grains can also be clearly seen in the micrographs. A careful composition analysis of BF-0.70BT ceramic in different regions reveals the presence of BaTiO3-rich and BiFeO3-rich phases (see Table S2 and Fig. S1 of the supplementary material). The presence of BaTiO3-rich phase in BF-xBT indicates that BaTiO3 does not completely
224101-6
Singh, Kumar, and Pandey
J. Appl. Phys. 124, 224101 (2018)
FIG. 8. SEM micrographs of BF-xBT ceramics prepared by method-I: (a) x = 0.60 and (b) x = 0.70.
react with Bi2O3 and Fe2O3. It supports our finding of structural and dielectric studies. 2. BF-xBT synthesized by method-II
Figure 9 depicts the SEM micrographs of BF-xBT ceramics for three selected compositions, x = 0.10, 0.50, and 0.96, corresponding to the BiFeO3-rich end, equimolar concentration, and the BaTiO3-rich end, respectively. It can be clearly seen from this figure that the ceramics are quite dense for x = 0.10, but the porosity increases with increasing concentration of BaTiO3. The average grain sizes of BF-xBT ceramics for x = 0.10, 0.50, and 0.96 are approximately 1.6(1), 1.8(1), and 2.1(3) μm, respectively. The average grain size was found to grow with increasing x. This increase in grain size may be linked with the high sintering temperature for larger x. It was also noticed that the grain growth at the BaTiO3-rich end (x = 0.96) is more irregular as compared to the compositions at the BiFeO3-rich end. This irregular grain growth increases the porosity in ceramics as can be seen in the SEM micrographs [see Fig. 9(c)]. EDX spectra of BF-xBT ceramics for the above mentioned compositions are shown in Fig. S2 of the supplementary material. The differences in the observed and calculated average atomic percentage of Bi, Fe, Ba, and Ti for BF-xBT samples synthesized by method-II are less than 2% (see Table S3 of the supplementary material). C. Comparison of these two methods: Difficulties in method-I
A peak in the dielectric permittivity corresponding to the ferroelectric TC ∼ 400 K (5) of the pure BaTiO3 for all the four compositions of BF-xBT (x = 0.90, 0.80, 0.70, and
FIG. 9. SEM micrographs of BF-xBT ceramics prepared by method-II: (a) x = 0.10, (b) x = 0.50, and (c) x = 0.96.
0.60), synthesized by method-I, indicates the presence of the tetragonal phase of BaTiO3 in such samples of BF-xBT solid solutions. The variation of tetragonal cell parameters with the composition for 0.60 ≤ x ≤ 1.0 in Fig. 7(a) reveals that BaTiO3 partly reacts with Bi2O3 and Fe2O3. As a result of which, we observe the coexistence of two phases over a wide composition range, where the tetragonal phase of BaTiO3 co-exists with rhombohedral or cubic-like phase. One of the possible reasons could be that the calcination temperatures are not enough to ensure diffusion of Bi2O3 and Fe2O3 in BaTiO3 for giving homogeneous BF-xBT solid solutions using BaTiO3. We therefore increased the calcination temperature as well as the duration in three steps followed by intermediate mixing and milling, though the loss of Bi2O3 at such high temperatures (>1150 K) is hard to control. Figure 10 depicts the XRD patterns of BF-0.50BT (equimolar concentration of BaTiO3 and BiFeO3) obtained after the heat treatment in the subsequent steps. The decrease in the splitting of the reflections with increasing calcination temperature indicates that BaTiO3 is forming solid solutions with BiFeO3. However, even after the third calcination cycle, the profiles of the 111pc, 200pc, and 210pc reflections are asymmetric
224101-7
Singh, Kumar, and Pandey
J. Appl. Phys. 124, 224101 (2018)
more challenging and we therefore carried out sintering in closed atmosphere with sufficient Bi2O3 vapour pressure. Interestingly, the BF-xBT samples are all free of impurity phases like Bi2Fe4O9, Bi25FeO39, and Bi36Fe2O57, which are almost unavoidable in pure BiFeO3. This indicates that the thermodynamics of phase formation in the pseudoquaternary system Bi2O3-F2O3-TiO2-BaO may be different from that in the binary Bi2O3-Fe2O3 system and a simple extrapolation of the reaction temperatures of BiFeO3 and BaTiO3 may not hold good for the homogeneous BF-xBT system. More work is required to understand the thermodynamics of various reactions in the pseudo-quaternary system. FIG. 10. The XRD patterns (after removal of Kα2 contribution) of BF-0.50BT powders obtained after different calcination cycles using Bi2O3, Fe2O3, and BaTiO3 as starting ingredients (method-I). Insets of the figure depict the profiles of the 111pc, 200pc, and 210pc peaks on a zoomed scale. Arrows indicate the asymmetry in the profile of these peaks.
(see insets of Fig. 10). The asymmetry in the profiles of these reflections is due to the presence of more than one phase indicating the limitations of method-I. On the other hand, homogeneous and single phase BF-xBT solid solutions can be synthesized by method-II in a single step in the entire composition range. Before we end this section, a brief discussion on the challenges in the synthesis of pure and compositionally modified BiFeO3 would be in order. The synthesis of pure BiFeO3 samples through the solid state reaction route is quite challenging because of both kinetic and thermodynamic reasons. BiFeO3 is usually prepared from an equimolar mixture of Bi2O3 and Fe2O3 powders. The phase diagram of Bi2O3-Fe2O3 system reveals that two impurity phases, viz., Bi25FeO39 and Bi2Fe4O9, can be formed along with the perovskite phase BiFeO3.35 The high volatility of Bi2O3 leads to the formation of the Bi-deficient phase Bi2Fe4O9, but a small excess of Bi2O3 in the reactants, often used to compensate for the loss of Bi2O3 (Ref. 36), leads to the formation of Bi-rich phase Bi25FeO39. Differential thermal analysis (DTA) and kinetic investigations have shown that the reaction in an equimolar mixture of BiFeO3 is complex.37 Below 948 K, the reaction is incomplete. From 948 K to 1103 K, BiFeO3 is no longer chemically stable and decomposes very slowly into Bi2Fe4O9, whereas above 1103 K, BiFeO3 separates rapidly into Bi2Fe4O9.38 Because of all these reasons, the temperature stability range of the perovskite phase is very narrow and secondary unwanted phases like Bi36Fe2O57,39 Bi2Fe4O9,40 Bi25FeO39,41 and Bi46Fe2O7242 often appear during the synthesis of pure and compositionally modified BiFeO3 (BiFeO3-rich end). These secondary phases can in principle be leached out by dilute nitric acid,40,41 but their formation will eventually disturb the overall stoichiometry. The formation of secondary phases has a detrimental effect on the physical properties of the sample, since it decreases the resistivity and increases the leakage current of the sample. When we attempt to synthesize BF-xBT solid solutions, the reaction temperature increases with increasing BaTiO3 concentration because BaTiO3 formation requires higher temperatures. This implies that the control of Bi2O3 stoichiometry in BF-xBT samples is even
D. Phase diagram of BF-xBT
As discussed in Sec. I, several workers have studied the structure and multiferroic properties of BF-xBT and have proposed the phase diagram also.23,25,27 However, the results are controversial as far as the crystal structure, location of the phase boundaries, and multiferroic properties are concerned. The temperature dependent dielectric permittivity,20,29 magnetization measurements,16 and the structural studies using laboratory source x-ray,22,43 synchrotron based x-ray,22,29 and neutron powder diffraction,16,44 on BF-xBT samples, synthesized by method-II, have enabled us to construct a phase diagram for the BF-xBT system at room temperature and above. Figure 11 shows a new and updated phase diagram of the BF-xBT system. This phase diagram resolves the controversies about the room temperature crystal structure of BF-xBT and locates the structural phase boundaries correctly. The ferroelectric TC (or T0 max) was obtained from ε0 (T) measurements at 1 MHz in the present work and also our previous studies.20,29 The ferroelectric TC and antiferromagnetic TN for BF-xBT (x < 0.33) reported by Kumar et al.23 are comparatively lower than our observed values, but in good agreement with the TC values reported by Leontsev and Eitel.45 We would like to emphasize that the TC and TN values reported by Kiyanagi et al.27 are much higher than our values. This significant difference in TC values is due to the difference in the synthesis method. Kiyanagi et al. have synthesized BF-xBT samples by method-I, which does not yield
FIG. 11. Phase diagram of BF-xBT above room temperature for samples prepared by method-II. The antiferromagnetic TN shown in this figure is taken from Fig. 4 of Ref. 16.
224101-8
Singh, Kumar, and Pandey
homogeneous solid solution samples. It is evident from Fig. 11 that the TC (or T0 max) of BF-xBT decreases nearly linearly with increasing concentration of BaTiO3 for x < 0.60 and then deviates from the linear behavior for x > 0.60. For x > 0.80, the variation of TC (or T0 max) with x is nonmonotonic. In this composition range, the TC (or T0 max) first decreases gradually with increasing x for 0.60 ≤ x ≤ 0.85 and then begins to increase for x > 0.85. Evidently, BaTiO3 substitution lowers the TC (or T0 max) of BiFeO3 for x ≤ 0.85. Similarly, BiFeO3 substitution in BaTiO3 also lowers TC (or T0 max) for 0.85 ≤ x ≤ 1.0. The value of TC for pure BaTiO3 is slightly less as compared to TC observed for x = 0.96 which may be linked with the smearing of the sharp phase transition of BaTiO3 on BiFeO3 substitution. Such nonmonotonic variation in TC (or T0 max) at the BaTiO3-rich end has also been observed in other (1-x)BiMO3-xBaTiO3 systems [where M = Sc3+, Al3+, (Mg1/2Ti1/2)3+, and (Zn1/2Ti1/2)3+].46–51 The magnetic transition temperature (TN) of the BF-xBT system decreases with increasing concentration of BaTiO3.16 For x > 0.55, BF-xBT solid solutions are paramagnetic at room temperature. IV. CONCLUSIONS
We have presented the results of crystal structure, microstructure, composition analysis, and dielectric studies on BF-xBT solid solutions synthesized by two different methods described in the literature. We have shown that the samples prepared using BaTiO3 and Fe2O3 and Bi2O3 as initial reactants (method-I) are not homogeneous because BaTiO3 does not completely react with Fe2O3 and Bi2O3. The presence of unreacted BaTiO3 in the BF-xBT matrix strongly influences the structure and phase transition behavior of BF-xBT solid solutions. It is shown that BF-xBT solid solutions synthesized using Bi2O3, Fe2O3, BaCO3, and TiO2 as initial reactants (method-II) are homogeneous and yield single phase samples. Furthermore, we have presented a new and updated phase diagram of the BF-xBT system. SUPPLEMENTARY MATERIAL
See supplementary material for the details of Rietveld refinements and EDX analysis of BF-xBT ceramics, synthesized by two different methods. ACKNOWLEDGMENTS
A.S. acknowledges support from the Department of Science and Technology (DST), India, through the award of (DST) inspire faculty (DST/INSPIRE/04/2014/002442). D.P. acknowledges support from the Science and Engineering Research Board of India through the award of J. C. Bose National Fellowship. R. Ramesh and N. A. Spaldin, Nat. Mater. 6, 21 (2007). M. Fiebig, J. Phys. D 38, R123 (2005). 3 T. Kimura, T. Goto, H. Shintani, K. Ishizaka, T. Arima, and Y. Tokura, Nature 426, 55 (2003). 4 K. F. Wang, J. M. Liu, and Z. F. Ren, Adv. Phys. 58, 321 (2009). 5 G. Catalan and J. F. Scott, Adv. Mater. 21, 2463 (2009). 6 W. Kaczmarek and Z. Pajak, Solid State Commun. 17, 807 (1975). 1 2
J. Appl. Phys. 124, 224101 (2018) 7
A. Palewicz, R. Przeniosło, I. Sosnowska, and A. W. Hewat, Acta Cryst. B 63, 537 (2007). 8 A. J. Jacobson and B. E. F. Fender, J. Phys. C 8, 844 (1975). 9 I. Sosnowaska, T. Peterlin-Neumaier, and E. Steichele, J. Phys. C 15, 4835 (1982). 10 Y. F. Popov, A. M. Kadomtseva, S. S. Krotov, D. V. Belov, G. P. Vorob’ev, P. N. Makhov, and A. K. Zvezdin, Low Temp. Phys. 27, 478 (2001). 11 Q. Q. Wang, Z. Wang, X. Q. Liu, and X. M. Chen, J. Am. Ceram. Soc. 95, 670 (2012). 12 A. Singh, V. Pandey, R. K. Kotnala, and D. Pandey, Phys. Rev. Lett. 101, 247602 (2008). 13 N. Itoh, T. Shimura, W. Sakamoto, and T. Yogo, J. Ceram. Soc. Jpn. 117, 939 (2009). 14 S. Bhattacharjee, A. Senyshyn, H. Fuess, and D. Pandey, Phys. Rev. B 87, 054417 (2013). 15 J. P. Patel, A. Singh, and D. Pandey, J. Appl. Phys. 107, 104115 (2010). 16 A. Singh, A. Senyshyn, H. Fuess, S. J. Kennedy, and D. Pandey, Phys. Rev. B 89, 024108 (2014). 17 M. H. Lee, D. J. Kim, J. S. Park, S. W. Kim, T. K. Song, M.-H. Kim, W.-J. Kim, D. Do, and I.-K. Jeong, Adv. Mater. 27, 6976 (2015). 18 A. Singh, A. Senyshyn, H. Fuess, T. Chatterji, and D. Pandey, Phys. Rev. B 83, 054406 (2011). 19 B. Jaffe, W. R. Cook, and H. Jaffe, Piezoelectric Ceramics (Academic Press, New York, 1971). 20 A. Singh, C. Moriyoshi, Y. Kuroiwa, and D. Pandey, J. Appl. Phys. 123, 164103 (2018). 21 R. A. Cowley, S. N. Gvasaliya, S. G. Lushnikov, B. Roessli, and G. M. Rotaru, Adv. Phys. 60, 229 (2011). 22 A. Singh, C. Moriyoshi, Y. Kuroiwa, and D. Pandey, Phys. Rev. B 88, 024113 (2013). 23 M. Kumar, A. Srinivas, and S. V. Suryanarayana, J. Appl. Phys. 87, 855 (2000). 24 S. Prokhorenko, Y. Nahas, and I. Kornev, Phys. Rev. B 90, 140201(R) (2014). 25 I. H. Ismailzade, R. M. Ismailov, A. I. Alekperov, and F. M. Salaev, Phys. Status Solidi 68, K81 (1981). 26 D. Pandey and A. Singh, Bull. Mater. Sci. 32, 361 (2009). 27 R. Kiyanagi, T. Yamazaki, Y. Sakamoto, H. Kimura, Y. Noda, K. Ohyama1, S. Torii, M. Yonemura, J. Zhang, and T. Kamiyama, J. Phys. Soc. Jpn. 81, 024603 (2012). 28 R. A. M. Gotardo, D. S. F. Viana, M. Olzon-Dionysio, S. D. Souza, D. Garcia, J. A. Eiras, M. F. S. Alves, L. F. Cotica, I. A. Santos, and A. A. Coelho, J. Appl. Phys. 112, 104112 (2012). 29 A. Singh, C. Moriyoshi, Y. Kuroiwa, and D. Pandey, Phys. Rev. B 85, 064116 (2012). 30 Juan Rodriguez-Carvajal Laboratory, FULLPROF 2010, Laboratoire Leon Brillouin, CEA-CNRS, France, see http://www.ill.eu/sites/fullprof/. 31 L. E. Cross, Ferroelectrics 76, 241 (1987). 32 E. Courtens, Phys. Rev. Lett. 52, 69–72 (1984). 33 S. P. Singh, S. M. Yusuf, S. Yoon, S. Baik, N. Shin, and D. Pandey, Acta Mater. 58, 5381 (2010). 34 J. S. Kim, C. I. Cheon, C. H. Lee, and P. W. Jang, J. Appl. Phys. 96, 468 (2004). 35 R. Palai, R. S. Katiyar, H. Schmid, P. Tissot, S. J. Clark, J. Robertson, S. A. T. Redfern, G. Catalan, and J. F. Scott, Phys. Rev. B 77, 014110 (2008). 36 G. D. Achenbach, J. Am. Ceram. Soc. 50, 437 (1967). 37 A. Maitre, M. Francois, and J. C. Gachon, J. Phase Equilibria Diffus. 25, 59 (2004). 38 S. M. Selbach, M. A. Einarsrud, and T. Grande, Chem. Mater. 21, 169–173 (2009). 39 A. K. Pradhan, K. Zhang, D. Hunter, J. B. Dadson, G. B. Loiutts, P. Bhattacharya, R. Katiyar, J. Zhang, D. J. Sellmyer, U. N. Roy, Y. Cui, and A. Burger, J. Appl. Phys. 97, 093903 (2005). 40 M. M. Kumar, V. R. Palkar, K. Srinivas, and S. V. Suryanarayana, Appl. Phys. Lett. 76, 2764 (2000). 41 D. Lebeugle, D. Colson, A. Forget, M. Viret, P. Bonville, J. F. Marucco, and S. Fusil, Phys. Rev. B 76, 024116 (2007). 42 C. Tabres-Munoz, J. P. Rivera, A. Bezinges, A. Monnier, and H. Schmid, Jpn. J. Appl. Phys. 24, 1051–1053 (1985). 43 A. Singh, J. P. Patel, and D. Pandey, Appl. Phys. Lett. 95, 142909 (2009). 44 A. Singh, A. Senyshyn, H. Fuess, and D. Pandey, J. Appl. Phys. 110, 024111 (2011).
224101-9
Singh, Kumar, and Pandey
S. O. Leontsev and R. E. Eitel, J. Am. Ceram. Soc. 92, 2957 (2009). K. Datta and P. A. Thomas, J. Appl. Phys. 107, 043516 (2010). 47 H. Ogihara, C. A. Randall, and S. Trolier-McKinstry, J. Am. Ceram. Soc. 92, 110 (2009). 48 H. Yu and Z.-G. Ye, J. Appl. Phys. 103, 034114 (2008). 45 46
J. Appl. Phys. 124, 224101 (2018) B. Xiong, H. Hao, S. Zhang, H. Liu, and M. Cao, J. Am. Ceram. Soc. 94, 3412 (2011). 50 S. Wada, K. Yamato, P. Pulpan, N. Kumada, B.-Y. Lee, T. Iijima, C. Moriyoshi, and Y. Kuroiwa, J. Appl. Phys. 108, 094114 (2010). 51 C.-C. Huang and D. Cann, J. Appl. Phys. 104, 024117 (2008). 49